Undergraduate Business Students’ Perceptions of Accounting Practices and Profession
Aleksandra Pečiūrienė
Vilnius
University of Applied Sciences, Lithuania
Email: a.peciuriene@vvf.viko.lt
ORCID iD: https://orcid.org/0000-0001-9965-0385
Abstract. Attraction of advanced students interested in studying at HEIs for an accounting major degree internationally remains a constant challenge to the accounting profession since the 1990s. To meet the demands it faces, the profession needs to be attractive for students who have the potential to become both technically competent professionals with good analytical abilities and communicative team players, able to understand the expanding business environment and think creatively. Unfortunately, there is a risk that potential students may possess false perceptions of accounting practices and profession. The aim of the research is to explore the perceptions of accounting of the students enrolled in the studies for non-accounting major degree of Professional Bachelor in Business Administration at Lithuanian HEIs. Foremost, the paper analyses the studied assessing approaches and tools used in the notable prior research on the topic. This is followed by the revealed methodology and analysed findings for the research carried out. One of the more important discovers was that the female students assessed the accounting significantly as more definite, boring, precise, and compliance driven than male students. Even considering the abovementioned differences, the results of the perception factors’ analysis strongly suggest that the surveyed students despite their gender in the mass hold traditional stereotypical perceptions of accounting. Due to sufficient number of the surveyed students, findings in overall are applicable to the target group of the research. Finally, the paper provides conclusions, limitations and insights for feasible further research in the study area.
Key words: perceptions of accounting, accounting profession, creativity, students.
JEL Code: M41, M49.
Copyright © 2022 Aleksandra
Peciuriene. Published by Vilnius
University Press. This is an Open Access article distributed under the
terms of the Creative
Commons Attribution Licence, which permits unrestricted use,
distribution, and reproduction in any medium, provided the original author
and source are credited.
Submitted on 02.02.2022
Introduction
Attraction of advanced students interested in studying at HEIs for an accounting major degree internationally remains a constant challenge to the accounting profession since the 1990s. Developing globalisation of economy, growing complexity of businesses, information and financial technology revolution, creation of innovative accounting instruments have had a significant impact on accounting practices from then until nowadays. To meet the demands the profession needs to be attractive for students who have the potential to become both technically competent professionals with good analytical abilities and communicative team players, able to understand the expanding business environment and think creatively. Unfortunately, potential students may possess false perceptions of accounting practices and profession (hereinafter referred to as “perceptions of accounting”). Prior studies on the topic have shown that societal perceptions and stereotypes are important issues influencing students’ decisions about pursuing an accounting career (Saemann & Crooker, 1999; Byrne & Wills, 2005; Jeacle, 2008; Carnegie & Napier, 2010; Bryant et al., 2011; Baxter & Kavanagh, 2012; McDowal et al., 2012; Quezada & Chi, 2013; Bekoe et al., 2018; Hatane et al., 2019). Although students’ perceptions continue to play an important role in their career decision-making, internationally in the last decade there has not been enough studies on the topic in the field of accounting. Moreover, there are no known studies implemented and published in scientific sources by Lithuanian researchers, which specifically investigated undergraduate business students’ perceptions of accounting with regard to their influencing elements.
The aim of the research is to explore the perceptions of accounting of the students enrolled in the studies for non-accounting major degree of Professional Bachelor in Business Administration at Lithuanian HEIs. Accordingly, the main tasks of the research are:
- To study assessing approaches and tools used in the notable prior research on the topic.
- To assess the perceptions of accounting of the target group of the undergraduate business students and determine significant influences on these perceptions.
The main research methods used in the study are the analysis of relevant international sources, questionnaire survey, statistical analysis, comparison and generalization.
Thus, the relevant international sources related to the set out tasks are reviewed as well as methodological background and findings of the research are discussed in the main body of the paper. Finally, conclusions, limitations and insights for further research in the study area are provided.
1. Notable Prior Research
In order to understand the theoretical foundations for assessing students’ perceptions of accounting, it is necessary to look into the so-called “accounting stereotypes” that have prevailed in market economy society over the last few decades.
The leading of them is the so-called “traditional accountant” or “beancounter” stereotype. Briefly describing this is a cynical lay opinion that accounting work is extremely dull, boring, number-fluent, excessively fixated with money, rule-based, obsessed with details, personally and socially inept. Proponents of this stereotype are convinced that fostering creativity in accounting practice is unnecessary, even worse, it is an impediment to its successful execution (Bryant et al., 2011; Baxter & Kavanagh, 2012). In fact, the mentioned believe is unsound. For instance, double-entry system of accounting itself emerged as accounting invention introduced by Luka Pacioli in A Treatise on Records and Accounts (Sokolov, 1994), whose impact on business has been positive and profound. Actually, history has accumulated many more paradigms of genuine creativity application in accounting.
In a significant body of research, executed since the last decades of the 20th century in different fields of social science related to business theory and practice, it has been identified that broadly conceived business creativity is merely essential to a successful business venture and can benefit almost any function of every business organization. In the whole, numerous definitions of business related creativity are convergent to the following: “The ability to produce original and unusual ideas, or to make something new or imaginative” (Cambridge English Dictionary, n.d.).
However, as argued by Amabile (1998), business creativity is not mere expression of highly original ideas. To be creative, an idea must also be appropriate – useful and actionable. It must influence the way business gets done – by improving a product or by opening up a new way to approach a process. In order to enhance creativity in business, three components are needed:
- Expertise (technical, procedural, and intellectual knowledge);
- Creative thinking skills (how flexibly and imaginatively people approach problems);
- Motivation (especially intrinsic motivation).
Thus, the concept of business creativity in overall is applicable to the accounting practices and profession. Although Amabile (1998) has reported that when the surveyed managers were asked, if there was any point they did not want creativity in their companies, about 80% of the replies was “accounting”. Business creativity, in their opinion, is typical just in marketing and R&D but not in the accounting department – or really, in any unit that involves systematic processes or legal regulations. Observed sources suggest that since then big enough mass of society continues to hold a rather narrow view of the creative process in business and still questions the existence of a link between genuine creativity and accounting.
Another major accounting stereotype has been referred to as a “business professional”. As a result internationally the general public en mass believe that some professions (including the accounting) are not permitted the privilege of really and truly creative thought and behaviour. That is precisely why the “creative accounting” phenomenon till nowadays has been commonly associated with fraudulent accounting tricks of unethical “business professionals” and treated contradictory to genuine creativity (Amabile, 1998; Jeacle, 2008; Hillier, 2008; Carnegie & Napier, 2010; Bryant et al., 2011; Baxter & Kavanagh, 2012; Mackevičius & Savickas, 2015; Bachtijeva, 2021, etc.). “Creative accounting” is widely understandable as the exploitation of loopholes in financial regulations in order to gain advantages or present figures in a misleadingly favourable light (Oxford English Dictionaries, n.d.). To prove the pervasion of this view Bryant et al. (2011) conducted an Internet search for the term “creative accounting.” After omitting sponsored links and hits unrelated to accounting, two coders independently classified the first 45 hits. Those hits consisted of 42 websites and 3 book titles: 39 of the hits (or 86.7%) related to the above given definition of “creative accounting” as a deception; 6 hits (or 13.3%) linked to small business accounting and consulting services. Therefore, analysis of the relevant sources shows that the accounting stereotypes, which have been widespread in recent decades, commonly reinforce cynical view on accounting profession and the position of creativity in its practices, thus enhancing unfavourable perceptions of accounting.
Saemann and Crooker (1999) were the first scholars who developed and applied an instrument to capture perceptions of distinct aspects of the accounting profession, which the authors have abbreviated as PAPI. The PAPI originally included 36 pairs of adjectives representing opposing genuinely “creative or creativity friendly” versus “traditional or stereotypical” views on the accounting practices and profession. Approximately one half of the suggested pairs were reverse-coded. The respondents had to tick an appropriate number on the 5-point scale to express the strength of opinion in a particular direction within each pair of adjectives.
Examining the students’ perceptions of accounting Saemann and Crooker (1999) have found that the measurement of 36 variables indicated in the PAPI is an inexpedient analytical undertaken. Consequently, it was a need to reduce the number of variables without compromising the integrity of the study. Further executed an exploratory factor analysis with the principle components extraction method allowed the authors to suggest four distinctive factors captured respondents’ perceptions of accounting (hereinafter referred to as “perception factors”), namely: structure, precision, solitary and curiosity. Eventually Saemann and Crooker (1999) discovered that interviewed undergraduate business and non-business students equally tended to find accounting less attractive or interesting ‒ pro rata more boring, dull, monotonous and tedious ‒ if they stuck to traditional perceptions about structure and solitude of the accounting practices. A differential factor in attracting creative individuals into the profession was related to accessing of the receptiveness and precision of accounting practices.
The PAPI has been internationally applied in a substantial body of differently purposed subsequent studies (including Worthington & Higgs, 2003, 2004; Byrne & Willis, 2005; Bryant et al., 2011; Baxter & Kavanagh, 2012; McDowal et al., 2012). They were aimed at examining students’ perceptions of not only accounting, but also finance and economics as such or in connection with the influences on students’ choice of academic major, career decision, etc. Each study followed the methodology of the accumulated data analysis originally applied by Saemann and Crooker (1999), and employed an exploratory factor analysis with the principle components extraction method. Moreover, the perception factors were selected according to prior theoretical justification and previous empirical research on perceptions of accounting.
Byrne and Willis (2005) identified respectively four below mentioned perception factors and 31 pair of their corresponding more conceptually coherent variables. The internal reliabilities of each perception factor were estimated using Cronbach’s Alpha and ranged from 0.71 to 0.81: Definite – 0.71; Boring – 0.81; Precise – 0.73; Compliance driven – 0.74. These values are acceptable for scales of such kind length and type. The first perception factor, Definite, comprises such pairs of adjectives as ambiguity–certainty, abstract–concrete, intuition–facts, effectiveness–efficiency, unpredictable–routine, dynamic–stable, conceptual–analytical, alternative views–uniform standards. Right-hand adjectives reflect the concrete factual nature of accounting. The second perception factor, Boring, is represented with such pairs of adjectives as interesting–boring, fascinating–monotonous, exciting–dull, absorbing–tedious, prestigious–ordinary, variety–repetition. Right-hand adjectives represent boredom aspects of accounting. The third perception factor, Precise, denotes such pairs of adjectives as imprecise–accurate, verbal–mathematical, decision making–record keeping, superficial–thorough, spontaneous–planned, easy–challenging, overview–details, novelty–methodical. Right-hand adjectives outline precise nature of accounting work. The forth perception factor, Compliance driven, spans such pairs of adjectives as new ideas–established rules, flexible–structured, creative solution–cut & dry, innovation–compliance, adaptable–inflexible, changing–fixed, originality–conformity, extrovert–introvert, people oriented–number crunching. Right-hand adjectives outline rules driven frame of accounting. Then separate variables were created for each of the perception factors using the combined average scores of the individual variables comprising each of them. A higher score of the particular perception factor (in the range from 1 to 5 with neutral average 3) indicates that respondents view accounting pro rata more definite, boring, precise or compliance driven. Byrne and Willis (2005) reported following total mean scores of the determined perception factors: Definite – 3.91; Boring – not provided; Precise – 4.12; Compliance driven – 3.65.
In the study undertaken by McDowal et al. (2012) researchers investigated the same perception factors as Byrne and Willis (2005). The internal reliabilities of each perception factor estimated using Cronbach’s Alpha ranged from 0.67 to 0.82: Definite – 0.75; Boring – 0.79; Precise – 0.67; Compliance driven – 0.82. Herewith the scholars reported the following total mean scores of the explored perception factors: Definite – 3.64; Boring – 3.56; Precise – 3.68; Compliance driven – 3.53.
2. Methodological Background
The target group of the research is the students enrolled in the studies for non-accounting major degree of Professional Bachelor in Business Administration at Lithuanian HEIs. It was not possible to find statistics that precise on the numbers of students specifically enrolled in the above-mentioned studies. However, according to the Lithuanian Department of Statistics (Oficialios statistikos portalas, n.d.), the population of students studied in Lithuanian colleges, non-university HEIs, in the beginning of 2019-2020 academic year (AY) amounted to 32.9 thousand people and in the beginning of 2020-2021 AY it decreased by 1.2% to 32.5 thousand people. The Sample Size Calculator (Creative Research Systems, n.d.) was used to calculate the sample size of the respondents for the study based on that available data. The 95% confidence level together with 5% confidence interval is considered sufficient and acceptable for calculation of the sample size for reflecting the population in empirical researches within the scope of social sciences. Thus, it was estimated that the target group’s sample should be amounted to 380 respondents.
A nonprobability convenience sampling method was used for the selection of respondents. The survey was conducted during 2019-2020 AY and 2020-2021 AY. The students of the Business Management Faculty of Vilnius University of Applied Sciences enrolled in studies for the degree of Professional Bachelor in Business Administration and having the basic accounting courses under their curriculums in 2019-2020 AY and 2020-2021 AY respectively, participated in the survey. The respondents had to complete a survey instrument online before the beginning of the relevant accounting course striving to reveal the perceptions of accounting that they had previously accumulated. The total number of collected and accepted questionnaires amounted to 537 units. Based on this and 95% confidence level, the confidence interval of the actual sample size recalculated using the Sample Size Calculator (Creative Research Systems, n.d.) decreased to 4.2%.
The data used in this research was collected via online survey instrument. The first section of the survey instrument consisted of a range of respondents’ demographic and other profiling questions. The second section of the survey instrument collected the data on the surveyed students’ perceptions of accounting. Mainly it was composed of the modified PAPI with inverted “originally” reverse-encoded pairs of views on the accounting practices and profession. Therefore, all pairs of adjectives on the left side represented “creative or creativity friendly” versus “traditional or stereotypical” views on the right side. The respondents had to tick an appropriate number on the 5-point scale to express the strength of their opinion in a particular direction within each stated pair of views. Besides, in the same section the surveyed students had to indicate various influences on their perceptions of accounting.
Further, the methodology of the accumulated PAPI data analysis introduced by Saemann and Crooker (1999) was applied. The explored perception factors were drawn up conformable to the studies conducted by Byrne & Willis (2005) and McDowal et al. (2012).
The research respected the ethical principles of the respondents’ free self-determination and informed readiness to participate in the survey. The survey was conducted anonymously, and the collected data were processed and made public in a generalised form.
The data collected during the survey was analysed and visualized using the Microsoft Excel and the IBM SPSS Statistics software.
3. Research Findings
Table 1 provides the descriptive statistics on demographic and accounting study data of the surveyed students. In overall 167 or 31.1% of total respondents were male and 370 or 68.9% of them were female. The majority of the respondents were female aged under 29 years old and not experienced in accounting studies (339 or 63.1% of total respondents). Only 20 or 3.7% of total respondents had experienced some prior study of accounting; and 18 or 90.0% of them – equally 9 males and 9 females – were under 29 years old. It is also worth noting that only 26 or 4.8% of total respondents had work experience in the field of accounting; and 25 or 96.2% of them were young people under 29 years old, of which 17 or 68.0% of respondents under 29 years old were females.
Table 1: Descriptive statistics on demographic and accounting study data of surveyed students
Age |
≤ 29 |
≥ 30 |
Overall |
||||||
Gender |
Male |
Female |
Total |
Male |
Female |
Total |
Male |
Female |
Total |
Not studied accounting |
152 |
339 |
491 |
6 |
20 |
26 |
158 |
359 |
517 |
Studied accounting |
9 |
9 |
18 |
0 |
2 |
2 |
9 |
11 |
20 |
Total |
161 |
348 |
509 |
6 |
22 |
28 |
167 |
370 |
537 |
Source: compiled by the author based on the survey data
Figure 1 summarizes the analysis results of the influences on the respondents’ perceptions of accounting in overall. The analysis disclosed that the most important influence was that of the internet (indicated by 412 or 76.7% of total respondents). Other important influences were familiar non-family accountants (indicated by 220 or 41.0% of total respondents), books (195 or 36.3%), movies (190 or 35.4%), broadcasting (156 or 29.1%), personal work experience (146 or 27.2%), accountants family-members (140 or 26.1%), teachers (131 or 24.4%), and earlier studied subjects (117 or 21.8%).
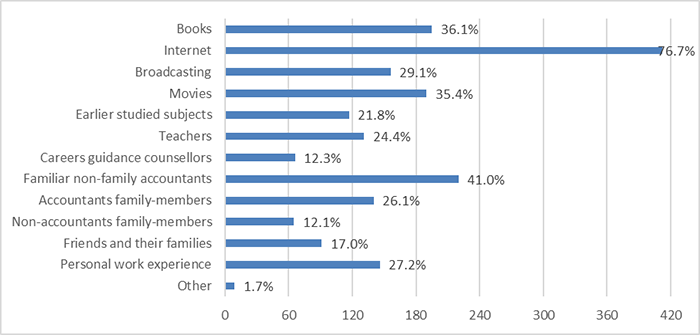
Figure 1: Influences
on the surveyed students’ perceptions of accounting in overall
Source: compiled by the author based on the survey
data
These findings are slightly different from those of Byrne & Willis (2005) and Baxter & Kavanagh (2012). The first study indicated that the earlier studied subjects at school were of the most important influence, followed by the influence of factual media, teachers, fiction media and parents. The other study revealed that teachers (indicated by 50.4% of total respondents) were the most influential, further followed by earlier studied school subjects (40.6%), the internet (36.9%), familiar non-family accountants (35.9%) and books (32.6%).
Figure 2 represents the analysis results of the influences on the respondents’ perceptions of accounting by gender. It separately shows percentages of surveyed female and male respondents who indicated particular influences on their perceptions of accounting. The analysis revealed that the influence of books most differently affected the surveyed male and female students’ perceptions of accounting (difference of 14.2 percentage points, which hereinafter referred to as “pp”). The other influences that have affected male and female respondents’ perceptions of accounting in a sufficiently different way were movies (12.1 pp), internet (9.4 pp), broadcasting (7.3 pp), friends and their families (6.7 pp), and familiar non-family accountants (5.6 pp). Besides, it is worth noting that in particular only familiar non-family accountants, personal work experience and earlier studied subjects influenced higher percentages of surveyed females than males. On the contrary, other particularly influences affected the higher shares of surveyed male students.
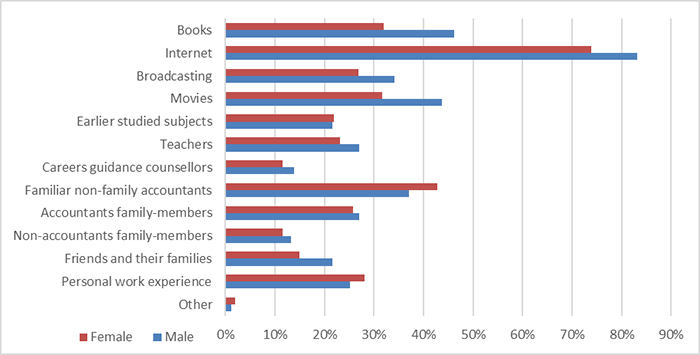
Figure 2: Influences
on the surveyed students’ perceptions of accounting by gender
Source: compiled by the author based on the survey
data
To ensure the consistency with the investigation of Byrne & Willis (2005) and McDowal et al. (2012) on the factors captured respondents’ perceptions of accounting, this research explored the same four perception factors with idem pairs of variables. The internal reliabilities of each perception factor were assessed using Cronbach’s Alpha and ranged from 0.76 to 0.86: Definite – 0.83; Boring – 0.76; Precise – 0.86; Compliance driven – 0.83. Table 2 submits appropriate overall mean scores of each perception factor calculated on gender basis of the respondents and in total. The calculated internal reliabilities and total overall mean scores of the perception factors fairly compare with those reported by Byrne & Willis (2005) and McDowal et al. (2012).
Table 2: Mean scores of the surveyed students’ perception factors
Gender |
Definite |
Boring |
Precise |
Compliance driven |
Male |
3.58 |
3.20 |
3.80 |
3.35 |
Female |
3.85 |
3.35 |
4.10 |
3.57 |
Total |
3.76 |
3.30 |
4.00 |
3.50 |
Sig. (2-tailed) p |
0.000 |
0.035 |
0.000 |
0.001 |
Source: compiled by the author based on the survey data
As it is shown in Table 2, all displayed mean scores of the explored perception factors were higher than 3, which is the midpoint on the used 5-point rating scale. It is notable that all calculated mean scores of the perception factors of surveyed male students were lower than of female students. The carried out independent-samples t-tests allowed to reveal whether the abovementioned differences in the mean scores of the perception factors between the sub-groups of male and female respondents were statistically significant. As it is seen from Table 2 all four perception factors’ p-values are below 0.05 (p<0.05). It means the existence of statistically significant differences in the mean scores of Definite, Boring, Precise and Compliance driven perception factors between surveyed males and females. Furthermore, differences in the mean scores of Definite and Precise perception factors can be treated statistically highly significant as in both cases p-values with an accuracy of three decimal places are below 0.001 (p<0.001). Factually, this suggests that female respondents assessed accounting significantly more definite, boring, precise, and compliance driven than male respondents.
Even considering the observed differences in the mean scores of the perception factors between the gender groups of the respondents, the results of the perception factors’ analysis strongly suggest that the surveyed students despite their gender in the mass held traditional stereotypical perceptions of accounting. In addition, this finding takes on greater importance because 517 respondents (or 96.3%) have not experienced any prior study of accounting and 511 respondents (or 95.2%) had no work experience in the field of accounting.
Further separate multiple linear regressions were deliberated on each of the four perception factors using as independent variables explored socio-demographic data and influences on perceptions of accounting of the surveyed students. Thus, seventeen independent variables: gender, age, studied accounting, work experience in accounting field, books, internet, broadcasting, movies, earlier studied subjects, teachers, careers guidance counsellors, familiar non-family accountants, accountants family-members, non-accountants family-members, friends and their families, personal work experience, and other, - were used in each of the perception factors’ multiple linear regressions (see Table 3).
Despite quite a big number of the independent variables included in the deliberated multiple linear regressions, they were sufficient to explain only 5.9% – 9.4% of total variation in appropriate dependent variables, as the particular regressions’ adjusted R2 ranged from 0.059 to 0.094. Simultaneously p-values for all deliberated regressions in overall indicated that each independent variable had some unidentified correlation with the particular regression’s dependent variable. Statistical analysis of correlation coefficients among the named independent variables showed that absolute majority of them had negligible correlations in-between. Only the correlation coefficient of movies – broadcasting was higher than 0.3 (or 30%) and reached -0.343 (or 34.3%), which pointed at low negative correlation between independent variables of movies and broadcasting.
As it is evident from Table 3, there were two statistically significant explanatory variables for each of the four perception factors’ regressions: careers guidance counsellors and familiar non-family accountants. Unlike familiar non-family accountants variable careers guidance counsellors variable was not reported by the surveyed students among top influences. Furthermore, the latter variable had negative correlation with the dependent variable in each of the four regressions, which means the more respondents relied on careers guidance counsellors the less they perceived accounting as definite, boring, precise and compliance driven. The familiar non-family accountants variable had positive correlation with the dependent variable in each of the four regressions, which means the better respondents were familiar with non-family accountants the more they perceived accounting as definite, boring, precise and compliance driven.
Table 3: Regression estimates of the effects of independent variables on perception factors
Variable |
Coefficients |
Definite |
Boring |
Precise |
Compliance driven |
Constant |
b0 |
3.271 |
3.289 |
3.348 |
3.298 |
t-statistic |
15.961* |
15.501* |
16.671* |
15.932* |
|
Gender |
b1 |
0.242 |
0.103 |
0.283 |
0.184 |
t-statistic |
3.664* |
1.512 |
4.299* |
2.768* |
|
Age |
b2 |
-0.005 |
-0.132 |
0.026 |
-0.165 |
t-statistic |
-0.040 |
-0.938 |
0.192 |
-1.203 |
|
Studied accounting |
b3 |
-0.331 |
-0.337 |
-0.241 |
-0.297 |
t-statistic |
-2.029* |
-1.996* |
-1.482 |
-1.802 |
|
Work experience in accounting field |
b4 |
-0.190 |
-0.407 |
-0.283 |
-0.293 |
t-statistic |
-1.306 |
-2.709* |
-1.953 |
-2.003* |
|
Books |
b5 |
-0.070 |
-0.141 |
0.023 |
-0.088 |
t-statistic |
-1.052 |
-2.046* |
0.343 |
-1.313 |
|
Internet |
b6 |
0.007 |
0.010 |
0.034 |
0.041 |
t-statistic |
0.098 |
0.132 |
0.450 |
0.539 |
|
Broadcasting |
b7 |
0.045 |
0.051 |
0.025 |
0.026 |
t-statistic |
0.621 |
0.677 |
0.347 |
0.350 |
|
Movies |
b8 |
0.059 |
-0.037 |
0.058 |
-0.006 |
t-statistic |
0.840 |
-0.507 |
0.832 |
-0.091 |
|
Earlier studied subjects |
b9 |
0.158 |
0.171 |
0.101 |
0.134 |
t-statistic |
1.966* |
2.063* |
1.256 |
1.659 |
|
Teachers |
b10 |
0.011 |
-0.069 |
-0.047 |
-0.010 |
t-statistic |
0.145 |
-0.912 |
-0.638 |
-0.142 |
|
Careers guidance counsellors |
b11 |
-0.297 |
-0.279 |
-0.211 |
-0.271 |
t-statistic |
-3.109* |
-2.818* |
-2.218* |
-2.808* |
|
Familiar non-family accountants |
b12 |
0.299 |
0.237 |
0.359 |
0.286 |
t-statistic |
4.721* |
3.621* |
5.677* |
4.475* |
|
Accountants family-members |
b13 |
0.003 |
-0.081 |
0.022 |
-0.061 |
t-statistic |
0.039 |
-1.103 |
0.307 |
-0.849 |
|
Non-accountants family-members |
b14 |
-0.018 |
0.048 |
0.030 |
0.009 |
t-statistic |
-0.197 |
0.490 |
0.317 |
0.093 |
|
Friends and their families |
b15 |
-0.008 |
0.020 |
0.020 |
0.029 |
t-statistic |
-0.100 |
0.240 |
0.239 |
0.355 |
|
Personal work experience |
b16 |
-0.060 |
-0.052 |
-0.092 |
-0.049 |
t-statistic |
-0.805 |
-0.681 |
-1.245 |
-0.648 |
|
Other |
b17 |
-0.347 |
-0.316 |
-0.306 |
-0.197 |
t-statistic |
-1.488 |
-1.309 |
-1.315 |
-0.837 |
|
Adjusted R2 |
0.080 |
0.059 |
0.094 |
0.061 |
|
F-statistic |
3.743** |
2.976** |
4.275** |
3.060** |
|
* p<0.05; ** p<0.001 Definite, Boring Precise, Compliance driven – mean score of the appropriate perception factor. Gender – 1 = Male; 2 = Female. Age – 1 ≤ 29; 2 ≥ 30. Studied accounting, Work experience in accounting field, Books, Internet, Broadcasting, Movies, Earlier studied subjects, Teachers, Careers guidance counsellors, Familiar non-family accountants, Accountants family-members, Non-accountants family-members, Friends and their families, Personal work experience, and Other – 0 = No; 1 = Yes. |
|||||
Source: compiled by the author based on the survey data
Positively correlated with the dependent variable in each of the four regressions Gender was statistically significant explanatory variable in three perception factors’ regressions excluding Boring. This is in accordance with the fact that the difference in mean scores of Boring perception factor between surveyed males and females was not estimated as statistically highly significant (see Table 2).
Studied accounting together with earlier studied subjects were significant explanatory variables for two of the four perception factors’ regressions, namely Definite and Boring. However, studied accounting variable had negative correlation with the dependent variables in the mentioned regressions, which means that respondents who experienced accounting studies perceived accounting less definite and boring than those who previously did not study accounting. Conversely, earlier studied subjects variable had positive correlation with the dependent variables in the mentioned regressions, which means that in overall respondents’ earlier studied subjects directly influenced their perceptions of accounting as definite and boring.
Work experience in accounting field was statistically significant explanatory variable for two of the four perception factors’ regressions, namely Boring and Compliance driven. In addition, this variable had negative correlation with the appropriate regressions’ dependent variables, which means that work experience in accounting field in general influenced respondents’ perceptions of accounting as less boring and compliance driven.
Books was statistically significant explanatory variable only for the perception factors’ regressions Boring. Its’ negative correlation with the mentioned dependent variable means that reading of books in overall increased respondents’ perceptions of accounting as less boring.
As it is seen from Table 3 age, internet, broadcasting, movies, teachers, accountants family-members, non-accountants family-members, friends and their families, personal work experience, and other variables’ t-statistics and p-values did not allow assigning them to significant explanatory variables in any of the four perception factors’ regressions. It is worth noting that internet and broadcasting variables had positive correlations with the dependent variables in each of the four perception factors’ regressions. Non-accountants family-members and friends and their families variables were positively correlated to three perception factors’ dependent variables excluding Definite. Personal work experience and other variables had negative correlations with the dependent variables in each of the four factors’ regressions. Age and Teachers were negatively correlated to some three non-identical perception factors’ dependent variables. Movies and accountants family-members variables had positive correlations with the dependent variables of Definite and Precise regressions, and, on the contrary, had negative correlations with the dependent variables of Boring and Compliance driven regressions.
Conclusion
Critically many managers and the general public en mass commonly hold a rather narrow view on the creativity in business. Based on this view the accounting profession is not permitted the privilege of really and truly creative thought and behaviour. Apparently, this view is related to such accounting stereotypes as “traditional accountant” and “business professional”. Both stereotypes reinforce cynical view on the accounting profession and enhance unfavourable perceptions of accounting in in market economy society over the last few decades.
Saemann and Crooker (1999) were the first scholars who developed and applied an instrument to capture perceptions of distinct aspects of the accounting profession, which the authors had abbreviated as PAPI. The PAPI has been internationally applied in a substantial body of differently purposed subsequent studies aimed at examining students’ perceptions of not only accounting, but also finance and economics as such or in connection with influences on their choice of academic major, career decision, etc. Each study followed the methodology of the accumulated data analysis originally applied by Saemann and Crooker. Application of the PAPI in this research enabled making certain comparisons with particular results of prior studies.
This research enabled to determine how the surveyed students perceived accounting and to identify the main influences on these perceptions. The most important respondents’ self-reported influence on perceptions of accounting was the internet, followed by such influences as familiar non-family accountants, books, movies, broadcasting, personal work experience, accountants family-members, teachers and earlier studied subjects. These findings are slightly different from those of other relevant prior studies.
To ensure the consistency with preceding studies on the factors captured respondents’ perceptions of accounting, the same four perception factors – Definite, Boring, Precise, Compliance driven – with idem pairs of variables were explored in this research. The calculated internal reliabilities and total overall mean scores of the perception factors fairly compare with those reported in the relevant prior studies. It is notable that all calculated mean scores of the perception factors of surveyed male students were lower than those of female students. The carried out independent-samples t-tests allowed to identify statistically significant differences in the mean scores of Definite, Boring, Precise and Compliance driven perception factors between surveyed males and females. Factually, this suggests that the female respondents assessed the accounting significantly more definite, boring, precise, and compliance driven than the male respondents. Even considering the abovementioned differences, the results of the perception factors’ analysis strongly suggest that the surveyed students despite their gender in the mass hold traditional stereotypical perceptions of accounting. In addition, this finding takes on greater importance because 96.3% of respondents have not experienced any prior study of accounting and 95.2% of respondents had no work experience in the field of accounting.
For further analysis of the perception factors, multiple linear regressions were deliberated using as independent variables explored socio-demographic data and influences on perceptions of accounting of the surveyed students. In total 17 independent variables included in each of multiple linear regressions were sufficient to explain only 5.9% – 9.4% of total variation in appropriate dependent variables. Simultaneously each independent variable had some unidentified correlation with the particular regression’s dependent variable. Statistical analysis of the correlation coefficients among the applied independent variables showed that they had negligible or low correlations in-between. In overall, the conducted regression analysis enabled to identify two statistically significant explanatory variables for each of the four perception factors’ regressions: careers guidance counsellors and familiar non-family accountants. Unlike familiar non-family accountants variable careers guidance counsellors variable was not reported by the surveyed students among top influences. Furthermore, careers guidance counsellors variable had negative correlation with the dependent variable in each of the four regressions, which means the more respondents relied on careers guidance counsellors the less they perceived accounting as definite, boring, precise and compliance driven. The familiar non-family accountants variable had positive correlation with the dependent variable in each of the four regressions, which means the better respondents were familiar with non-family accountants the more they perceived accounting as definite, boring, precise and compliance driven.
Due to sufficient number of the respondents participated in the accomplished survey given conclusions in overall are applicable to the target group of the research with 4.2% confidence interval.
Limitations and insights
The data reported in the paper is a subject to several limitations. First, the survey was implemented at the faculty of only one university of applied sciences. Second, all investigated data was self-reported by the surveyed students. It is possible that some of the students may consciously reported inaccurate or embellished information. However, the survey was conducted under anonymity, which should help to reduce the risk of bias.
There are several opportunities for feasible further study arising from the limitations and results of this research. In order to reduce the risk of bias, the research issues would benefit from further replication. Finally, it is purposive to expand the target group of the research by including undergraduate students enrolled in university studies and (or) in studies for accounting major degrees at Lithuanian and (or) foreign HEIs.
References
Bachtijeva, D. (2021). Assumptions, Types of Accounting Manipulations and Their Application. Buhalterinės apskaitos teorija ir praktika, 23, 5. https://doi.org/10.15388/batp.2021.33
Baxter, P., & Kavanagh, M. (2012). Stereotypes, students’ perceptions and inherent creativity: Further Australian evidence. Australasian Accounting Business and Finance Journal, 6(5), 81-100. https://ro.uow.edu.au/cgi/viewcontent.cgi?article=1399&context=aabfj.
Bekoe, R.A., Owusu, G.M.Y., Ofori, C.G., Essel-Anderson, A., & Welbeck, E.E. (2018). Attitudes towards accounting and intention to major in accounting: A logistic regression analysis. Journal of Accounting in Emerging Economies, 8(4), 459-475. https://doi.org/10.1108/JAEE-01-2018-0006
Bryant, M., Stone, D., & Wier, B. (2011). An exploration of accountants, accounting work, and creativity, Behavioral Research in Accounting, 23(1), 45-64. https://doi.org/10.2308/bria.2011.23.1.45
Byrne, M., & Willis, P. (2005). Irish secondary students’ perceptions of the work of an accountant and the accounting profession, Accounting Education: An International Journal, 14(4), 367-381. https://doi.org/10.1080/06939280500346003
Cambridge English Dictionary (n.d.). http://dictionary.cambridge.org/dictionary/english/.
Carnegie, G., & Napier, C. (2010). Traditional accountants and business professionals: Portraying the accounting profession after Enron. Accounting, Organizations and Society, 35(3), 360-376. https://doi.org/10.1016/j.aos.2009.09.002
Creative Research Systems. (n.d.). Sample Size Calculator. https://www.surveysystem.com/sscalc.htm.
Hatane, S.E., Willianto, K.A., Junaidi, C.P, & Jessica, C. (2019). The dimensions of accounting profession in the view of high school students as the generation z. Journal of Education and Learning, 13(4), 550-550. https://doi.org/10.11591/edulearn.v13i4.13370
Jeacle, I. (2008). Beyond the boring grey: The construction of the colourful accountant. Critical Perspectives on Accounting, 19(8), 1296-1320. https://doi.org/10.1016/j.cpa.2007.02.008
Mackevičius, J. & Savickas, V. (2015). Manipuliacinės kūrybinės apskaitos anatomija ir jos informacijos naudojimas. Informacijos mokslai, 71, 124-134. https://doi.org/10.15388/Im.2015.71.8337
McDowall, T., Jackling, B., & Natoli, R. (2012). Are we there yet? Changing perceptions of accounting as career preference, The International Journal of Learning, 18(4), 335-352. https://doi.org/10.18848/1447-9494/CGP/v18i04/47574
Oficialios statistikos portalas. (n.d.). Kolegijų studentai 2016-2017 – 2020-2021 m.m. https://osp.stat.gov.lt/statistiniu-rodikliu-analize?indicator=S3R258#/.
Oxford English Dictionaries. (n.d.). https://en.oxforddictionaries.com/.
Quezada, A., & Chi, Y.N. (2013). Knowing how business students choose accounting as a major. Journal of Business and Economics, 4(2), 124-134. http://www.academicstar.us/issueshow.asp?daid=756
Saemann, G.P., & Crooker, K.J. (1999). Student perceptions of the profession and its effect on decisions to major in accounting. Journal of Accounting Education,17(1), 1-22. https://doi.org/10.1016/S0748-5751(99)00007-X
Sokolov, Ja. (ed.) (1994). Traktat o schetah i zapisjah / Luka Pacholi [A Treatise on Records and Accounts / Luka Pacioli]. Moskva: Finansy i statistika.
Worthington, A., & Higgs, H. (2003). Factors explaining the choice of a finance major: the role of students’ characteristics, personality and perceptions of the profession. Accounting Education: An International Journal, 12(3), 261-281. https://doi.org/10.1080/0963928032000088831
Worthington, A., & Higgs, H. (2004). Factors explaining the choice of an economics major: the role of student characteristics, personality and perceptions of the profession. International Journal of Social Economics, 31(5/6), 593-613. https://doi.org/10.1108/03068290410529416
Aleksandra Pečiūrienė: Socialinių mokslų daktarė, Vilniaus kolegijos Verslo vadybos fakulteto Verslo inovacijų katedros docentė. Moksliniai interesai: buhalterinė apskaita, finansinė analizė, andragogika, kūrybiškumas ir verslo inovacijos. Institucijos adresas: Didlaukio g. 49, LT-08303, Vilnius.
Aleksandra Pečiūrienė: Doctor of social sciences, Associate Professor of Business Innovation Department at the Faculty of Business Management of Vilnius University of Applied Sciences. Scientific interests: accounting, financial analysis, andragogy, creativity and business innovations. Address of institution: Didlaukio str. 49, LT-08303, Vilnius.