Information & Media ISSN 1392-0561 eISSN 1392-1487
2022, vol. 93, pp. 176–191 DOI: https://doi.org/10.15388/Im.2021.91.55
Audience and Revenue Concentration in Lithuanian Media Markets (2008–2019)
Deimantas Jastramskis
Vilnius University, Faculty of Communication
deimantas.jastramskis@kf.vu.lt
ORCID: https://orcid.org/0000-0001-8439-5297
Giedrė Plepytė-Davidavičienė
Vilnius University, Faculty of Communication
giedre.plepyte-davidaviciene@kf.vu.lt
ORCID: https://orcid.org/0000-0003-0301-8903
Summary. The article examines the change in audience and revenue concentration in the Lithuanian television, radio, internet, and newspaper markets in 2008–2019, as well as discusses the factors that determined the changes in media concentration and market structure. The study revealed that without any special measures to regulate media concentration in Lithuania, all four media revenue markets (television, radio, internet, and newspapers) have become highly concentrated. In terms of audience (circulation) concentration, the concentration of newspaper and television markets was divided between unconcentrated and moderately concentrated areas, the radio audience was moderately concentrated, and the audience of internet news websites was highly concentrated. The results of the analysis show a tendency for audience concentration in media markets to be generally lower than income market concentration. Therefore, when legally defining a dominant position in media markets, it is recommended to set a lower value for audience share than for revenue market share.
Keywords: media concentration; media market; audience share; revenue share.
Received: 05/05/2021. Accepted: 04/11/2021
Copyright © 2022 Deimantas Jastramskis, Giedrė Plepytė-Davidavičienė. Published by Vilnius University Press. This is an Open Access article distributed under the terms of the Creative Commons Attribution Licence, which permits unrestricted use, distribution, and reproduction in any medium, provided the original author and source are credited.
Introduction
The high level of media concentration, when the media market is dominated by few organizations, creates conditions for less diversity of media content. As a result, citizens may lack the necessary information to make appropriate decisions, which may have a negative impact on the functioning of democracy. To avoid such a situation, certain legal regulations may be applied that stimulate greater media competition and prevent a high level of media concentration, as well as an oligopoly, and even more so a monopoly, in the media market.
Legal measures restricting media concentration in democracies are used not only to reduce the concentration of the media in the hands of a small number of owners and to promote media pluralism but also to increase the independence of the media from political actors. This is particularly important in small countries (markets), where it is much easier for a small number of powerful businesses (potentially related to politicians) to concentrate media ownership and dominate media markets than in large countries. Most European Union (EU) countries set additional standards to regulate media ownership (market) concentration in addition to general market concentration limits. A study of media concentration regulation in the EU and the United Kingdom (UK) found that 14 EU countries and the UK have very or moderate regulation of media concentration, with 10 EU countries applying a light regime for media concentration regulation, and only 3 EU countries do not have any measures to regulate media concentration (Ranaivoson et al., 2021). In this study, Lithuania was classified as one of the countries that easily regulates media concentration.
There are no special legal acts in Lithuania that would restrict the ownership concentration of the media organisations or the shares of the market that they occupy. The dominant position in the media market as well as another area of economy (except for an economic entity engaged in retail trade) is defined when the market share of an economic entity is no less than 40 percent. Also, each group of three or a smaller number of economic entities with the largest shares of the relevant market, jointly holding 70 percent or more of the relevant market shall be considered as occupying the dominant position (Law on Competition, 2020). This means that only horizontal media concentration (in the case of acquisitions and mergers) is formally restricted in Lithuania. Such regulation is of a purely economic, as it takes into account market shares expressed in terms of revenue. In the case of the media, when the ultimate goal of regulation should be to ensure media diversity and pluralism, it is important and what parts of the audience are concentrated by market participants, which is not the object of regulation in Lithuania.
There are several works in which the level of media audience concentration in Lithuania was assessed. L. Nevinskaitė (2004) analyzed the horizontal concentration of media in the markets of Lithuanian dailies (1998–2000), television and radio (1994–2003). The concentration in the Lithuanian television market was assessed in 2004 (Peruško, Popoviç, 2008), in the Lithuanian daily, television and radio markets – in 2000–2014, and the internet market – in 2007–2014 (Jastramskis, Rožukalne, Jõesaar, 2017). The participants of the project “Media Pluralism Monitor” assessed the risks of Lithuanian media pluralism and concentration in 2015–2019 (Balčytienė, Juraitė, Nugaraitė, 2015; Balčytienė, Juraitė, 2016, 2018, 2020). The concentration of the Lithuanian media market in economic terms (on which the current regulation is based) has not been examined. To assess the situation of media concentration and the market structure in more detail, both economic (revenue) and audience based criteria should be used.
This article aims to examine the level and change of audience and revenue concentration in Lithuanian media markets (2008–2019), to discuss the factors that determined the dynamics of media markets, and to assess changes in audience and revenue structure in a comparative perspective.
Assessment and regulation of media concentration
Media organizations, like other economic entities, strive to gain as much market share as possible and attract more consumers. More successful media organizations can naturally focus on a larger audience and even begin to dominate the market. There are also specific economic factors that encourage the concentration of media markets: high and growing fixed costs, excess supply, price deflation, convergence of technology, etc. Besides, new media are more capital-intensive than conventional media. Their scale economies are greater and tend to be highly concentrated (Noam, 2016; Picard, Pickard, 2017). It is also important to emphasize that the presence of strong global players in national markets (Facebook, Google, YouTube, etc.) and the increasing competition in the online advertising market create an additional need for local organizations to concentrate the ownership and capital of media organizations and other sectors (such as telecommunications) to remain competitive. In this context, it is particularly important to analyze the change in the structure of media markets and to apply appropriate regulatory measures to preserve at least a minimum of external pluralism.
Many specific regulations on media concentration tend to address additional restrictions on market share and/or shareholdings in media organizations. In this way, efforts are made to limit the economic power of media organizations, which can be transformed into communicative power. Assessing the regulation of media concentration according to economic criteria, among the Baltic states, only Latvia distinguishes slightly in this respect, where the controlled market share in mergers or acquisitions of electronic media organizations may not exceed 35%, but in the case of other media, a dominant position is considered to be at least 40% market share (Electronic Mass Media Law, 2020).
Looking at other small post-communist EU countries - Slovenia, Croatia, Slovakia – one can notice a completely different approach to the regulation of media concentration compared to the Baltic countries. In Croatia, Slovakia, and Slovenia, particular attention is paid to the regulation of broadcasters’ ownership and broadcasting markets and to the limitation of cross-media concentration. In Croatia, a national television or radio broadcaster may not hold more than 25% of the shares of another national television or radio broadcaster and no more than 10% of the shares if another television or radio station company publishes a daily newspaper with a circulation of more than 3000 (and vice versa) (Peruško, 2021). In Slovakia, national cross-media ownership (television, radio, and periodical press) cannot be owned, except for the public service broadcaster (Polák, 2021). In Slovenia, cross-media ownership rules prohibit radio station owners from controlling television stations (and vice versa). Also, owners of radio and television stations cannot control more than 20% of the daily organization’s shares or voting rights (and vice versa) (Milosavljević, 2021). Media market shares and/or organizational ownership are further restricted in larger European countries: Austria, Czechia, France, Italy, the United Kingdom, etc. (Ranaivoson et al., 2021).
When the only market (ownership) and/or revenue (turnover) shares are assessed, media policy researchers question whether this is sufficient to assess media pluralism, so an alternative is proposed to measure (regulate) the share of audiences concentrated by media organizations. Looking at media concentration even more strictly, in addition to the above-mentioned cross-media concentration, it is possible to reduce the marginal revenues of companies when the permission of the supervisory authority is required in the case of mergers and acquisitions (Noam, 2004; Just, 2009), because a larger firm can join several smaller firms and substantially increase its market share while avoiding control by the competition authority.
To curb concentration in the broadcasting sector, the number of licenses issued to media organizations to broadcast television and radio programs may be limited (Wagner-Hatfield, 2016), which prevents media organizations from mobilizing a larger audience and at the same time generating more revenue. Such a regulatory measure was tested in Estonia between 2002 and 2010 when the number of national television broadcasting licenses was limited to two (Jõesaar, 2015), which helped to maintain a relatively low level of television audience concentration. In Latvia, the number of licenses for commercial broadcasters was limited to three licenses between 1995 and 2010, which allowed public radio to gain a significant advantage in the audience sharing with commercial broadcasters (Jastramskis, Rožukalne, Jõesaar, 2017).
In Slovakia, one person may hold no more than one television or radio license, except for the broadcasting of monothematic television programs (Polák, 2021). In Cyprus, no one legal entity can obtain more than one television broadcasting license (Themistokleous, 2021). In Czechia, one person can obtain only one national license for analogue broadcasting, no one person can hold more than two national digital television or radio licenses when is authorised the distribution of full-time programmes (Ranaivoson et.al., 2021). In Greece, the owner of an information TV channel may operate no more than one non-information TV channel, and a licensed pay-TV/pay-radio provider may obtain only one license for a free-to-air radio or television station (Psychogiopoulou, 2021).
It is worth noting that some countries use a permissible audience share to measure (regulate) media concentration, which may be more important in facilitating the development of media content diversity than in assessing concentrated revenue market shares. In Germany, the audience share criterion has been used since 1997 to assess concentration in the national television market: dominant opinion-forming power is considered to exist when the broadcaster reaches 30% of the average annual audience or 25% if the company dominates a market relevant to the media (Just, 2009; Dreyer, 2021). In Romania, national broadcasters’ organizations can acquire no more than 30% of the audience, except for the public service broadcaster (Iordache, 2021). In Spain, license holders of national TV broadcasters cannot control (by aggregating all controlled channels) more than 27% of the total audience in the case of a merger (Llorens, 2021).
An integrated approach to the regulation of media concentration, with both economic and audience share constraints on media organizations, is relatively rare. In Belgium (Fédération Wallonie-Bruxelles), a person holding more than 24% of the shares in a television broadcaster may not hold more than 24% of the capital of another television broadcaster (Tintel, 2021). In France, a person cannot have more than 49% of the rights to the capital of national television when the average annual audience of television is at least 2.5% of the total audience (Ranaivoson et al., 2021).
Although there are very different types of media concentration restrictions in European countries, it should be noted that most restrictions are imposed on broadcasters, especially in the television sector. In some cases, specific restrictions on media concentration are waived, leaving regulation under general competition law, such as in the Netherlands (2011) and Norway (2016) (Østbye, 2017). This is partly due to the convergence of media in the internet age, when it is more difficult to identify market boundaries and when an optimistic outlook for the development and competition of the internet space is constructed. In general, most of the specific restrictions on media ownership, and market concentration focus on the traditional media sectors (television, radio and periodical press), leaving online media aside, and more specifically on the general regulatory regime applicable to many other economic entities.
Assessing the Baltic and Nordic regions in terms of regulating media concentration, it can be stated that relatively liberal approaches to competition processes in media markets prevail here. Estonia and Latvia have waived the limitation of the number of licenses for broadcasters and the limitation of ownership in media organizations for certain entities. Norway has repealed the above-mentioned special media ownership law, which regulates specific media concentration rules. Denmark, Sweden, Finland, and Lithuania, on the other hand, did not have any tangible work to do in this area of regulation. Lithuania differs slightly only in that it has compiled a list of several entities that cannot become producers of public information at all (state and municipal institutions, banks) or do not have the right to obtain broadcasting licenses. However, all entities operating in the Lithuanian media field do not have any special regulatory obligations in terms of concentration (or dominance).
Audience shares mobilized by media organizations and revenue segments generated in the market should theoretically be related, as only a larger audience can lead to higher revenue (from advertising and subscriptions). However, in a competitive environment, with different marketing tools and different content created by organizations, audiences of similar size can be mobilized, but revenue levels can vary significantly. In addition, an audience of similar size may differ in its qualitative structure and this may lead to different revenue shares in the market. In this way, different audience and revenue market structures can lead to different levels of audience and revenue concentration in a given media market. Therefore, when measuring and regulating media concentration, it is best not to choose between economic and audience criteria, but to apply both criteria together (Iosifidis, 2010), which would provide more detailed information on structural market processes and media competitive potential leading to pluralism and diversity of content.
Methodology
The level of audience and revenue concentration was calculated in the Lithuanian national television, radio, internet, and newspaper markets. National participants in the television, radio, and newspaper markets included undertakings whose television and radio programs are received, and newspapers are distributed in the territory where more than 60% of the Lithuanian population lives, using the criterion applied in the Law on the Provision of Information to the Public (2021), which defines national radio and television programs and national newspapers. Due to the availability of the internet in almost the entire territory of Lithuania, it is not necessary to apply an analogous territorial criterion to the Internet market.
Media concentration index. The C4 index and the Herfindahl-Hirschman index (HHI) are most commonly used in research to measure the horizontal concentration of the media market. The C4 index indicates the sum of the market shares of the four largest market players but does not provide a clearer picture of the market structure and does not assess the impact of smaller organizations outside the four largest market players on concentration, although their role in the market may be significant. The Herfindahl-Hirschman index is calculated by squaring the market share of each market organization and summing the resulting figures (Noam, 2016). It is the sum of the squares of the percentage market shares obtained. The HHI index can theoretically range from 0 to 10,000. The Herfindahl-Hirschman index is more informative than the C4 index because it takes into account both the importance of organizations with a smaller market share in the market and more clearly reflects the market structure.
The Horizontal Merger Guidelines of the U.S. Department of Justice and the Federal Trade Commission (2010) state that a market with an HHI of less than 1,500 is defined as unconcentrated. When the HHI ranges between 1500 and 2500, the market is moderately concentrated, and when the HHI is higher than 2500, the market is highly concentrated. The Guidelines on the assessment of horizontal mergers under the Council Regulation on the control of concentrations between undertakings (European Commission, 2004) specify three HHI levels: less than 1000, between 1000 and 2000, and more than 2000 (without indicating whether these levels mean low, medium or high concentration). As companies merge in the market and the HHI is calculated, not only the absolute size of this index is important, but also its change. Therefore, both the guidelines of the U.S. Department of Justice and the Federal Trade Commission and the guidelines of the European Commission, together with the HHI level, indicate possible changes in the HHI after the merger.
Taking into account the discussed aspects of the horizontal concentration calculation indices, the Herfindahl-Hirschman index was chosen to assess the horizontal concentration of Lithuanian media markets. HHI is used not only to measure economic market concentration but also to measure audience concentration (Van Cuilenburg, 2007), which is relevant to the goal of this study. The application of HHI in assessing the concentration of media markets in many foreign countries (Noam, 2016; Ranaivoson et al., 2021) allows us to compare the concentration levels of media markets in Lithuania and other countries.
As the Horizontal Merger Guidelines of the U.S. Department of Justice and the Federal Trade Commission accurately describe the values of HHI levels, the following ranking of HHI levels was chosen for the assessment of Lithuanian media market concentration: 1) HHI less than 1500 – unconcentrated market, 2) HHI from 1500 to 2500 – moderately concentrated market and 3) HHI more than 2500 – highly concentrated market. The calculation of the media concentration index HHI included those market participants who had a share of at least 2% in the audience or revenue markets, as the shares of very small market participants do not affect the HHI level significantly (European Commission, 2004). If an organization administers more than one media outlet (or market participants are linked by ownership) and the audience and revenue are accumulated (as part of the same media group), less than 2% of the market shares of individual entities in the same media group were included in the total. To assess as accurately as possible the internet and newspaper revenue markets, which are quite fragmented and have a large number of small audiences and revenue-generating players (unlike national TV and radio markets), financial data (revenue) of those participants whose audience share was at least 1% was collected and systematized. After calculating the percentages of all organizations in the revenue market, those participants who controlled at least 2% were selected for the calculation of the HHI.
Research data and sources. The annual television audience share (the proportion of total time spent on a specific television channel) is used to calculate the television audience concentration index. The annual audience share of radio stations (the share of total listening time per specific radio channel) was used to calculate the radio audience concentration index. Television and radio audience data were provided by the market research company Kantar. The annual audience share of websites was used to calculate the market concentration of the internet audience, based on the data of the internet audience research company Gemius Baltic (Gemius Audience, 2020). This indicator shows the ratio of the time spent by real users on a particular website to the total time spent by internet users on the surveyed websites (Gemius Baltic, 2019). The newspaper market concentration index was calculated based on the average circulation of one issue, estimating the percentage of the circulation of each publication in the total circulation of all publications in the market. The study is based on the circulation numbers declared by newspaper publishers and presented in their publications. In addition, the circulation data of the publications were revised on the basis of the database of the Ministry of Culture on the producers and disseminators of public information.
Organizations’ revenues from media activities were used to calculate media market revenue concentration indices. The revenue of enterprises was systematized on the basis of the annual financial statements and explanatory notes of enterprises submitted to the State Enterprise Centre of Registers (hereinafter – the Centre of Registers). Inquiries have also been sent to media organizations, market research organizations and revenue data are being revised, as some media organizations have not submitted all their annual financial statements to the Centre of Registers or the revenue data provided were not sufficiently detailed.
Results
Concentration of the television market. At the end of the analyzed period (2019), almost half of the television audience was concentrated by two groups of television channels (TV3 group – 22.6%, LNK group – 25.2%). Public broadcaster (the LRT group) was in third place according to the audience – 14.9%. BMA LT, which administers advertising sales on rebroadcasted Russian television channels, and Lietuvos Rytas television audience shares accounted for 5.5% and 3.7%, respectively (Kantar, 2009–2020). The HHI of the 2019 audience was 1412 (Figure 1) and this means that the Lithuanian television market can be considered unconcentrated, but close to the medium concentration margin. The biggest change in the structure of the television audience took place in 2013 when the audience concentration index increased from 1099 (in 2012) to 1755. This increase in concentration was mainly due to the sale of Baltic TV to the LNK Group (Gintautaitė, 2012), whose audience share increased by almost 10 percentage points in 2013 (compared to 2012) and which became the market leader in 2013–2019 (in 2014, this group gained as much as 31.4% of the audience share – the largest among all television groups in the period 2008–2019).
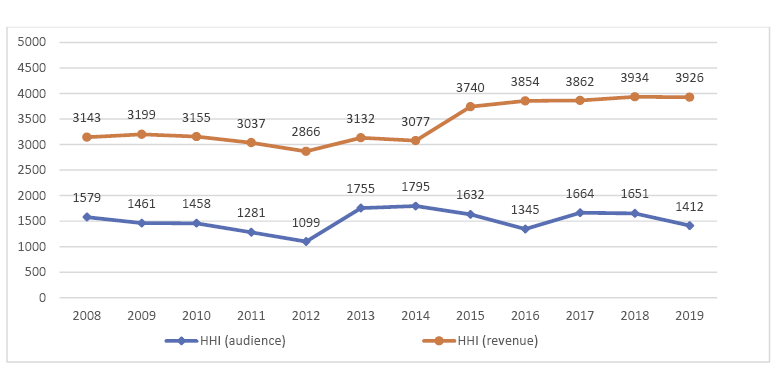
Figure 1. Concentration (HHI) of the national television market (2008–2019).
Sources: authors, based on Kantar (2009–2020), Centre of Registers (2020).
While the television audience was moderately concentrated or unconcentrated, the television revenue market was highly concentrated in 2008–2019, with the HHI exceeding 3000 (except in 2012) (Figure 1). The bulk of the television revenue market share went to two channel groups: the TV3 group and the LNK group. During the study period, the LNK group have gained from 33.2% (2012) to 44.7% (2017), and the TV3 group from 38.9% (2014) to 45.9% (2019) of the revenue market. Together, these two largest market players gained from 72.6% (2012) to 88.1% (2018) of the revenue market (Center of Registers, 2020).
The concentration of television market revenue increased significantly in 2015 (Figure 1), after changing the LRT financing model and eliminating advertising in LRT programs (LRT was left with the opportunity to receive commercial revenue only from sponsorship announcements and broadcasting of cultural, social, and political information). As a result, LRT’s revenue share in the market decreased from 8.3% (2014) to 2.3% (2015). It should be noted that due to the decrease in LRT’s commercial revenues, the main revenue market share was redistributed in favour of the major TV channel groups (TV3 and LNK groups) (Center of Registers, 2020).
In the case of the television market, there is a very large difference between audience and income concentration indices and levels (Figure 1). This shows a significant disproportion between the structure of the time spent by the television audience and the structure of the revenue market.
Concentration of the radio market. At the end of the study period (2019), almost two-thirds (64.1%) of the audience were concentrated by two groups of radio stations: M-1 (42.4%), and Radiocentras (21.7%). Slightly more than a tenth of the audience was acquired by the LRT group (13.5%). The remaining four national radio stations had less than 5% of the audience share (Kantar, 2009–2020). The Lithuanian radio audience in 2008–2018 was at a medium concentration level, and in 2019 it reached a high concentration level (Figure 2).
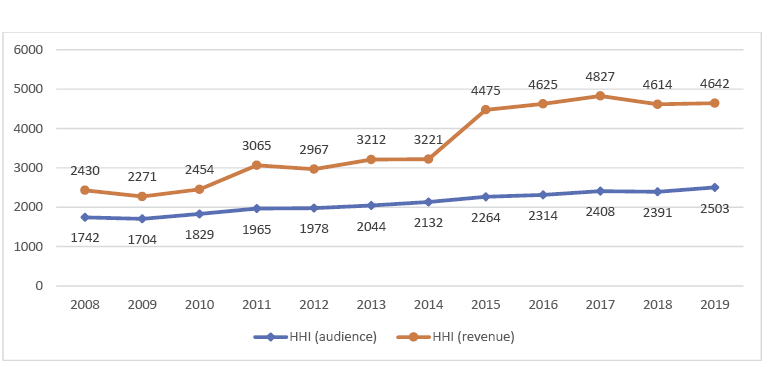
Figure 2. Concentration (HHI) of the national radio market (2008–2019).
Sources: authors, based on Kantar (2009–2020), Centre of Registers (2020).
The radio revenue market was moderately concentrated between 2008 and 2010 and has become highly concentrated since 2011 when the M-1 group generated more than half of all market revenue. Since 2015, the HHI of the radio revenue market has exceeded 4000 and remained relatively stable until 2019, when the value of 4642 was fixed (Figure 2). A significant jump in radio income market concentration was recorded in 2015. As in the discussed television market, such an increase in concentration in the radio market was due to the changed LRT financing model and the elimination of most commercial information from the LRT group. It should be noted that in 2015 the share of the M-1 group in the radio revenue market increased even more significantly – by almost 13 percentage points (from 52.1% in 2014 to 64.9% in 2015) (Center of Registers, 2020).
An increase in radio market concentration was recorded throughout the period 2008–2019. This increase in concentration was mainly due to the growth of the M-1 group’s audience and revenue share. Compared to the trends in TV market concentration, it can be observed that in the radio market in 2008–2010 there was no such significant difference between audience and revenue HHI values, i.e. the time structure of radio audience was quite proportional to the revenue distribution structure among market participants (Figure 2). Only since 2011, when the M-1 group earned about half of the revenue circulating in the market, the gap between radio audience and revenue concentration (HHI) has widened significantly, and since 2015 it has widened even further. The HHI of the radio market revenue has become almost twice as high as the HHI of the audience, indicating a fairly significant disproportion between the time structure of the radio audience and the time structure of the revenue distribution.
Concentration of the internet market. The Lithuanian Internet market differs from other media markets because a large part of internet advertising revenue goes not to Lithuanian Internet companies, but to global corporations – mainly Facebook, Google, and YouTube. In 2019, the total revenue from online advertising amounted to about 110 million euros (Delfi.lt, 2020), of which 42% were banner advertising on Lithuanian websites (21%), video advertising on Lithuanian video websites (6%), and mobile advertising (15%). 56% of online advertising revenue went to global networks: Facebook (19%), Google search (13%), YouTube (11%), and Google Display Network (13%). Although part of the Google Display Network advertising revenue distributed on the market throughout the auction may also go to companies operating in Lithuania, the share of such revenue is not significant compared to that received by Lithuanian companies directly through a banner or mobile advertising orders. It should be emphasized that the share of the online advertising market held by global corporations in Lithuania is growing every year.
When discussing the Lithuanian Internet market, it should be noted that in addition to global corporations, two groups of participants can be distinguished, which differ in terms of the nature of content and revenue generated. One group of participants consists of companies operating news websites, which generate revenue mainly from banner advertising, and the other segment of the internet market consists of companies that derive most of their revenue from classified ads. This study analyzes the news website market.
The market of internet news websites records a high concentration of audience in 2008–2019. With the development of the internet market by 2012, a decrease in audience concentration to 2658 HHI was visible. In 2008–2012, the audience share of the market leader Delfi.lt decreased and the audience shares of Lrytas.lt and 15min.lt increased. From 2013 to 2019, the majority of the internet news audience was concentrated among three market players: in 2019, Delfi.lt accounted for 41.7%, 15min.lt for 22.1%, and Lrytas.lt for 20.1%. audience share (84% of the total audience share). For comparison, in 2018, the total audience share of these three players was as high as 93%. In 2019, Tv.3.lt (8%), Lrt.lt (4.5%) and Lnk.lt (2.8%) increased their audience share. As a result, the 2019 concentration index decreased, but the concentration remained high (HHI – 2723) (Figure 3, Gemius Audience, 2020).
The revenue market of news websites was highly concentrated in 2008–2019, especially at the beginning of the period, when this market was dominated by the Delfi group (63.1% market share), and the HHI was 4447. Later, with the strengthening of 15min positions in the market, Delfi’s market share decreased. When 15 min earned more than a fifth of market revenue (23.3%) in 2015, Delfi’s share fell to 41.8% and the HHI was the lowest in the whole studied period (2782). As Delfi and 15min increased their shares in the income market in 2016–2019, the concentration index increased. Changes in the share of revenue of other market players had no significant effect on the HHI. It can be stated that there were three main players in the revenue market of news portals: Delfi, 15min, and Lrytas, whose revenue in 2019 accounted for 90% of the total market (Center of Registers, 2020).
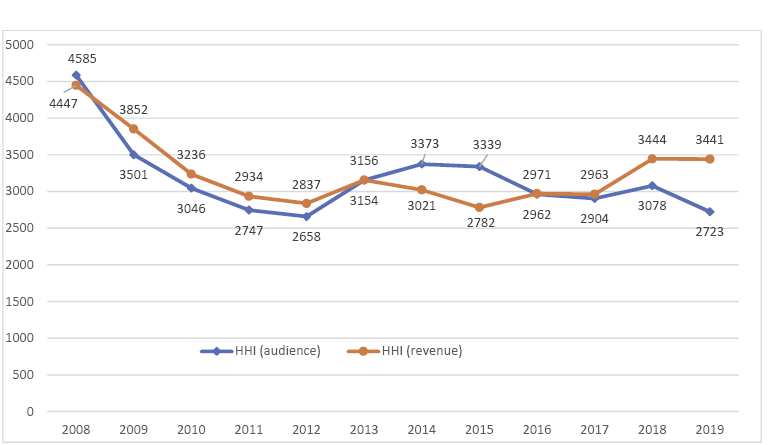
Figure 3. Concentration (HHI) of the news website market (2008–2019).
Sources: authors, based on Gemius Audience (2020), Centre of Registers (2020).
In contrast to the television and radio markets, where the concentration of revenue was significantly higher than the concentration of the audience, the levels of concentration of the audience and revenue markets of online news portals were similar (Figure 3). That is, the structure of audience shares almost evenly matched the structure of revenue shares in the market. Only in 2019 the concentration of revenue slightly differed from the level of audience concentration and this coincided with the increase of the audience share of the Lrt.lt and Tv.3.lt websites.
Concentration of the newspaper market. In 2014, 2016, and 2017, the HHI of the national newspaper circulation exceeded 1500, and the market had reached the level of moderate concentration. In the remaining years of the analyzed period, the market can be considered unconcentrated (Figure 4). In 2019, there were 12 participants in the national newspaper market with a circulation of more than 2%. The market share of the newspaper circulation of four participants was more than 10%: Respublikos leidiniai group (20.1%), Ūkininko patarėjas (20%), Lietuvos Rytas (14.5%), and Kaimo žinios (10.7%) (LNB, 2009–2020).
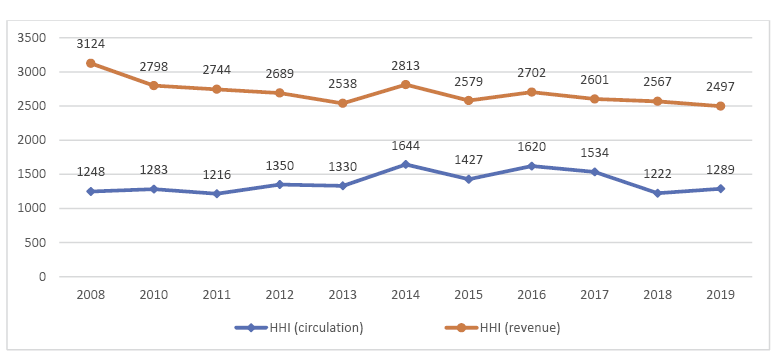
Figure 4. Concentration (HHI) of the national newspaper market (2008–2019).
Sources: authors, based on LNB (2009–2020), Centre of Registers (2020).
The concentration of national newspaper revenue was high in 2008–2019 (except 2018), and the HHI was relatively stable: from 2497 to 3124 (Figure 4). Over the 12 years, the market leader Lietuvos rytas has maintained the most stable positions in terms of market share (38.3–45.5%). The market share of the second market player (Respublikos leidiniai group) decreased almost constantly until it was finally overtaken by Verslo žinios in 2018–2019. These three companies have concentrated almost 80% of the revenue markets in 2019. The three publishers (Kaimo žinios, Ūkininko patarėjas, and Lietuvos sveikata), focused on more thematically defined audiences, together accounted for 16.7% market share (Center of Registers, 2020).
The concentration levels of newspaper audience (circulation) and revenue market differed significantly between 2008 and 2019, especially at the beginning of the period. This is due to the different structure of the income market, where the market advantage is gained by publishers of more frequent newspapers with more opportunities to earn income.
Discussion and conclusions
The study of the level of horizontal concentration of Lithuanian media markets showed that without any special measures to regulate media concentration in Lithuania, all four revenue markets (television, radio, internet news websites, and newspapers) have become highly concentrated. In terms of audience (circulation) concentration, the concentration of newspaper and television markets was divided between unconcentrated and moderately concentrated areas, the radio audience was moderately concentrated, and the audience of internet news websites was highly concentrated. Noam’s (2016) claim that new media tends to be more concentrated than traditional ones was partially confirmed for Lithuanian media markets – in the case of audiences. However, television and radio revenue markets became more concentrated than the internet revenue market.
Assessed in the broader context of the Baltic and Nordic countries, there is a tendency to deregulate media concentration and a tendency towards medium and high (and in the case of the Scandinavian television and radio markets – very high) audience concentration. A similar correlation has been found in the countries of the European Union and the United Kingdom between the regulation of media concentration and the concentration of television markets, i.e. the more media concentration regulations there are in the country, the lower the concentration of television audiences (Ranaivoson et al., 2021). The Scandinavian countries, whose television and radio audiences are highly concentrated, are characterized by the dominance of public service broadcasters in the television and radio markets, as well as by serious competition in the market of online news portals. This gives these markets a qualitatively different structure than when commercial players dominate. Solid funding of public service broadcasters in the Scandinavian countries helps to achieve a diversity of media content in concentrated markets through a variety of public channels and programs. That is what the ultimate goal of regulating media concentration should be. Lithuania compared to Latvia (which regulated the number of television and radio licenses for commercial broadcasters, public radio led the market), Estonia (which regulated the number of television licenses, consistently developed public radio and television), and the Scandinavian countries (which did not regulate concentrations, created exceptionally favorable conditions for the development of public service media), neither tried to regulate media concentration nor applied financial conditions favorable to the development of public service broadcaster (until 2015), what resulted in a different structure of electronic media markets than in the mentioned countries.
When discussing the situation in the television market, it should be noted that the audiovisual market is developing rapidly on the internet, where linear television is also active. As competition in the audiovisual sector increases due to the supply of content on global platforms (Netflix, etc.), and local audiovisual content producers operating on the Youtube platform also compete with national televisions for the audience, it can be said that the diversity of information for Lithuanian audiences tends to increase, however, this is more typical in terms of entertainment and commentary genres than in terms of news genres. On the other hand, with the financial strengthening of the LRT group, following the example of the Scandinavian and Estonian television markets, it is possible to gather a larger audience of the public broadcaster. This can guarantee a more diverse and high-quality news content, and sometimes higher-quality entertainment content, even with a higher concentration of the audience.
The concentration situation in the radio market shows that, without any specific concentration regulation measures, the majority of the audience was concentrated in two commercial radio groups, one of which dominates the revenue market. On the other hand, there are more significant players in the national radio market than in the national television market, and Žinių radijas competes quite clearly with the public service broadcaster in the information genre market. As the LRT funding from the budget has improved in recent years, the public service broadcaster has the potential to give some impetus to the market and try to change the audience structure to its advantage and reduce audience concentration. The experience of public radio in Scandinavia, as well as in the neighboring Baltic States, could be used for this purpose, gathering niche audiences and establishing more radio channels (programs).
The market for national newspapers is declining. Looking ahead and assessing the impact of the COVID-19 pandemic, the newspaper market may show a further downward trend in circulation, periodicity, and revenue, which may not necessarily have a significant effect on changes in market concentration. Rather, it may be related to the withdrawal of significant players from the market.
For almost a decade, global corporations have become important players in the national internet market, changing both the audience and revenue structure, and the share of these corporations in the Lithuanian advertising market tends to increase. From 2019 the LRT became a significant player in the Internet market, and the development of its website began to change the structure of the audience. Although the LRT did not compete with commercial portals in the internet advertising market, the increase in Lrt.lt’s audience could have to affect the development of paid content sales of the two largest news websites. As the news website market in 2019 was still the most concentrated, further development of the LRT website could reduce the concentration of the market. Overall, the LRT group’s potential in the TV, radio, and news website markets is a fairly realistic factor that can help balance the structures of these three markets by reducing audience concentration as well as indirectly having some (though not necessarily significant) influence on revenue markets.
In the current Lithuanian Competition Law, a dominant position is defined by indicating the market share, that is, the percentage of the number of goods purchased or sold by an undertaking. As it is important to determine not only revenue but also audience concentration when assessing the concentration situation in media markets, it would be worthwhile to define the dominant position in the media market by introducing the criterion of audience share. The results of the study show a tendency that the concentration of the audience in the media markets is usually lower than the concentration of the revenue market, therefore, when defining the dominant position, it is recommended to set a lower value of the audience share than in the case of the revenue market.
Funding
The article was prepared during the project (No. P-REP-20-10) “Media concentration and its regulation in Lithuania” (2020–2021) funded by the Lithuanian Science Council and the Ministry of Culture of the Republic of Lithuania.
References
Balčytienė, A., & Juraitė, K. (2016). Media Pluralism Monitor 2016 Monitoring Risks for Media Pluralism in the EU and Beyond. Country report: Lithuania. https://cadmus.eui.eu/bitstream/handle/1814/46803/Lithuania_EN.pdf?sequence=1&isAllowed=y
Balčytienė, A., & Juraitė, K. (2018). Monitoring Media Pluralism in Europe: Application of the Media Pluralism Monitor 2017 in the European Union, FYROM, Serbia & Turkey. Country Report: Lithuania. https://cadmus.eui.eu/bitstream/handle/1814/61147/2018_Lithuania_EN.pdf?sequence=1&isAllowed=y
Balčytienė, A., & Juraitė, K. (2020). Monitoring Media Pluralism in the Digital Era: Application of the Media Pluralism Monitor in the European Union, Albania and Turkey in the years 2018-2019. Country report: Lithuania. https://cadmus.eui.eu/bitstream/handle/1814/67809/lithuania_results_mpm_2020_cmpf.pdf?sequence=1&isAllowed=y
Balčytienė, A., Juraitė, K., & Nugaraitė, A. (2015). Lithuania. https://cmpf.eui.eu/mpm-2015/lithuania/
Centre of Registers (2020). Finansinių ataskaitų elektroninių rinkinių pildymas ir teikimas [Completion and submission of electronic sets of financial statements]. Retrieved from https://www.registrucentras.lt/FA/
Delfi.lt (2020, April 7). Pernai reklamos rinka augo 3 proc., epidemija koreguoja šiųmetes prognozes [Last year, the advertising market grew by 3%, the epidemic adjusts this year‘s forecasts]. Retrieved from https://www.delfi.lt/m360/naujausi-straipsniai/pernai-reklamos-rinka-augo-3-proc-epidemija-koreguoja-siumetes-prognozes.d?id=83987313
Dreyer, S. (2021). Germany. In Deloitte and SMIT (part of Vrije Universiteit Brussel and imec), SMART 2018/0066 – Part D: Study on the implementation of the new provisions in the revised audiovisual media services directive (AVMSD) (pp. 433–434). European Commission.
Electronic Mass Media Law (2019). Legal acts of the Republic of Latvia. Retrieved from https://likumi.lv/ta/en/en/id/214039
European Commission (2004). Guidelines on the assessment of horizontal mergers under the Council Regulation on the control of concentrations between undertakings. Journal of the European Union, C 31, 47, 5–18.
Gemius Audience (2020). Research results. Retrieved from https://audience.gemius.com/en/research-results/
Gemius Baltic (2019, February 5). Lietuvos interneto svetainės bus reitinguojamos pagal jose praleisto laiko dalies rodiklį [Lithuanian websites will be ranked according to the proportion of time spent on them]. Retrieved from https://www.gemius.lt/interneto-ziniasklaidos-naujienos/lietuvos-interneto-svetaines-bus-reitinguojamos-pagal-jose-praleisto-laiko-dalies-rodikli.html
Gintautaitė, A. (2012, December 17). LNK įsigijo „Baltijos TV“ [LNK acquires Baltijos TV]. Vz.lt. Retrieved from https://www.vz.lt/archive/article/2012/12/17/lnk-isigijo-baltijos-tv
Iordache, C. (2021). Romania. In Deloitte and SMIT (part of Vrije Universiteit Brussel and imec), SMART 2018/0066 – Part D: Study on the implementation of the new provisions in the revised audiovisual media services directive (AVMSD) (pp. 455–456). European Commission.
Iosifidis, P. (2010). Pluralism and concentration of media ownership: Measurement issues. Javnost, 17(3), 5–21. https://doi.org/10.1080/13183222.2010.11009033
Jastramskis, D., Rožukalne, A., & Jõesaar, A. (2017). Media Concentration in the Baltic States (2000–2014). Informacijos mokslai, 77, 26–48. https://doi.org/10.15388/Im.2017.77.10705
Jõesaar, A. (2015). The Undercurrents of Estonian Broadcasting Regulation, 1992–2014. Baltic Screen Media Review, 3(1), 84–99. https://doi.org/10.1515/bsmr-2015-0025
Just, N. (2009). Measuring media concentration and diversity: new approaches and instruments in Europe and the US. Media, Culture & Society, 31(1), 97–117. https://doi.org/10.1177/0163443708098248
Lietuvos Respublikos konkurencijos įstatymas [Republic of Lithuania Law on Competition]. Current consolidated version as of 01/11/2020. Teisės aktų registras. Retrieved from https://www.e-tar.lt/portal/lt/legalAct/TAR.B8B6AFC2BFF1/asr
KANTAR (2009–2020). Metinės media tyrimų apžvalgos, 2008–2019 [Annual media research surveys, 2008–2019]. Retrieved from http://www.kantar.lt/lt/top/paslaugos/media-auditoriju-tyrimai/metine-media-tyrimu-apzvalga
Lietuvos Respublikos visuomenės informavimo įstatymas [Republic of Lithuania Law on the Provision of Information to the Public]. Current consolidated version as of 01/02/2021. Retrieved from https://www.e-tar.lt/portal/lt/legalAct/TAR.065AB8483E1E/asr
Llorens, C. (2021). Spain. In Deloitte and SMIT (part of Vrije Universiteit Brussel and imec), SMART 2018/0066 – Part D: Study on the implementation of the new provisions in the revised audiovisual media services directive (AVMSD) (pp. 461–462). European Commission.
LNB (2009–2020). Lietuvos leidybos statistika. Retrieved from https://www.lnb.lt/leidejams/lietuvos-leidybos-statistika
Nevinskaitė, L. (2004). Žiniasklaidos koncentracija Lietuvoje ir kitose Baltijos šalyse [Media Concentration in Lithuania and Other Baltic Countries]. Informacijos mokslai, 29, 70–86.
Noam, E. (2004, August 30). How to Measure Media Concentration. FT.com. Retrieved from http://www.ft.com/cms/s/da3Obf5e-fa9d-1 ld8-9a71-00000e251 lc8.html
Noam, E. (2016). Who Owns the World’s Media? Media Concentration and Ownership around the World. Oxford, New York: Oxford University Press. https://doi.org/10.1093/acprof:oso/9780199987238.001.0001
Østbye, H. (2017). Regulatory authorities. Media Lanscapes. Norway. Retrieved from https://medialandscapes.org/country/norway/policies/regulatory-authorities
Picard, R., & Pickard, V. (2017). Essential Principles for Contemporary Media and Communications Policymaking. Oxford University, Reuters Institute for the Study of Journalism.
Polák, J. (2021). Slovakia. In Deloitte and SMIT (part of Vrije Universiteit Brussel and imec), SMART 2018/0066 – Part D: Study on the implementation of the new provisions in the revised audiovisual media services directive (AVMSD) (pp. 457–458). European Commission.
Psychogiopoulou, E. (2021). Greece. In Deloitte and SMIT (part of Vrije Universiteit Brussel and imec), SMART 2018/0066 – Part D: Study on the implementation of the new provisions in the revised audiovisual media services directive (AVMSD) (pp. 435–436). European Commission.
Ranaivoson, H., Afilipoaie, A., Magyar, M., Raats, T., & Donders, K. (2021). Media ownership and transparency in the EU. In Deloitte and SMIT (part of Vrije Universiteit Brussel and imec), SMART 2018/0066 – Part D: Study on the implementation of the new provisions in the revised audiovisual media services directive (AVMSD) (pp. 127–233). https://ec.europa.eu/digital-single-market/en/news/study-implementation-new-provisions-revised-audiovisual-media-services-directive-avmsd
Tintel, S. (2021). Belgium. In Deloitte and SMIT (part of Vrije Universiteit Brussel and imec), SMART 2018/0066 – Part D: Study on the implementation of the new provisions in the revised audiovisual media services directive (AVMSD) (pp. 416–417). European Commission.
Themistokleous, A. (2021). Cyprus. Austria. In Deloitte and SMIT (part of Vrije Universiteit Brussel and imec), SMART 2018/0066 – Part D: Study on the implementation of the new provisions in the revised audiovisual media services directive (AVMSD) (pp. 422–423). European Commission.
U.S. Department of Justice and the Federal Trade Commision (2010). Horizontal Merger Guidelines. Retrieved from https://www.justice.gov/sites/default/files/atr/legacy/2010/08/19/hmg-2010.pdf
Van Cuilenburg, J. (2007). Media Diversity, Competition and Concentration: Concepts and Theories. In E. de Bens, C. J. Hamelink, K. Nordenstreng, & K. Jakubowicz (Eds.), Media Between Culture and Commerce (pp. 25–54). UK/Chicago, USA: Intellect Books.
Wagner-Hatfield (2016). Media ownership and concentration in Europe: a comparative analysis with reflections on the situation in Slovenia. Retrieved from https://www.akos-rs.si/fileadmin/user_upload/WH-20150126-ownership-concentration-report-final.pdf