Socialinė teorija, empirija, politika ir praktika eISSN 2345-0266
2019, vol. 19, pp. 8–25 DOI: https://doi.org/10.15388/STEPP.2019.8
Social and Academic Segregation in the Education Systems of the New EU Member States
Dovilė Stumbrienė
Institute of Mathematics and Informatics, Vilnius University, Vilnius, Lithuania
dovile.stumbriene@mii.vu.lt
Audronė Jakaitienė
Institute of Mathematics and Informatics, Vilnius University, Vilnius, Lithuania
audrone.jakaitiene@mii.vu.lt
Rimantas Želvys
Faculty of Philosophy, Vilnius University, Vilnius, Lithuania
rimantas.zelvys@fsf.vu.lt
Abstract. This article presents a comparative analysis of the educational systems of EU countries, exploring them from a socioeconomic perspective with a special focus on new EU member states. The research question was whether post-socialist countries, in terms of social and academic segregation, are moving toward a separate educational “regime,” or whether they are currently approaching either the Scandinavian, Continental, Anglo-Saxon, or Mediterranean model. Segregation was analyzed according to performance scores in science and economics, social and cultural status, and hierarchical regression was employed in analyzing PISA 2015 data. Results indicate that post-socialist EU member states, in terms of academic and social segregation, do not form a separate “educational regime.”
Keywords: PISA, educational models, academic segregation, social segregation, hierarchical regression.
Socialinė ir akademinė segregacija naujųjų ES narių švietimo sistemose
Santrauka. Straipsnyje atlikta lyginamoji ES šalių švietimo sistemų analizė iš socioekonominės perspektyvos, daugiausia dėmesio skiriant naujosioms ES narėms. Analizuojama mokslinė problema: ar posocialistinės šalys socialinės ir akademinės segregacijos prasme juda link skirtingų švietimo „režimų“, ar artėja prie skandinaviškojo, kontinentinio arba anglosaksiškojo modelių? Analizei panaudota hierarchinė regresinė PISA 2015 duomenų analizė. Rezultatai parodė, kad posocialistinės ES narės akademinės ir socialinės segregacijos prasme nesudaro atskiro švietimo „režimo“. Vienintelis rodiklis, kur posocialistinės šalys atrodo daugmaž panašiai, yra SEKS indeksas. Galima išskirti dvi posocialistinių šalių grupes. Vienoje (Vengrija, Bulgarija, Čekija, Rumunija, Slovakija ir Slovėnija) vyrauja skirtumai tarp mokyklų, kitoje (Lenkija, Latvija ir Estija) – mokyklų viduje. Analizuojant moksleivių ir bendraamžių socioekonominio statuso įtaką akademiniams pasiekimams, skirtumai nėra tokie ryškūs. Slovėnijoje, Čekijoje, Kroatijoje, Bulgarijoje ir Vengrijoje bendraamžių įtaka yra didesnė už vidutinę, o Lenkijoje, Latvijoje, Lietuvoje, Estijoje ir Rumunijoje – mažesnė už vidutinę. Tyrimo rezultatai patvirtina kitų autorių prielaidą, kad, jeigu konvergencija tarp šalių iš tiesų vyksta, pereinamasis laikotarpis yra ilgesnis, negu buvo manyta.
Pagrindiniai žodžiai: PISA, švietimo modeliai, akademinė segregacija, socialinė segregacija, hierarchinė regresija
Received: 15/1/2019. Accepted: 15/07/2019
Copyright © 2019 Dovilė Stumbrienė, Audronė Jakaitienė, Rimantas Želvys. Published by Vilnius University Press. This is an Open Access article distributed under the terms of the Creative Commons Attribution Licence, which permits unrestricted use, distribution, and reproduction in any medium, provided the original author and source are credited.
Introduction
One of the most commonly declared aims of contemporary educational reforms is seeking for social justice and reducing the level of inequality. Reviews on education, in particular Education at a Glance (2016), demonstrate that there are relatively large disparities in the provision and outcomes of education even among the advanced industrial societies. The level of inequality is usually defined as the strength of the impact of an individual’s social background on educational attainment. One can find this or similar definitions both in empirical literature and in international comparative reports on education. However, inequalities should not be considered as a mere effect of the students’ social and economic backgrounds on their achievements, since school characteristics can also provide the source of inequality. In other words, inequalities can be channelled both through the students’ backgrounds and through stratification-determined school characteristics. Moreover, the strength of stratification is not the same across countries; therefore, its impact on achievements may vary according to the institutional context of each educational system, e. g., comprehensiveness versus early selection (Mostafa 2010). Therefore, the manifestation of inequality in student attainment may be studied both by assessing the effects of their socioeconomic status and the effects of sorting students between schools. In countries with selective educational systems, the main criteria for selection is usually the level of the students’ academic abilities. The relationship between academic segregation and social segregation is intertwined. Academic and social segregations reflect the importance of grouping practices into different schools according to social or academic criteria.
Oppedisano and Turati (2015) analyzed the determinants and the evolution of educational inequality in Germany, Spain (“decentralized” schooling systems) and France, Italy (“centralized” systems) based on educational scores by comparing PISA 2000 and PISA 2006 data. The paper showed that inequality has been mostly reducing in “decentralized” schooling systems over time, while “centralized” schooling systems saw an increase in inequality. A decomposition of observed inequality into its causes highlighted that, besides parental backgrounds, the schools’ characteristics are also important determinants of inequality in achievements among students. Most researchers have agreed that schools can make a difference in student achievement (Rumberger and Palardy 2003); but how much of the student achievement can be attributable to the efforts of schools? Herein lies the issue of our research. Regarding this question, we analyzed how the variation in school outcomes is distributed between-school and within-school differences. The first aspect of our analysis is the identification academic and social segregation for European countries. Previous empirical research on education has confirmed the importance of student-level and peers’ socio-economic status for educational success. Results of the previous research determined that in the second part of this paper, we decided to analyze the influence of peers’ socio-economic status on the achievements of students.
The first part of our analysis is dedicated to inequalities in educational achievement (academic segregation) and inequalities in socio-economic status (social segregation) for European countries. Academic segregation can be measured as a between-schools variance of student achievement, and social segregation can be measured as a between-schools variance of students’ socio-economic status.
Anderson et al. (2009) analyzed PISA 2003 data and showed that on average, 35% of the variance in mathematics achievement (starting with 4% for schools in Iceland to over 60% for schools in the Netherlands) can be attributed to schools. Raitano and Vona (2013) used PISA 2006 data (science performance) and analyzed the differences between early-tracking (Austria, Germany, the Czech Republic, Hungary, the Slovak Republic, Belgium, the Netherlands, Switzerland) and comprehensive systems. It showed that the incidence of tracking on school heterogeneity is very large: between-schools variation in science scores explains more than half (51.3%) of the overall variation in the early-tracking countries, compared to roughly a quarter (24.7%) in late-tracking ones.
Between-school and within-school educational differentiation is associated with socio-economic background. It is a very important question on how strongly educational differentiation is affected by socio-economic status. The theoretical studies of Bernstein (1971) present an analysis of the connections between families and schools in order to show how social class advantages resulted in differences in communication codes and how this can influence inequalities in education. Bourdieu (1977) analyzed social and cultural capital and its relation to educational inequalities. The empirical studies of Sirin (2005) showed that students from lower SES backgrounds were more likely to perform poorly in education and subsequently drop out of school. Borman and Dowling (2010) applied a multilevel analysis of Coleman’s Report data and revealed that family background characteristics accounted for 68.33% of the total variance in students’ achievement. Mostafa (2010) used PISA 2003 data and analyzed the mechanisms of stratification in five countries (Japan, Finland, Germany, Italy, UK) and highlighted that socio-economic status is the most important student-level variable according to which stratification operates. It has a positive effect on performance scores in all countries except Japan; moreover, the socio-economic status of peers also has a positive and statistically significant effect for all countries except Finland, which produced a statistically insignificant result. Theoretical and empirical findings show that students from families with a high level of SES tend to perform better in education than students from families with a low level of SES.
The second goal of our analysis was to analyze the influence of peers’ socio-economic status on the achievements of students. Coleman (1966) was studying this influence on the academic achievements of students in the United States and concluded that forces outside schools, especially peer-group effects, were more important than measures of the schools or teaching quality and other within-school variables. He highlighted the importance of social capital that individual families provide to their children. Caldas and Bankston (1997) examined the relationship between the socioeconomic status of peers and individual academic achievement and concluded that “peer social status in particular does have a significant and substantive independent effect on individual academic achievement, only slightly less than an individual’s own family social status.” Rumberger and Willms (1992) analyzed the effects of student-level and school-level variables and found that the mean parental education level of peers had an independent positive effect on student achievement.
Zimmer and Toma (2000) reported positive influences of higher-achieving peers, at least for some students. Raitano and Vona (2013) analyzed the impact of peer heterogeneity on students’ performances in science (PISA 2006 data) in different tracking regimes (early-tracking and comprehensive systems) and concluded that peer heterogeneity influenced achievements differently depending on school-tracking policies. “The effect of peer heterogeneity goes in opposite directions in the two systems. In both student- and school-level estimates, peer heterogeneity reduces students’ achievements in the comprehensive system while it has a positive impact in the early-tracking one.” Vardardottir (2015) employed the Swiss subsample of the PISA 2003 data and analyzed the influence of peers’ socio-economic status to academic outcomes of students in a streaming system and concluded that, for the average student, the average socio-economic background of their peers has a positive effect on mathematics and problem-solving scores. However, it is not easy to discern whether social segregation is an antecedent or a consequence of academic segregation.
One of the ways of differentiating national educational systems in relation to student selection is applying historical-geographical or structural criteria. For example, Cerych (1997) and Kogan, Noelke, and Gebel (2011) indicate that the specificity of the education systems of the former socialist countries is determined by their historical and geographical closeness to Austro-Hungarian, Orthodox Christian, or Scandinavian traditions. Van der Werfhorst and Mijs (2010) consider the level of differentiation or standardization as an important criterion of system classification. Muller and Shavit (1998) identify four dimensions of variation in national institutions: standardization, stratification, the scale of tertiary education, and the occupational specificity of vocational education. In our study, we chose to apply the typology of Esping-Andersen (1990) welfare state regimes. West and Nikolai (2013) note that, although subject to wide-ranging debate and critique, Esping-Andersen’s typology has been used heuristically, specifically in relation to education. According to Hega and Hokenmaier (2002), their findings offer evidence that particular kinds of welfare states have distinctive educational policy profiles. Just as different welfare regimes may be distinguished by the similarity of their social insurance programs, so can they be differentiated by the educational policies they support. Lavrijsen et al. (2014) come to a similar conclusion: “[t]he three worlds usually identified in the welfare state analysis (liberal, conservative, social-democratic), correspond neatly to types of educational systems. Different welfare state types are associated with different ideological preferences... This encourages researchers to analyse educational systems as more or less coherent ‘regimes,’ closely intertwined with labour market and welfare provision spheres” (Lavrijsen et al. 2014, 35–36).
In applying the welfare state typology to analyze the systems of education in the European continent, researchers often use the three models from Esping-Andersen typology. Other authors, e.g., Arts and Gellisen (2002), Fenger (2007), Aiginger and Leoni (2009), supplement the typology with the Southern European model. The modified typology includes the Nordic or Scandinavian (Denmark, Finland, Norway, Sweden, and Iceland), Continental (Austria, Belgium, Germany, Luxembourg, Switzerland, and the Netherlands); Mediterranean or Southern European (France, Greece, Spain, Portugal, and Italy), and the English-speaking or Anglo-Saxon (UK and Ireland) models. It must be said that this theoretical model of welfare states is applied quite often by educational researchers in their publications. For example, Allmendinger and Leibfried (2003) explored “educational poverty” via the level and differentiation of competences (using PISA data); they proposed “four worlds of competence production,” which bear resemblances to Castles’ “families of nations,” with nations being defined in terms of historical, geographical, linguistic, and cultural commonalities – namely English-speaking, Scandinavian, Continental, and Southern European (Castles 2004). The Nordic model is a non-selective model without tracking until the age of sixteen. Vocational education is fully integrated into the general education system, and the percentage of early school leavers is low. The Continental school system is highly tracked and stratified. Selection takes place at the age from ten to twelve. Beyond the age of fifteen, enrollment in vocational education programs is high, and the proportion of early school leavers is below average. There is little permeability between tracks in this differentiated skill regime. In this way, Continental countries tend to reproduce social stratification via the education system: the school system is stratified with early academic selection. In the Anglo-Saxon model, academic selection normally takes place at fifteen to sixteen years of age. Participation in vocational education is low, and the proportion of early school leavers is high. The school system is broadly comprehensive until the age of sixteen. There is a clear academic track beyond sixteen, and for those who wish to pursue vocational education or training, the route is less clear-cut. This system seems to be less egalitarian than the Nordic one (West and Nikolai 2013).
The EU’s enlargement and the accession of the post-socialist member states in 2004–2009 was a significant political event in the history of Europe. Central and Eastern European countries joined the path of social and economic integration with their more advanced Western counterparts. The process of convergence became one of the goals of the new member states. Does this also apply to education? During the socialist period, the former Soviet Union and its satellite states in Central and Eastern Europe had similar or, in some cases, almost identical systems of education. Totalitarian regimes are primarily characterized by an effort to create totality and uniformity (Szebenyi 1992). During the socialist period, most of the Central and Eastern European countries followed the Soviet model of a single and uniform school covering the whole period of compulsory education (Cerych 1997). One of the basic features of the Soviet system is that it was totally centralized, state-maintained, and state-controlled. All educational institutions had the same curricula, the same textbooks, and the same youth organizations at school (Pogosian 2012). After the fall of the socialist system, practically the same “reform package” was offered to all these countries. Accordingly, one could expect the development of educational systems along the similar lines. Is an educational convergence taking place, and are the post-Communist states developing their welfare regimes, and, accordingly, their systems of education along the same patterns? Soon after the fall of the socialist systems, Deacon (1993) noted the differences between the Western welfare regimes and the newly emerging democracies and suggested an intermediate type for Esping-Andersen’s typology, a “post-communist conservative corporatist” welfare regime. However, Esping-Andersen rejected the idea of a “new” welfare regime model in Central and Eastern Europe, suggesting that the differences between these countries and his proposed three welfare types were only of a transitional nature (Esping-Andersen 1996). Fenger concluded that if convergence is occurring, the transitional stage takes much longer than some authors have anticipated (Fenger 2007). However, researchers note that the process of convergence can still be observed. In particular, Beblavy, Thum, and Veselkova claim that “post-communist countries do not make up one type, but adhere to either Germanic or Nordic country models, largely in alignment with their history and/or geography (the Czech Republic, Hungary and Slovenia being closer to Germany, Poland and Estonia closer to the Nordic countries, but not invariably so” (Beblavy, Thum, Veselkova 2011, 28). Želvys, Jakaitienė, and Stumbrienė (2017) analyzed educational systems in the Baltic States according to different types of welfare regimes. They used PISA 2012 survey data and compared the Baltic countries with three “old” EU member states (UK – the Anglo-Saxon liberal model, Germany – the Continental corporatist model, and Finland – the Scandinavian model). The findings of the paper showed that the three Baltic states do not represent a single Central and Eastern European model – Latvia and Lithuania are moving closer to a liberal Anglo-Saxon model, while Estonia, in certain aspects, shows more similarity with Finland.
In this paper, we extend the comparative analysis of educational systems to all EU countries, exploring them from the social and academic segregation perspective with a special focus on post-socialist EU member states. The objective of this study is to assess whether post-socialist countries, in terms of social and academic segregation, are moving toward a separate educational “regime,” or whether they are approaching a Scandinavian, Continental, Anglo-Saxon, or Mediterranean model. First of all, we (1) identify the effects of social and academic segregation in new EU countries, and then we (2) estimate the association between students’ and peers’ socio-economic statuses and academic achievements. For this, we employed a hierarchical regression analysis model using PISA 2015 data.
Data and Methodology
We conducted the research using PISA 2015 data from the OECD database. We are fully aware of controversies concerning the PISA research methodology. However, at the present moment, PISA data are one of the few sources that enable us to make a quantitative comparison of post-socialist education systems. All European Union countries, except Cyprus and Malta (Cyprus did not participate in PISA 2015, while Malta participated for the first time), were included. In the analysis, new EU member states or post-socialist countries are Estonia, Latvia, Lithuania, Poland, the Czech Republic, the Slovak Republic, Slovenia, Bulgaria, Croatia, Hungary, and Romania.
Stratification was studied according to performance scores in science and economics, social and cultural status (ESCS). The academic segregation was measured by the percentage of variance that lies between schools for student performance in science, and social segregation was measured by the percentage of variance that lies between schools for student ESCS.
Further in the analysis, we employed HLM to account for multilevel (student-level and school-level) effects. For the HLM analysis, we followed Raudenbush and Bryk (1986) and the OECD methodology (PISA, 2009).
The regression equation of performance scores on student level characteristic X for j schools can be written:
 (1)
(1)
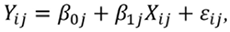
where Yij is the dependent variable for student i enrolled in school j, Yij is the independent variable for student i enrolled in school j, ß0j is the intercept for school j (the expected value of Y for student enrolled in school j then X=0), ß1i is the slope on X for school j (the change in Y then one unit increase in X for this school), εij ~N(0, σ2) is an error term. Each school has an independent equation with its own slope and intercept. In a random coefficient model (general multilevel model), the intercept and the slopes can be further decomposed into fixed and random parts:
ß0j = α + Vj (2)
ß1j = ß + μj
where α is the overall intercept, which is constant for all schools and equal to the average of the intercepts ß0j, ß is the overall regression coefficient, which is equal to the average of regression coefficients ß1j , Vj ~N(0, t02 ) and μj ~N(0, t12) are random errors with normal distributions. Student level equation can be rewritten as:
 (3)
(3)
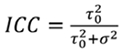
The interclass correlation coefficient (ICC) shows the percentage of the total variance that is accounted for by the school and can be written as:
 (4)
(4)
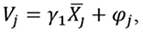
School characteristics can be extracted from:
 (5)
(5)
where  is peer effects in school j (school average of an student level variable, it is constant for all students attending the same school), γ1 is the regression coefficient on
  and
and 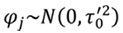 is a random error with normal distribution. A combine level equation can be rewritten as:
 (6)
(6)
Student performance in science was selected as a dependent variable Yij in this study. All 10 plausible values were used in the analysis to obtain average regression estimates and adjust standard errors. The empty model (Model_1) according equation (3) without students’ characteristics Yij was estimated to obtain the decomposition of variance of student performance in science Yij into the different levels (within-school variance σ2 and between-school variance t02). The interclass correlation coefficient (ICC) according equation (4) was calculated. The model according to equation (3) with the student-level independent variable ESCS was estimated to account for students’ effects. We call the latter models Model_2 in this paper. The model according equation (6) with the combined level (an at school level was added to the average of ESCS) was evaluated to estimate peers’ impact. The impact of school socio-economic intake is denoted as the peer effect or school composition effect (PISA, 2009). We call the latter models Model_3 in the paper.
Results
In our survey, we investigated the effects of social and academic segregation and the peers’ effect in PISA 2015 data for new EU member states and aimed to determine the educational trajectories of these countries when compared with the “old” member states. First, we estimated the scope of academic and social segregation. We later quantified the effect of ESCS on science performance at student and school levels.
Effects of Social and Academic Segregation in New EU Countries
When analyzing educational performance in science in different countries (Figure 1), we ranked the countries from the best performing (Estonia, Finland) to the worst (Romania, Bulgaria). The average of post-socialist countries is equal to 482 points, while the average of 26 EU countries is equal to 491 points and it is just below 493 points of the OECD average (OECD, 2016). Looking at the national variance, we see that disparities between countries are apparent. Estonia has the highest attainment average with small variance, which tells us that its education system functions homogenously as regards the science achievements in the country, and in Romania, educational performance in science is very low all over the country, as we can judge by the low level of variance.
In respect to ESCS, Scandinavian countries have the highest index, and Romania is on the lowest level among the 26 EU member states (Figure 2). National variances indicate that students’ environments are heterogeneous in terms of parental occupation, education, and home welfare in new member states as well as in “old” EU countries. Bulgaria is experiencing a high variance of ESCS, indicating wide social disparities within the population, while Estonia has the lowest variance.
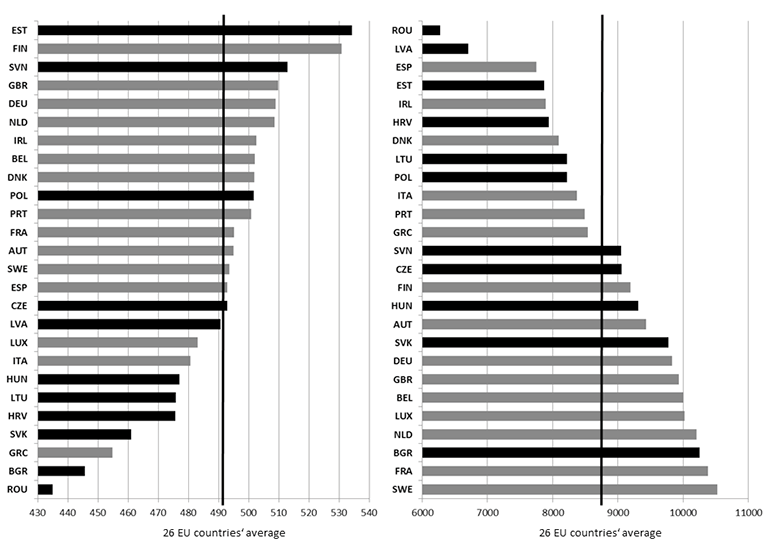
Figure 1. Average performance scores in science (left chart) and national variance (right chart) for 26 EU countries. Bars for post-socialist countries are in black.
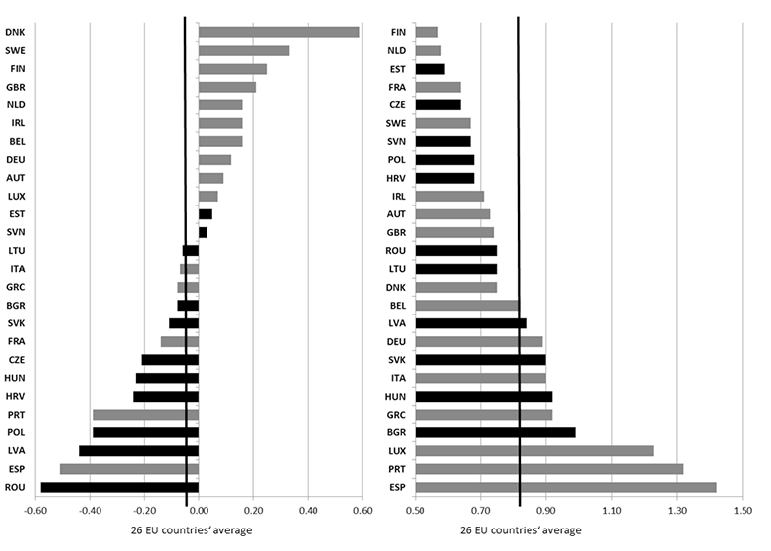
Figure 2. The ESCS index (left chart) and national variance (right chart) of the ESCS index for 26 EU countries in PISA 2015. Bars for post-socialist countries are in black.
The different effect of ESCS on students’ performance is already evident from different shapes of the bar charts in Figure 1 and Figure 2. ESCS values are lower than the 26 EU average for most of post-socialist and Mediterranean countries. Estonia has an ESCS value close to 0 and highest score in science attainment, indicating a relatively low importance of ESCS in Estonia when compared other new EU member states.
The performance scores in science show that post-socialist countries vary in a broad range of values – from the best performance score in Estonia to the worst performance score in Romania. The ESCS index from PISA 2015 shows that all post-socialist countries, except Estonia and Slovenia, are below the 26 EU average in terms of their socio-economic status. Although generally performance scores should be correlated with the socio-economic characteristics of students, the calculated correlation coefficient between science scores and the ESCS index suggest a weak (0.28 for Estonia) to medium (0.46 for Hungary) interrelationship (Figure 3). The average correlation for post-socialist countries was at 0.37 and is equal to the 26 EU average. A weak-to-medium correlation indicates that the relatively low ESCS of post-socialist countries does not necessarily determine the level of student attainment.
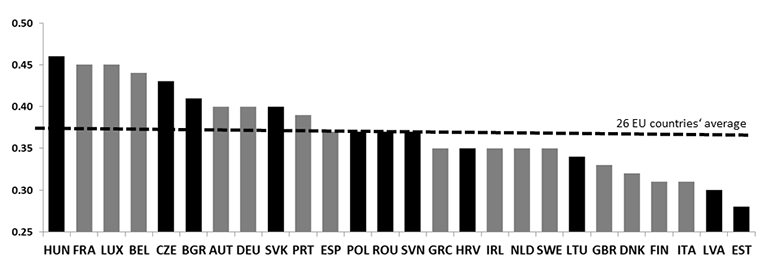
Figure 3. The correlation coefficients between performance scores in science and the ESCS index. Bars for post-socialist countries are in black.
Academic segregation was measured by the percentage of variance that lies between schools for student performance in science, and social segregation was measured by the percentage of variance that lies between schools for student ESCS. The scatterplot of the academic and social segregation values area is presented in Figure 4. As we can see, post-socialist countries (marked using diamond shapes in the chart) do not constitute a separate group when considering social and academic segregation in education. Hungary demonstrates a very high level of both social and academic segregation. In this respect, Hungary, Bulgaria, the Czech Republic, Romania, Slovakia, and Slovenia follow a similar pattern, more comparable to the Continental model (Germany, Austria, and Belgium) or to a Mediterranean model (France, Italy, and Greece). Latvia, Estonia, and Poland demonstrate a lower-than-average level of social and academic segregation and thus they more resemble the Scandinavian (Finland, Denmark, Sweden) or Anglo-Saxon (UK, Ireland) models. Lithuania and Croatia, together with Luxembourg and Portugal, are in the intermediate position in terms of academic and social segregation.
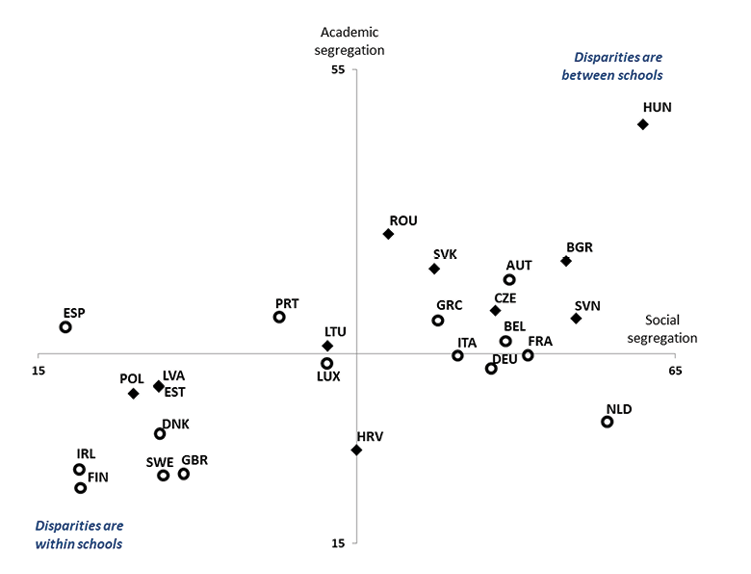
Figure 4. Social and academic segregation in EU countries. Post-socialist countries labelled with diamonds. Axes cross at average.
According social and academic segregation in EU countries, we may conclude that performance scores in science are correlated with the socio-economic characteristics of students. In post-socialist countries, the performance scores vary from the best performance score in Estonia to the worst performance score in Romania; the socio-economic statuses of students are below the country average in all countries except Estonia and Slovenia. Post-socialist countries do not demonstrate the same approach toward social and academic segregation in education. The results of the research enable us to point out two different groups of countries:
1. Bulgaria, the Czech Republic, Romania, Slovakia, and Slovenia, are close to the Continental (Germany, Austria, and Belgium) and Mediterranean (France, Italy, and Greece) models;
2. Latvia, Estonia, and Poland show results that are rather close to the Scandinavian (Finland, Denmark, Sweden) and Anglo-Saxon (UK, Ireland) models.
Other countries do not constitute a separate group.
The Association between Students’ and Peers’ Socio-Economic Status and Academic Achievements
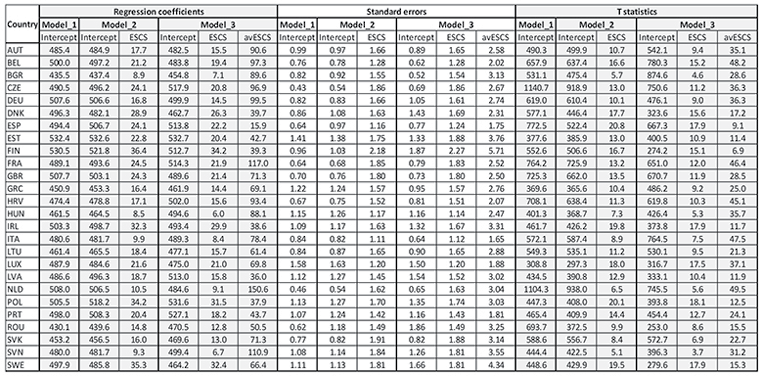
In order to quantify the effect of ESCS on science performance accounting for both student- and school-levels, we conducted an HLM analysis. The estimated regression coefficients, standard errors, and T statistics are presented in Annex 1. ESCS was a significant variable in all of the estimated models: T statistics |T|>1.97.
We started our analysis by running an empty model (Model_1) and decomposing the total variance of student performance to between- and within-school variance. The intra-class correlation (ICC) indicates which share of variance is due to between school differences. From Figure 5 one can see that there is a broad range of values across countries—from 11% for schools in Finland to 59% for the schools in Hungary. On average 38% of the variance in science achievement can be attributed to schools in new EU countries (32% in “old” member states and 35% in 26 EU countries).
After accounting for students’ effects (Model_2) and peers’ effects (Model_3) average between-school variance drops to 33% and 19% respectively for new Member states (27% and 15% for “old” member states and 30% and 17% respectively for 26 EU countries). However, between-school variance remains high after accounting for multilevel effects in ESCS for some post-socialist countries (Hungary, Romania, Slovenia, Bulgaria), indicating that there are other important factors that influence between-school variance in science performance.
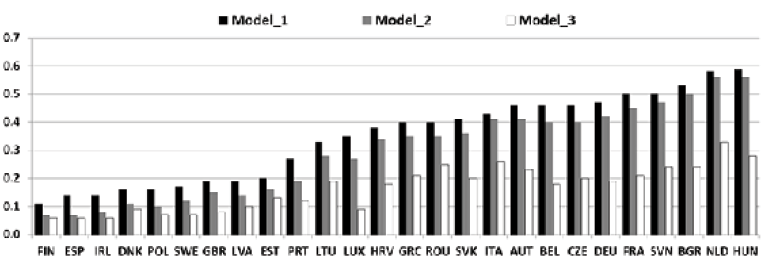
Figure 5. The intra-class correlation coefficients (ICC) for 26 EU countries.
The ESCS variable for post-socialist countries on average accounts for 22.0% (for 26 EU countries – 26.4%) of school level variance and 2.5% (for 26 EU countries – 3.7%) of students’ level average in science performance. The ESCS is a student-level variable, which explains 22.0% of the between-school variance and only 2.5% of the within-school variance that could reflect the socio-economic background segregation of peers. If we account for the student level only, the strongest association between students’ ESCS and science attainment is observed in Finland, followed by Sweden, Poland, and Ireland (Table 1). An increase in one unit of ESCS at the family level would lead to an increase in science performance by more than 30 score points. However, the effect of ESCS at the family level would result in less than 10 points of improved achievements in Hungary, Bulgaria, and Slovenia.
If we extend the student level model with the school level effect (Model_3), we obtain that the association between peers’ ESCS and science attainment is stronger than the association between students’ ESCS and science attainment. For the post-socialist countries, the association between peers’ ESCS and science attainment is on average 4.7 times larger than between students’ ESCS (average family level 15.0, average peer effect 70.8). As for the 26 EU countries, the association between peers’ ESCS and science attainment is on average 3.9 times larger than between students’ ESCS (average family level 18.2, average peer effect 71.8). There are countries like Finland, Poland, and Ireland, where both family and school levels are almost equally important (respectively 34.2 and 39.3; 31.5 and 37.9; 29.9 and 38.6). In Spain, the family level is more important than the school level (respectively 22.2 and 15.9). The association between peers’ ESCS and science attainment exceeds 100 score points in science performance for Netherlands, Slovenia, and France.
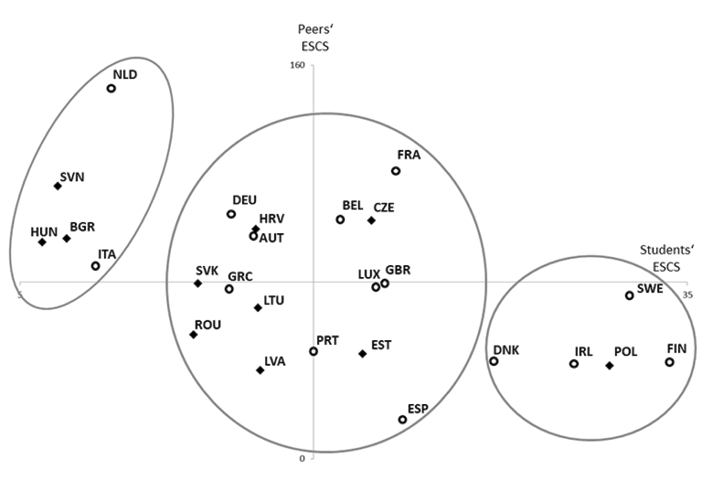
Figure 6. The regression coefficients of ESCS (students’ ESCS) and avESCS (peers’ ESCS) in Model_3. Post-socialist countries are labelled with diamonds. The axes cross at average.
As we can see in Figure 6, the countries (post-socialist countries are marked using diamond shapes) are scattered according students’ and peers’ socio-economic statuses. We can identify three groups: the group in the left, with a high peer and low student effect, the group in the right, with a low peer and high student effect, and the biggest group in the middle, with an average peer and student effect. Poland is close to Scandinavian countries and Ireland, for which the students’ ESCS component is the largest comparing to other countries. Denmark, Ireland, Poland, and Finland have almost equal peers’ ESCS estimates and only the students’ ESCS part discriminates among the countries. On the opposite side of the chart there are countries like Slovenia, Hungary, and Bulgaria, which look similar to Italy. The Netherlands and Spain are different from all other EU countries and hold positions at the opposites of the scale – the biggest score of the peers’ effect is in the Netherlands, while Spain has the smallest score of the peers’ effect.
In general, more than a third (38%) of the total variance in science performance can be attributed to schools in new EU countries (35% in 26 EU countries). The socio-economic status is a very important variable according to which stratification operates, but its importance is different in EU countries – in Luxemburg, ESCS at both levels (students’ and schools’) explains almost all between-school variance, while in the Netherlands, Hungary, Italy, Romania, Slovenia, Bulgaria, and Austria, the between-school variance remains high after accounting for multilevel effects in ESCS. These countries should have other important factors to explain between-school variance in science performance. On average, the association between peers’ ESCS and science attainment is 4.7 times larger than between students’ ESCS for the post-socialist countries, and it is higher than compared to the average of 26 EU countries.
Discussion
Our results indicate that post-socialist EU member states do not form a separate educational “regime.” On the contrary – they vary in a broad range across the whole spectrum of 26 EU countries: both in terms of student achievement and in levels of social and academic segregation. The only indicator where the post-socialist states are more or less on the same side of the spectrum is the ESCS index, but the effect of ESCS on the level of student achievement varies. The correlation coefficient between the science score and ESCS index places Estonia on one side of the spectrum (the lowest among the EU member states) and Hungary on the opposite side (the highest among the EU member states). Therefore, we may assume that in this respect, post-socialist countries move along different trajectories of educational development. These different trajectories do not clearly indicate the convergence with one or another established Western model, be it the Scandinavian, Anglo-Saxon, Continental or Mediterranean models. Nevertheless, we can point out at least two distinct groups of post-socialist countries. Disparities between schools prevail in one of these groups (Hungary, Bulgaria, the Czech Republic, Romania, Slovakia, and Slovenia), while the other (Poland, Latvia and Estonia) is characterized by disparities within schools. In this respect, we may assume that the first group is closer to the Continental and Mediterranean models, and the second group – to Scandinavian and Anglo-Saxon models.
When we consider the influence of students’ and peers’ socio-economic statuses on academic achievements, the picture becomes more strange. In Slovenia, the Czech Republic, Croatia, Bulgaria, and Hungary, the peer effect is higher than average, while in Poland, Latvia, Lithuania, Estonia, and Romania it is lower than average. Here, again, we can trace a certain closeness to the Anglo-Saxon (Ireland) and Scandinavian (Finland, Sweden, Denmark) models. Poland is also the closest to Scandinavian countries and Ireland in the sense that the students’ ESCS component there is the largest comparing to other countries. In Hungary, Slovenia, Bulgaria, Slovakia, and Romania, the students’ ESCS component is the smallest. The Baltic States are in the middle and close to the average.
The results of our research illustrate that post-socialist countries underwent different transformations since the early 1990s, when they all had identical or at least very similar systems of education. There are not so many factors left that still enable researchers to consider them as a more or less coherent group: perhaps it is just the common socialist past and a relatively lower standard of living when comparing with the “old” EU member states. However, these factors are eventually becoming less and less important. Therefore, we tend to agree with Beblavy, Thum, and Veselkova (2011), who note that the “new” EU countries do not make up one type but adhere to either the Germanic or Nordic country models, largely in alignment with their history and/or geography. The Baltic states and Poland are geographically close to Scandinavian countries and inevitably experience the Nordic socio-cultural influence. On the other hand, these countries, especially Poland and Lithuania, are rather familiar with the Anglo-Saxon world due to the large diasporas living in the USA and UK and tend to borrow their educational models. The rest of post-socialist countries are geographically, historically, and culturally linked with the Continental tradition. At the same time, our research supports the assumption of Fenger (2007), who claims that if convergence is occurring, the transitional stage takes much longer than anticipated. A decade or two ago there were expectations that the process of post-socialist transition will end with the states’ accession to the EU. Nowadays we can see that this was not the case. New member states continue to live in a transitory period where one can observe heterogeneous post-socialist educational models, which are still on the way to further development.
Conclusions
Post-socialist EU member states, in terms of academic and social segregation, do not form a separate “educational regime.” The only indicator where the post-socialist states are more or less on the same side of the spectrum is the ESCS index. At least two distinct groups of post-socialist countries can be pointed out. In one of them (Hungary, Bulgaria, Czech Republic, Romania, Slovakia, and Slovenia), the disparities between schools prevail, and the other (Poland, Latvia, and Estonia) is marked by disparities within schools. When considering the influence of students’ and peers’ socio-economic statuses on academic achievements, the picture seems stranger. In Slovenia, the Czech Republic, Croatia, Bulgaria, and Hungary, the peer effect is higher than average, while in Poland, Latvia, Lithuania, Estonia, and Romania, it is lower than average. The research supports the assumption that if convergence occurs between the countries, the transitional stage takes much longer than anticipated.
Acknowledgement
This work was supported by the Research Council of Lithuania under Grant MIP-024/2015.
Annex 1. The estimates, with standard errors and T statistics for the regression parameters of the models.
References
Aiginger, K., & Leoni, T. (2009). Typologies of Social Models in Europe. Institute of Economic Research WIFO.
Anderson, J. O., Milford, T., & Ross, S. P. (2009). Multilevel modeling with HLM: Taking a second look at PISA. Quality research in literacy and science education, 263–286. https://doi.org/10.1007/978-1-4020-8427-0_13
Arts, W. & Gelissen, J. (2002). Three worlds of welfare capitalism or more? A state-of-the-art report. Journal of European Social Policy, 12, 137–158. https://doi.org/10.1177/0952872002012002114
Beblavy, M., Thum, A. E., & Veselkova, M. (2011). Education Policy and Welfare Regimes in OECD Countries. Social Stratification and Equal Opportunities in Education. Bratislava: Centre for European Policy Studies. https://doi.org/10.2139/ssrn.1996471
Bernstein, B. (1971). Class, Codes, and Control. Vol. 1; London: Routledge & Kegan Paul.
Borman, G., & Dowling, M. (2010). Schools and inequality: A multilevel analysis of Coleman’s equality of educational opportunity data. Teachers College Record 112.5, 1201–1246.
Bourdieu, P., & Passeron, J.C. (1977). Reproduction in Education, Society and Culture. London: Sage Publications.
Caldas, S. J., & Bankston C. (1997). Effect of School Population Socioeconomic Status on Individual Academic Achievement, The Journal of Educational Research, 90:5, 269–277, https://doi.org/10.1080/00220671.1997.10544583.
Cerych, L. (1997) Educational Reforms in Central and Eastern Europe: Processes and Outcomes. European Journal of Education, 32 (1), 75–96.
Coleman J.S. (1966). Equality of Educational Opportunity. Washington, DC: Government Printing Office.
Deacon, B. (1993). Developments in Eastern European Social Policy. In: Jones, C. (ed.) New Perspectives on the Welfare State In Europe. London: Routledge.
Esping-Andersen, G. (1990). The Three Worlds of the Welfare Capitalism. Cambridge: Polity Press.
Esping-Andersen, G. (1996). After the Golden Age? Welfare State Dilemmas in a Global Economy. In: Esping-Andersen, G. (ed.) Welfare States in Transition. National Adaptations in Global Economies. London: Sage. https://doi.org/10.4135/9781446216941.n1
Fenger, H. J. M. (2007). Welfare Regimes in Central and Eastern Europe: Incorporating Post-Communist Countries in a Welfare Regime Typology. Contemporary Issues and Ideas in Social Sciences, August 2007.
Hega, G. M., & Hokenmaier, K. G. (2002). The Welfare State and Education: A Comparison of Social and Educational Policy in Advanced Industrial Societies. German Policy Studies, 2 (1), 1–28.
Jenkins, S. P., Micklewright, J., & Schnepf, S. V. (2008). Social Segregation in Secondary Schools: How Does England Compare with Other Countries? Oxford Review of Education, 34.1, 21–37. https://doi.org/10.1080/03054980701542039
Kogan, I, Noelke, C. & Gebel, M. (2011) Making the Transition: Education and Labor Market Entry in Central and Eastern Europe. Stanford: Stanford University Press. https://doi.org/10.11126/stanford/9780804775908.001.0001
Lavrijsen, J., Nicaise, I., & Poesen-Vandeputte, M. (2014). The Flemish Education System in Comparative Perspective. A Re-Assessment of Educational Regime Typologies. Steunpunt Studie- en Schoolloopbanen, Leuven.
Marks, G. N., (2006). Are between- and within-school differences in student performance largely due to socio-economic background? Evidence from 30 countries, Educational Research, 48:1, 21–40, https://doi.org/10.1080/00131880500498396.
Mostafa, T. (2010). Decomposing Inequalities in Performance Scores: the Role of Student Background, Peer Effects and School Characteristics. International Review of Education, 56 (5/6), 567–589. https://doi.org/10.1007/s11159-010-9184-6
Muller, W. & Shavit, Y. (1998) From School to Work: A Comparative Study of Educational Qualifications and Occupational Destinations. Oxford: Clarendon Press.
OECD. (2009). PISA Data Analysis Manual: SAS, Second Edition.
OECD. (2016). PISA 2015 Results in Focus, Paris: OECD. DOI:10.1787/aa9237e6-en.
OECD. (2016). Education at a Glance 2016. OECD Indicators. Paris: OECD Publishing.
Oppedisano, V., & Turati, G. (2015). What are the causes of educational inequality and of its evolution over time in Europe? Evidence from PISA, Education Economics, 23:1, 3–24, https://doi.org/10.1080/09645292.2012.736475.
Pogosian, V. (2012) Russian Education Policy: Two Different Eras. Italian Journal of Sociology of Education, 1, 274–304.
Raitano M., & Vona, F. (2013). Peer heterogeneity, school tracking and students’ performances: evidence from PISA 2006, Applied Economics, 45:32, 4516–4532, https://doi.org/10.1080/00036846.2013.791020.
Raudenbush, S.W., & Bryk, A.S. (1986). A hierarchical model for studying school effects. Sociology of Education, 59, 1–17. https://doi.org/10.2307/2112482
Rumberger, R. W., & Willms, J. D. (1992). The impact of racial and ethnic segregation on the achievement gap in California high schools. Educational Evaluation and Policy Analysis, 14, 377–396. https://doi.org/10.2307/1164282
Sirin, S. R. (2005). Socioeconomic status and academic achievement: A meta-analytic review of research. Review of Educational Research, 75(3), 417–453. https://doi.org/10.3102/00346543075003417
Szebenyi, P. (1992) Change in the Systems of Public Education in East Central Europe. Comparative Education, 28 (1), 19–31. https://doi.org/10.1080/0305006920280103
Van de Werfhorst, H. G. & Mijs, J. J. B. (2010) Achievement Inequality and the Institutional Structure of Educational Systems: A Comparative Perspective. Annual Review of Sociology, 36, 407–428. https://doi.org/10.1146/annurev.soc.012809.102538
Vardardottir, A. (2015). The impact of classroom peers in a streaming system. Economics of Education Review, 49, 110–128. https://doi.org/10.1016/j.econedurev.2015.09.002
West, A. & Nikolai, R. (2013). Welfare Regimes and Education Regimes: Equality of Opportunity and Expenditure in the EU (and US). Journal of Social Policy, 42 (3), 469–493. https://doi.org/10.1017/s0047279412001043
Zimmer, R. W., & Toma E. F. (2000). Peer effects in private and public schools across countries. Journal of Policy Analysis and Management 19 (1): 75–92. https://doi.org/10.1002/(sici)1520-6688(200024)19:1<75::aid-pam5>3.0.co;2-w
Želvys, R., Jakaitienė, A., & Stumbrienė, D. (2017). Moving Towards Different Educational Models of the Welfare State: Comparing the Education Systems of the Baltic Countries. Filosofija. Sociologija 28 (2): 139–150.