Socialinė teorija, empirija, politika ir praktika ISSN 1648-2425 eISSN 2345-0266
2019, vol. 19, pp. 26–43 DOI: https://doi.org/10.15388/STEPP.2019.9
Tax Morale and Public Sector Revenues in Baltic Countries
Virgilijus Rutkauskas
Lithuanian Center of Social Research, Institute of Social Welfare
virgis.rutkauskas@gmail.com
Abstract. This article investigates issues behind households’ tax payment morale, theoretical and practical aspects of the tax payment gap, and its impact on public sector revenue in Baltic countries. The attitude of households on tax payment is assessed quantitatively by employing a dichotomous logit-probit regression analysis. The tax payment gap among Baltic households has been investigated by applying a “macro approach,” the main components of which are the shadow economy and the total tax rate. The effect of any hypothetical changes in tax morale is assessed by applying social accounting matrixes, which are based on national account data and allow to keep the economy balanced at all time. The results presented in this research suggest that taxes uncollected from households constitute nearly one fifth of total general government revenues and count nearly one tenth of the nominal GDP. Measures applied to strengthening tax morale positively contribute to public sector revenue and in general to the economy, though they should be applied gradually.
Keywords: tax payment gap, tax morale, public sector revenue, logit-probit analysis, social accounting matrixes.
Mokesčių moralė ir viešojo sektoriaus pajamos Baltijos šalyse
Santrauka. Straipsnyje yra analizuojama aktuali daugeliui valstybių prastos mokesčių mokėtojų moralės ir dėl to atsirandančios mokesčių spragos problematika. Atsižvelgus į tai yra siūloma priemonių mokesčių moralei stiprinti ir pateikiamas netradicinis – nacionalinių sąskaitų pagrindu parengtų socialinės apskaitos matricų – metodas mokesčių moralės pokyčiams ir viešojo sektoriaus pajamoms įvertinti. Gyventojų mokesčių moralei reikšmingiausią įtaką daro tokie veiksniai korupcijos toleravimas, pasitikėjimas valdžia, nacionalinis pasididžiavimas ir religingumas. Apskritai atliktas tyrimas patvirtina ekonominės elgsenos svarbą vertinant mokesčių surinkimą. Kaip pavyzdys yra pasitelktos Baltijos šalys, kuriose mokesčių spragos problema yra itin aktuali.
Pagrindiniai žodžiai: mokesčių moralė, mokesčių spraga, viešojo sektoriaus pajamos, logistinė regresinė analizė, socialinės apskaitos matricos.
Received: 20/12/2018. Accepted: 12/05/2019
Copyright © 2019 Virgilijus Rutkauskas. Published by Vilnius University Press. This is an Open Access article distributed under the terms of the Creative Commons Attribution Licence, which permits unrestricted use, distribution, and reproduction in any medium, provided the original author and source are credited.
Introduction
The payment of taxes is an agreement among taxpayers and the state. Taxpayers commit to pay taxes, and the state provides public goods and security that otherwise would not be available in a market economy. However, the universal aversion to tax theory contradicts the previous statement in a way that every rational economic agent will tend to increase its well-being by reducing tax payments and seeking public benefits. Practical outcomes support this statement: 90% of public revenues are raised from tax contributions, but at the same time, uncollected taxes constitute nearly one fifth of all taxes. Therefore, attention to a practical and theoretical examination of the factors that have the most pronounced influence on tax payment is growing rapidly.
The background for the decision whether to pay taxes or not is based on a cost-benefit analysis. Usually, the two main indicators – tax base and tax rate – as it is shown in this research, are unable fully and comprehensively explain changes in tax payments, suggesting the existence of other explanatory variables. This is the reason behind the growing attention to alternative factors, which could disclose unwillingness to pay taxes more accurately. Moreover, an exploration of issues behind weak tax payment is vital for a number of countries, as changes in willingness to pay taxes may contribute considerably to state budget. The main drawback of tax morale researches is the lack of appropriate data sources. Usually, assessments in the field of tax evasion are based on data provided by surveys, experiments, or laboratory outcomes, because tax evasion, as well as the existence of a tax payment gap, is characterized by a criminal background.
The aim of this research is to reveal factors affecting unwillingness to pay taxes and, by disclosing the magnitude of the tax payment gap among households, simulate the possible effects of tax morale changes on the public sector revenue. The analysis of tax morale is based on the data provided by World Values Survey and European Values Study. Data received from these surveys are quantitatively assessed by employing dichotomous logit-probit regression models. The analysis of the tax payment gap is based on a “macro approach,” which is in turn based on national account data. National account data also have been used to create social accounting matrixes, which are a prominent instrument for consistent imitative simulations of the economy.
Aside from the introduction and conclusions, this study is constituted of five main sections: the first discusses the importance of taxes in a contemporary economy, the second deals with the magnitude of tax evasion and the tax payment gap in Baltic countries, while the third presents the main factors comprising tax morale, discerned from the existing literature on the subject. In the fourth section of this research, a quantitative assessment of tax morale in Baltic countries is revealed together with the results. The fifth section provides background for the creation of social accounting matrixes and simulates the outcomes from possible changes in tax morale.
The Economic Meaning of Taxation
Taxes affect the economy and the behavior of taxpayers in different ways. As Levine-Schayowitz (2005) states, when governments raise taxes, people alter their behaviors and make decisions they would not make otherwise. This suggests that when the behavior of private citizens is affected by a tax, the allocation of resources changes as well. Because taxes raise the prices buyers pay, providing incentives to consume less, and lower the prices sellers receive, providing incentives to produce less, the size of the market shrinks below its optimum level in the sense that revenues raised by government taxation may be less than the outcomes of a distorted market. Changes in tax policies also affect decisions to participate in the labor market, the choice of occupation, tax avoidance schemes, and the degree of tax evasion activities through participation in the formal or informal sector of the economy.
Taxes constitute the main part of public sector revenues in modern economies. Usually, changes in tax collection determine whether the government is running a budget surplus or deficit. In the case the public sector has more revenues and savings than expenditures, public spending toward consumption and investment increases without building up debt. This positively contributes to the general economy because public spending increases the ceteris paribus aggregate demand. If public expenditure remains higher for a longer period, the widening gap between revenues and expenditure needs to be covered using borrowed funds or a decrease in reserves (in case the country has reserves). Both outcomes are generally unwelcome, because the growth of debt means an increasing debt burden for future generations and usually becomes a leading indicator for future tax increases, as proposed by the Ricardo-De Viti-Barro equivalence theorem. Thus, the decisions of economic agents whether to pay taxes or not have ultimately direct impact on them, as tax payment is directly linked to provision of public goods and services and the public sector’s indebtedness.
A budget deficit is a common issue for the public sector in the aftermath of financial or economic crises. The main reason for this is the increase of public sector expenditures to support a faster economic recovery. J. M. Keynes presented such a view during the Great Depression. However, it could be added (Rutkauskas 2015) that public borrowing after an economic downturn is a consequence of the usually enormous building of private debt prior the bust. Greater flows of consumption and investment during the economic boom phase support faster growth and push the economy into a new, greater level. When an economic downturn begins, a drop in borrowing, and simultaneously in consumption and investment of the private sector, results in a much lower GDP level. The same level of funds is required to keep the economy close to its previous equilibrium; however, the private sector tends to save rather than consume more in bust periods (or they are forced to do so due to a lack of lending willingness by financial intermediaries). The crucial role in terms of automatic stabilizers and general expenditure is played by the public sector, which behaves like a substitute for drops in private sector expenditure.
The main share of the general government’s revenues comes from taxes. Three taxation sources – a value-added tax, taxes on income, and wealth and social contributions – are the main ones. As this research investigates issues behind tax payment and tax morale only among households, it is important to clarify the households’ share in tax contributions. It is clear that income and wealth taxes, as well as social contributions (the majority of them), are paid by households. National accounts do not provide the final payers of value-added tax and puts it as a payment made by total national economy. However, value-added tax is recorded as being borne by purchasers, not sellers, and then only by those purchasers who are not able to deduct it. Thus, the greater part of this tax is recorded as being paid on final uses, mainly by households for their consumption (European Commission, 2013). Based on this, an assumption is presented in this research that all of the value-added tax has been paid solely by households. Thus, an investigation into the willingness to pay taxes should be concerned mainly with the households’ behavior. Before assessing households’ tax morale, in the next section of this research, an estimation of the tax payment gap – an outcome of tax avoidance – is provided.
Tax Payment Gap
Estimating and dissecting the difference between taxes due and collected (or simply the tax payment/compliance gap) is becoming more common but remains an exception, even in advanced economies. Measuring the tax payment gap depends on the data and resources available. Generally, two main approaches – the “bottom-up” and “top-down” – are used.
The “bottom-up” approach is based on estimations made from audit results or other operational information. This way is rather costly but provides direct intelligence on the nature of non-compliance. As K. Raczkowski (2015) argues, this approach rests on selected control and audit methods within the representative group, which is subsequently generalized for the whole population surveyed. However, it should be kept in mind that audits ought to be limited in their scope but adequately targeted. Nevertheless, they cannot be the most cost-effective form of research into the tax gap, yet they should rely on prospective analyses as part of the audit additionally carried out in the real time.
The “top-down” or “macro approach” uses national accounts and other data to model the tax base and estimate revenue under perfect compliance, subtracting actual collections to arrive at the tax payment gap. This has the advantage of using readily publicly available data, but its accuracy depends on the data used and may provide little insight into how compliance might be improved (IMF, 2015). K. Raczkowski (2015) adds that the “top-down” approach does not conduct physical controls on the taxpayer but relies on tax declarations and other data sources, which mostly allow for the determination of the tax gap in a less precise manner than physical audits.
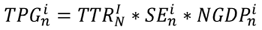
The first approach has been used mostly by tax authorities, as they possess data usually inaccessible for individual and external users. Thus, the second approach is more common, especially for making international comparisons, as it is the case of this research. K. Raczkowski (2015) has described one of the ways to employ a “top-down” or “macro” approach by measuring the tax payment gap (TPG). The author argues that a multiplication of three main components (1) can reveal the nominal amount of unpaid taxes, i.e., the total tax rate (TTR); the gross domestic product (in nominal terms; NGDP); and the size of the shadow economy (SE), where i represents the country, and n – the period.
 (1)
(1)
In his paper, K. Raczkowski (2015) takes the total tax rate as paid by businesses excluding such taxes as the personal income tax, value-added taxes, sales taxes, or goods and service taxes. However, the purpose of this research is to investigate tax morale and the compliance of households as they are the main taxpayers; thus, the total tax rate of businesses has been changed into implicit tax rates on income and consumption. The results of these calculations are presented in Table 1, and they reveal that in 2015, the tax payment gap in Baltic countries comprised 2.1-3.5 billion euros, or nearly one tenth of the nominal GDP. As the size of the estimated shadow economy is nearly similar in Baltic countries, the main driving factor of the tax payment gap, based on the “top-down” approach, appears to be the tax rate: the higher the tax rate, the bigger the uncollected tax revenue for the government is estimated (see the case of Estonia).
Table 1: A calculation of the tax payment gap (TPG) among the Baltic countries.
|
|
2007 |
2008 |
2009 |
2010 |
2011 |
2012 |
2013 |
2014 |
2015 |
|
Estonia |
|||||||||
|
TTR, % |
57.8 |
54.8 |
60.6 |
61.3 |
61.0 |
60.1 |
59.2 |
60.2 |
60.6 |
|
SE, % of NGDP |
17.8 |
19.4 |
24.6 |
23.0 |
19.7 |
18.3 |
18.0 |
17.5 |
18.5 |
|
TPG, % of NGDP |
10.3 |
10.6 |
14.9 |
14.1 |
12.0 |
11.0 |
10.6 |
10.5 |
11.2 |
|
Latvia |
|||||||||
|
TTR, % |
49.3 |
46.5 |
48.1 |
51.5 |
53.1 |
53.5 |
52.6 |
52.3 |
51.6 |
|
SE, % of NGDP |
17.0 |
18.3 |
21.2 |
20.4 |
18.7 |
17.3 |
16.7 |
15.9 |
16.6 |
|
TPG, % of NGDP |
8.4 |
8.5 |
10.2 |
10.5 |
9.9 |
9.3 |
8.8 |
8.3 |
8.6 |
|
Lithuania |
|||||||||
|
TTR, % |
50.9 |
50.1 |
48.6 |
48.9 |
48.9 |
48.6 |
48.6 |
49.2 |
49.9 |
|
SE, % of NGDP |
20.6 |
20.3 |
24.3 |
23.1 |
20.9 |
19.3 |
18.3 |
17.6 |
18.7 |
|
TPG, % of NGDP |
10.5 |
10.2 |
11.8 |
11.3 |
10.2 |
9.4 |
8.9 |
8.7 |
9.3 |
Sources: Eurostat, Medina and Schneider (2018), and author’s calculations.
The factors affecting public sector’s revenues in gathering and balancing the budget are important to securing the fulfillment of a contract among public and private sectors. Thus, the tax base, tax rates, and taxation systems in general are and will be under high interest in searching for the most efficient taxation model or policy that enables governments to maximize public revenues. The classical taxation model suggests looking at the taxpayer as a decision-maker with an aim to maximize benefit. Before paying taxes, an economic agent performs a cost and benefit analysis and looks for two possible options. One of them is not to pay taxes and to potentially pay a fine in the case of audit by a tax authority; the second – to pay taxes. However, a number of unanswered questions remain. For instance, why do economic agents tend to pay taxes and why not? What are the main factors behind their decisions, and how could these factors be influenced? What role could the government play in all this? An increasing number of researchers are looking for ways to explain the so called “soft factors” – other than the tax base and rate – behind taxpayers’ behavior.
Factors behind Tax Collection
In contemporary economic theory, the payment of taxes is a bilateral agreement between an economic agent and the state, because the latter is basically grounded on that way of funding. Economic agents agree to pay taxes to the state, for public goods and security in return. At the same time, economic agents are rational benefit-seekers and will try to avoid or minimize tax payments and will simultaneously seek public goods and security. Samuelson (1954) argued that the private provision of public goods would be inefficiently low, because everyone would have an incentive to “free ride” on the private purchases of others. The theory of general reluctance to pay taxes also brings arguments that are contrary to the concept of a conscious taxpayers’ agreement with the state. The fiscal illusion theory adds that a rational economic agent realizes the need to have a balanced level of public finance (the expenditures on public goods and security should not exceed the revenues of the state in the long run). Notwithstanding this, a rational economic agent tends to seek financial benefits from the state and not pay for public goods and services via taxes. Thus, such a behavior is assessed as irrational.
The public sector uses legal powers to force economic agents distribute part of their revenues via taxes. There are three possible ways to deal with taxation: (1) agree to pay taxes, (2) evade taxes, or (3) avoid taxes. An agreement to pay taxes is not under the aim of this research and thus will not be assessed further. Tax evasion and tax avoidance have at once similar and different meanings that must be clarified. According to the Organization for Economic Cooperation and Development, tax evasion is linked to illegal agreements among parties in order to conceal on taxes or elude the fulfillment of tax liabilities. Meanwhile, tax avoidance is linked to searching for legal abilities enabling to diminish tax payments (OECD, 2015). For the purpose of this research, differences between tax evasion and tax avoidance are not that important, because the result of a general unwillingness to pay taxes, and not the type of it (evasion or avoidance), is under concern. Considering this, within the scope of this research, tax evasion and tax avoidance are taken as synonyms.
M. Allingham and A. Sandmo presented the most famous income tax avoidance model in 1972. Their research was based on G. S. Becker’s Crime and Punishment: An Economic Approach. In this paper, G. S. Becker (1968) proposes to look at tax payment as an optimal portfolio formation exercise, where the taxpayer either chooses to take a risky path and not pay taxes but faces the probability of being audited by a tax authority or chooses the safe portfolio and pays taxes as it is stated by the law. S. Yitzhaki (1974) complemented the model with an instance of a fine in case the fact of tax evasion is detected. Such an approach allows investigating the sensitivity of taxpayer behavior to factors like probability to be audited, fines, the tax rate, etc. However, this model received some critique, which was acknowledged by its authors. The weakest point here is the assumption that the taxpayer benefits only by avoiding paying taxes, as the classical model does not consider the economic goods and services that are provided by the state. Thus, the only rational outcome in this case would be to avoid paying taxes and free-ride, as suggested by Samuelson (1954). This drawback is well-perceived by the authors; however, because of its simplicity, it is commonly used to explain the unwillingness to pay taxes.
Why do people pay taxes, then? J. Alm et al. (1992) have raised this question, and the results of their experiment suggest that compliance occurs because some individuals overweight the low probability of audit, although such overweighting is not universal. Compliance does not occur simply because individuals believe that evasion is wrong, since the subject behavior is unchanged using either neutral or loaded terms. Moreover, there is evidence that individuals pay taxes because they value public goods that their taxes are funding. At this stage, it should be noted that individuals exhibit a remarkable diversity in behavior. They sometimes appear either to overweight low probabilities or to be risk-seeking; on occasion, they are either cooperative or act like free-riders (as could be presented form empirical findings in Figure 1).
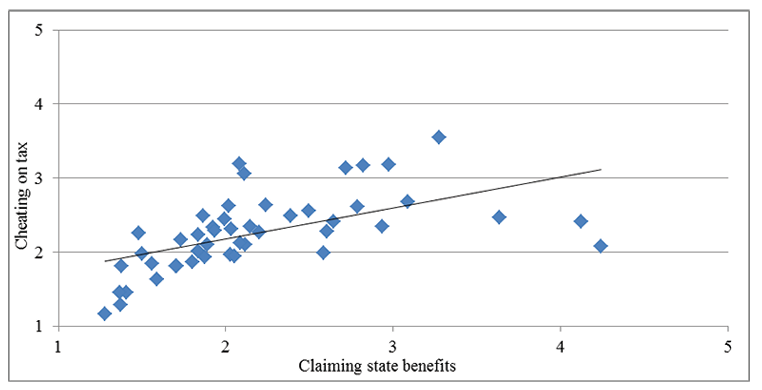
Figure 1: Relationship between cheating on taxes and claiming state benefits.
Sources: European Value Study (2008) and author’s calculations.
Note: growth in numbers represents a greater justification.
Recent research results in the tax payment field recognize that models like the one by M. Allingham and A. Sandmo lack explanatory power on some occasions. It is suggested that the behavioral economics theory could add more realistic factors to the classical model, like psychological comfort, the prestige of paying taxes, and others. Daude et al. (2012) explain that tax morale is based on an aspiration to be honest with the state and other taxpayers and a trust in the government. And on the contrary, dishonesty and distrust toward the government are directly linked to tax evasion. For instance, a poor quality of public goods could be perceived by the taxpayer as dishonest behavior by the authorities and thus result in an unwillingness to buy public goods by avoiding tax payments. Factors behind the willingness to pay taxes have been investigated differently by several authors (Slemrod, Yitzhaki 2002; Slemrod, Weber 2012). T. O. Weber et al. (2014) claim that the main challenge in investigating tax morale is the criminal background of such an activity. Correlation is found among tax payment and social norms, like belonging to a social group or country, patriotism, or justice.
Quantitative Assessment of Tax Payment Morale
Among the number of issues that challenge the assessment of tax avoidance is the criminal background of such activity. As a result, a scarcity of data is common for researches in the field of tax payment morale (or simply “tax morale”). One of the commonly used sources are data from the World Values Survey (WVS) and European Values Study (EVS). These regular, globally performed surveys investigate their respondents’ opinions in different fields, like living conditions, family, religion, society, policy, economy, etc. Martinez-Vazquez and Torgler (2005), Alm and Torgler (2006), Torgler and Schneider (2006), Lago-Peñas and Lago-Peñas (2010) have used WVS and EVS data for investigating tendencies in willingness to pay taxes and other indicators. WVS and EVS are based on a common methodology; their data are thus comparable across time periods and countries.
As a dependent variable for analysis, individual answers to the question “Cheating on taxes if you have a chance” are taken with possible answers varying from 1 (“never)” to 10 (“always”). Considering that data pulled from answers are categorical variables, according to Gujarati (2004), a simple linear regression is not suitable, and instead a logit-probit regression model should be used. Moreover, a number of researchers in the tax morale field support such an approach. A summary of researches in the tax morale field (see Table 2) shows that the main independent variables are age, gender, religiousness, employment, marital status, trust in public institutions, and democracy.
Table 2: Quantitative assessment of factors behind tax morale.
|
Reference |
Sample and |
Tested |
Significant |
|
B. Torgler (2005) |
Switzerland. Data from the ISSP. Year 1998. Weighted ordered probit estimation. |
Gender, age, marital status, education, employment status, personal income, church attendance, direct democracy, trust in the court and legal system, tax rate, fine rate and audit probability, culture variables (language dummy variables). |
Education (+) Students and pensioners (+) Trust in the court and legal system (+) Religiousness (+) Democracy (direct) (+) |
|
J. Martínez-Vázquez, B. Torgler (2005) |
Spain. Data from WVS and EVS. Years 1981, 1990, 1995 and 1999/2000. Weighted ordered probit estimation. |
Gender, age, marital status, employment status, religiousness, trust in the parliament, national pride, time dummy variables. |
Tax morale is stronger in the 90s than in the 80s Age and religiousness (+) Upper-class individuals (–) Trust in the parliament and national pride (+) |
|
J. Prieto et al. (2006) |
Spain. Data from the ISSP. Year 1998. |
Gender, age, marital status, education, self-employed, social class, size of municipality of residence, political party voted for. |
Age (+) Self-employed (–) Voters of nationwide parties (+) |
|
B. Torgler, F. G. Schneider (2006) |
Spain, Switzerland, and Belgium. Data from the WVS (1995–97) and the EVS (1999–2000). Weighted ordered probit estimation. |
Gender, age, marital status, education, employment status, social class, personal income, church attendance, direct democracy, national pride, trust in the political institutions and government, attitude toward democracy, personal income tax rate, fine rate and audit probability (for Switzerland), culture variables (regional and language dummy variables). |
Cultural and regional differences affect tax morale in both Switzerland and Spain Trust in the legal system, government, and parliament, national pride, and pro-democratic attitudes (+) Religiousness (Belgium and Switzerland ) (+) Direct democracy (Switzerland) (+) Women (+) |
|
B. Torgler (2006) |
Thirty-two world countries (mainly EU). Data from the WVS (1995–1997). Weighted ordered probit estimation. |
Gender, age, marital status, education, employment status, social class, financial situation, risk aversion, religiousness (church attendance, religious education, active in a church group, importance of religion, religious guidance, trust in the church), corruption, trustworthiness. |
Religiousness (+) Age (+) Risk aversion (+) Upper-class individuals (–) Financial satisfaction (+) Retired, home workers, and part-time employed (+) Women (+) Married (+) Living together (–) Education (–) Trustworthiness (+) Perceived corruption (–) |
|
J. Alm, B. Torgler (2006) |
USA and Spain. Data from the WVS. 1999–2000. Common cross-country slopes are imposed. Weighted ordered probit estimation. |
Gender, age, marital status, education, employment status, church attendance, trust in the parliament, country dummy variables. |
Tax morale is lower in Spain than in the USA Age (+) Religiousness (+) Women (+) Married (+) |
|
J. Alm, B. Torgler (2006) |
Sixteen EU countries. Data from the WVS (1990–93). Common cross-country slopes are imposed. Weighted ordered probit estimation. |
Gender, age, marital status, employment status, church attendance, country dummy variables. |
Age (+) Religiousness (+) Self-employed (+) Pensioners (+) Married (+) |
|
R. G. Cummings et al. (2007) |
Botswana (1999) and South Africa (2000). Data from Afrobarometer. Common cross-country slopes are imposed. Ordered probit estimation. |
Gender, age, education, employment status, country dummy variables. |
Age (+) |
Source: made by the author and based on Lago-Peñas and Lago-Peñas (2010).
For researchers in the tax morale field, it is common to use dichotomous (binary) instead of multinomial logit-probit regressions. According to Torgler and Schneider (2006), the main reason behind this is a lack of dependent categorical indicators for performing a reliable analysis. To explain the main factors behind taxpayers’ behavior, for every combination of variables, at least 20% of opposite indicators should appear (the same rule is applied in other types of logit-probit regressions). Otherwise, the explanatory power of a model decreases greatly. Data received from the WVS and EVS are based on surveys, thus on the opinions of the respondents and not on factual data. This is especially important for tax morale researches, as the object contains criminal activity and thus the respondents may be forced to provide dishonest answers.
The research of tax morale factors in Baltic countries is based on WVS and EVS data. Data for every single country have been assessed separately by applying a dichotomous logit-probit regression analysis. Ten independent variables (based on the results from earlier researches presented in Table 2) and one dependent variable have been taken to investigate the importance of different factors on tax morale for every single country. The suitability of the whole model (2) is assessed not by the coefficient of determination, as it is common for liner regressions, but by the share of classified cases. The case is assessed as classified when the results received by the model are the same as those collected during the survey for every individual response. As Gujarati (2004) suggests, more than 50% of classified cases by the model allow for assessing the model as suitable.
 (2)
(2)
where: i – country; s – survey; bn – coefficient; P – probability; C – Constanta; TM – tax morale; G – gender; A – age; MS – marital status; Ed – education; Em – employment; I – income; R – religiosity; CP – confidence in parliament; NP – national pride; B – acceptance of bribe.
As one of aims of this research is to investigate the issues behind willingness to pay taxes, and since the author tends to apply a dichotomous instead of a multinomial logit-probit regression model for every country, for the dependent variable TM, two possible outcomes are assigned (1 or 0). In case a respondent declared that one never cheated on taxes, the outcome is “1,” as this shows strong tax morale. In case the answers to the question “Cheating on taxes if you have a chance” range from 2 to 10, it has been assumed that a respondent’s tax morale is weak and the outcome is “0.” Based on this, equation (2) could be rewritten as follows (3):
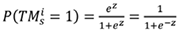 (3)
(3)
where:

Moreover, the importance of independent variables of the model is assessed by the odds ratio of coefficients. The odds ratio of coefficients is a specific ratio for logit-probit models and shows how a dependent variable (in this case, cheating on taxes if you have a chance, TM) could change in case one of the independent variables will increase by 1 and all others remain unchanged. The odds ratio is defined as the ratio of the probability of success P(Y=1) and failure P(Y=0), or P(Y=1)/P(Y=0). This ratio is assumed as the main one in assessing the importance of independent variables to the dependent one. The value of the odds ratio could vary from close to 0 (in case the probability of failure is approaching to 100) and to infinity (in case the probability of success is approaching to 100).
By analyzing the dependent variable, it is important to observe whether the value of the independent variable odds ratio is below or above 1. In case the odds ratio is 1, the probabilities of success and failure are equal to 0.5. The growth of the value of an independent variable by 1 with the odds ratio below 1 means that the dependent variable has a higher probability of success (P(Y=1)) than failure (P(Y=0)). And on the contrary – the growth of the value of an independent variable by 1 with the odds ratio above 1 means that the dependent variable has a lower probability of success (P(Y=1)) than failure (P(Y=0)). In Table 3, the average of independent variables odds ratios are presented. More detailed parameters of all the regressions are provided in the annexes for every Baltic country.
Table 3: Odds ratios’ averages of independent variables in the dichotomous logit-probit regressions.
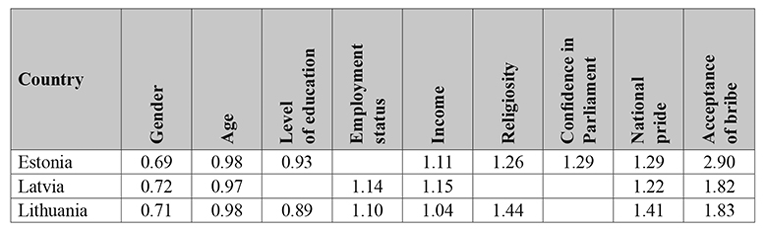
Source: calculated by the author.
Results of the tax morale analysis in the Baltic States suggest that the main factors behind weak tax payments are a wide spread of corruption, weak national pride, age, gender, and income (as younger, more educated individuals with higher income tend to contribute to tax payments less). Moreover, religiousness has a strong, direct positive link to willingness to pay taxes, as more religious taxpayers tend to cheat on taxes less. Based on the odds ratios, it could be stated that the most noticeable efforts of increasing tax morale should be directed at reducing the willingness to accept and give bribes, increasing confidence in Parliament (the Government in general) and national pride, and paying more attention to religiosity, as it helps to ensure tax collection.
According to Weber et al. (2014), tax morale could be increased by signing a “taxpayers’ honor code,” as this would in general increase dependence on society (thus national pride). Trust in government and tax authority plays a noticeable role in tax morale; thus, the image of public institutions should find its place in the political agenda. Moreover, the quality of public goods is not to be considered as the least important while making decisions to pay taxes or not; thus, the quality of goods, as well as quality of the institutions should be constantly monitored. Weber et al. (2014) continue that public institutions with the reputation of a coercive mechanism should find the way to earn the reputation of high-quality service providers. E. F. Luttmer and M. Singhal (2014) add that cooperation between the state and the individual taxpayer increases tax morale as well as dependency on the group and cultural effects, which could lead to higher tax compliance in the long run.
Assessment of Tax Morale Changes: A Balanced Approach
of Social Accounting Matrixes
Using national account data, which are based on consistency in a double or quadruple entry system, all economic flows are merged into a coherent system and become dependent on each other. As a result, national accounts make it possible to make consistent assessments of economic developments, covering interconnections between all institutional sectors. The objective of national accounts is to reveal the main macroeconomic variables, their relationships, and to provide more detailed information for economic analysis. It is no coincidence that the statistical information provided by the national accounts system is used to justify the political economy’s decisions and to assess the likely outcomes.
The macroeconomic accounting of a country’s economy, rendered by social accounting matrixes, allows not only to calculate the main macroeconomic variables but also to evaluate the effects of changes in economic policy in a rather simple and understandable way. Therefore, these tables are called social accounting matrixes; the term “social accounting matrixes” emerged in the 1950s, as part of the “Growth Program” led by Stone (Bos 1992). In general, social accounting matrixes have wide usage possibilities. For example, Pyatt and Thorbecke (1976) used them as a means of forecasting labor market development; they are also widely used by developing countries to assess income distribution, poverty rates, and employment. Thus, social accounting matrixes are not just a combination of macroeconomic variables that are useful to economic analysis – they allow solving macroeconomic and social problems.
The main aim of social accounting matrixes in term of this research is to determine the changes in the public sector revenue, taking into account the hypothetical changes in incomes accounting for households resulting from the improvement of tax morale and a more appropriate declaration of incomes. The circulation of flows in the economy is structured in such a way as to show the income of individual institutional sectors, and it reveals the income structure and inter-sectorial orders of the economy (Table 4). If the matrix indicates the flows representing the economic situation for a specific period, the more detailed breakdown of the main account blocks is a useful tool for analyzing the structural and political trends in the economy (Round 2003). Such an analysis allows assessing socioeconomic aspects, such as income level and distribution, by institutional units, the private and public use of these revenues for the acquisition of economic benefits (partly for living standards), payment and savings by institutional units, the production of economic goods, and the income of individual institutional sectors.
When compiling social accounting matrixes, it is necessary to assess the purpose of the analysis. Currently, the European System of Accounts (European Commission 2013) in the European Economic Area provides a solid basis for compiling social accounting matrixes, but the existing clauses do not allow for full coverage of social accounting matrixes. Therefore, some assumptions need to be made, or the analysis of accuracy should be partially discarded. Part of the national accounts must be presented as non-titled records, and the size of this part, as compared to other records, affects the quality of the analysis (see “Not assigned articles” in Table 4). However, there is not much of such undocumented content and, as opposed to all economic flows, they account for a small proportion.
Table 4. Social accounting matrix.
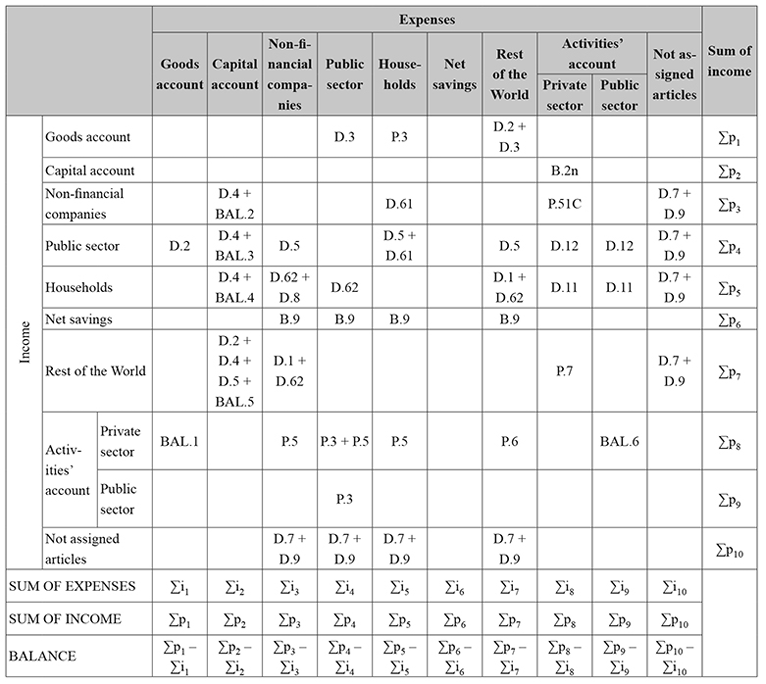
NOTE: the definitions of indicators provided in the table (for example, D.3 stands for “Subsidies”; P.3 – for “Final consumption expenditure”; etc.) are disclosed in the “European system of accounts – ESA 2010” (European Commission, 2013), with exception of BAL.X, as they stand for “balancing item.” “Balancing items” appear due to incompleteness of some national accounts, though with-out them is not possible to build balanced matrixes and full-fulfill the main requirement that the income of an economy should be equal to the expenses of the same economy.
Source: made by the author, based on data of the Bank of Lithuania (2012).
Social accounting matrixes are presented as an example in Table 4. They are created for three Baltic countries using national account data provided by Eurostat. Social accounting matrixes allow making simulations for a certain macroeconomic variable, subsequently balancing it once again and suggesting balanced outcomes. Such features are very in line with the main aim of this research. Taking into account that tax morale is very closely interlinked with the shadow economy (see the tax morale quantitative assessment results above), the presumption in this research is made regarding households’ willingness to receive properly accountable income, which, in turn, reduces the shadow economy as a result of a better tax morale.
The simulation modelling of social accounting matrixes is made in the following sequence. First, based on the national account data, a balanced (every column in the last row should be equal to 0) social accounting matrix is created for all Baltic countries. Second, an assumption is made that due to a growth of tax morale, households’ demand to declare an “officially” bigger part of their wages and salaries paid by the private sector will rise (hypothetical growth of D.11 by 10%). This produces an imbalanced social accounting matrix, and the purpose of third step is to balance it, as the main requirement is that the income of an economy should be equal to the expenses of the same economy in every moment. After balancing, new national account data are derived and, for the purpose of this research, the change of public sector’s (sum of row in the matrix) revenue is calculated. This shows a consistent and balanced estimation considering all sectors of the economy and their relations, of change not only in the public sector revenue but also other macroeconomic variables such as the NGDP.
The simulation modelling of social accounting matrixes showed that the hypothetical formulation of the population’s requirement to pay more official wages (which indicates a higher willingness to pay taxes) determines not only the increase of the public sector but also the total revenues of the companies and the general better performance of economy. Table 5 presents the results of a 10% simulation of households’ income increase and its impact on changes in public sector revenues for Estonia, Latvia, and Lithuania in a balanced way (meaning all institutional sectors contributed by strongly defined linkages to the change of one cell with no residual remaining).
Table 5: Change in public sector revenue (%) due to the private sector’s wages for households’ growth by 10%.
|
2004 |
2005 |
2006 |
2007 |
2008 |
2009 |
2010 |
2011 |
2012 |
2013 |
2014 |
2015 |
|
|
Estonia |
3.5 |
3.5 |
3.4 |
3.5 |
3.7 |
3.5 |
3.3 |
3.2 |
3.3 |
3.2 |
3.3 |
3.3 |
|
Latvia |
4.0 |
3.9 |
3.9 |
4.3 |
4.5 |
4.2 |
3.8 |
3.5 |
3.7 |
3.7 |
3.9 |
4.1 |
|
Lithuania |
3.9 |
3.6 |
3.7 |
3.5 |
3.4 |
3.5 |
3.3 |
3.2 |
3.2 |
3.2 |
3.2 |
3.4 |
Source: calculated by the author based on national account data (Eurostat).
The results for Baltic countries suggest that a growth of tax morale by households would lead to closing the tax gap and, accordingly, the growth of public sector revenue. During the years of observation, a 10% of hypothetical increase in non-shadow income by households will contribute to a nearly 4% growth of public sector revenues. However, measures taken to strengthen tax morale must be applied gradually, since, in the absence of a linear relationship between the tax morale and the tax gap, an excessive use of measures for strengthening tax morale may lead to a further increase in the tax gap (similar to the Laffer curve, which indicates a negative relation among the tax rate and tax revenue after some point in the rate’s growth).
Conclusion
The main share of public sector revenues are made up of tax contributions. However, rational economic agents tend to simultaneously avoid tax payments and consume public goods. Classical models concerned with the unwillingness to pay taxes are not always able to explain the factors behind weak tax morale. Thus, issues behind the gap of weak tax payment are filled with alternative methods suggested by tax morale researches and are assessed quantitatively by employing a dichotomous logit-probit regression analysis.
Results of the tax morale analysis suggest that the main factors behind weak tax payment are corruption and weak national pride. More efforts of national authorities while investigating tax evasion should be directed at men and taxpayers of a younger age. Additionally, more educated persons and those with higher income tend to evade taxes more. Also, religiousness has a direct strong positive link to the willingness to pay taxes. Based on the results of this research, it could be confirmed that the main factor under weak tax morale is corruption, which is additionally closely interlinked with the shadow economy and the tax payment gap.
A systematic assessment of the factors behind weak tax payment provides guidelines for public authorities in the field of greater tax morale in the country, as 10% of a hypothetical increase in households’ income will lead to up to a 4% growth of public sector revenues. Different measures, like the taxpayer’s honor code, a better quality of public goods, a greater trust in the state, patriotism, and a sense of community should be employed in order to increase tax morale. After employing different measures, the public sector could expect closing the gap between the real collection of taxes and planned tax collection, thus ensuring a better standing of public finance and a better ability to provide goods and services. However, measures strengthening tax morale should be applied gradually, as they may have contrary effect otherwise.
References
Allingham, M., and Sandmo, A. (1972). Income Tax Evasion: A Theoretical Analysis. Journal of Public Economics, 1: 323–338. https://doi.org/10.1016/0047-2727(72)90010-2
Alm, J., and Torgler, B. (2006). Culture Differences and Tax Morale in the United States and in Europe. Journal of Economic Psychology, 27: 224–246. https://doi.org/10.1016/j.joep.2005.09.002
Alm, J., McClelland, G. H., and Schulze W. D. (1992). Why do people pay taxes? Journal of Public Economics, 48: 21–38. https://doi.org/10.1016/0047-2727(92)90040-m
Bank of Lithuania (2012). Introduction to Social Accounting Matrixes. Lithuanian Economic Review, February of 2012, 30 p.
Becker, G. S. (1968). Crime and Punishment: An Economic Approach. The Journal of Political Economy, 76(2): 169–217. https://doi.org/10.1086/259394
Bos, F. 1992. The History of National Accounts. National Accounts Occasional Paper 48, Netherlands Central Bureau of Statistics. 35 p.
Daude, C., Gutierrez, H., and Melguizo, A. (2012). What Drives Tax Morale? OECD Development Center, Working Paper No. 315.
European Commission. (2013). European system of accounts – ESA 2010. Luxembourg: Publications Office of the European Union.
Eurostat database. Retrieved October 29, 2018: http://ec.europa.eu/eurostat.
EVS: European Values Study. Data and Downloads. Retrieved July 2, 2018. 1–4 Waves: http://www.europeanvaluesstudy.eu.
Gujarati, D. (2004). Basic Econometrics. Fourth Edition. McGraw-Hill Companies.
International Monetary Fund. (2015). Current challenges in revenue mobilization: improving tax compliance, April 2015. https://doi.org/10.5089/9781498344890.007
Lago-Peñas, I., and Lago Peñas, S. (2010). The Determinants of Tax Morale in Comparative Perspective: Evidence from European Countries. European Journal of Political Economy, 26(4): 441–453. https://doi.org/10.1016/j.ejpoleco.2010.06.003
Levine-Schayowitz, H. (2005). Taxation and consumer behavior. Handbook of public sector economics (ed. Robbins, D.). Marcel Dekker / CRC Press LLC. https://doi.org/10.4324/9781315093185-18
Luttmer, E. F., and Singhal, M. (2014). Tax Morale. Journal of Economic Perspectives, 28(4): 149–168. https://doi.org/10.1257/jep.28.4.149
Martínez-Vázquez, J., and Torgler, B. (2005). The Evolution of Tax Morale in Spain. Georgia State University, Working Paper No. 21.
Medina, L., Schneider, F. (2018). Shadow Economies Around the World: What Did We Learn Over the Last 20 years? IMF Working Paper 18/17, 76 p. https://doi.org/10.5089/9781484338636.001
OECD 2015. Glossary of Tax Terms. Retrieved August 15, 2018 http://www.oecd.org/ctp/glossaryoftaxterms.htm.
Pyatt, G.; Thorbecke, E. 1976. Planning Techniques for a Better Future. International Labour Office. 91 p.
Raczkowski, K. (2015). Measuring the tax gap in the European economy. Journal of Economics and Management, Vol. 21(3).
Round, J. 2003. Constructing SAMs for Developing Policy Analysis: Lessons Learned and Challenges Ahead. Economic Systems Research 15(2), 24 p. https://doi.org/10.1080/0953531032000091153
Rutkauskas, V. (2015). Financial Stability, Fiscal Sustainability and Changes in Debt Structure after Economic Downturn. Ekonomika, 94(3): 70–85. https://doi.org/10.15388/ekon.2015.3.8788
Samuelson, P. (1954). The pure theory of public expenditure. Review of Economics and Statistics, 36: 387–390. https://doi.org/10.2307/1925895
Slemrod, J., and Weber, K. (2012). Evidence of the Invisible: Toward a Credibility Revolution in the Empirical Analysis of Tax Evasion and the Informal Economy. Tax and Public Finance, 19(1): 25−53. https://doi.org/10.1007/s10797-011-9181-0
Slemrod, J., and Yitzhaki, S. (2002). Tax Avoidance, Evasion, and Administration. Handbook of Public Economics, 3: 1425–1469. https://doi.org/10.3386/w7473
Torgler, B., and Schneider, F. G. (2006). What Shapes Attitudes Toward Paying Taxes? Evidence from Multicultural European Countries. Social Science Quarterly, 88(2): 443–470. https://doi.org/10.1111/j.1540-6237.2007.00466.x
Weber, T. O., Fooken, J., and Herrmann, B. (2014). Behavioral Economics and Taxation. European Commission, Working Paper No. 41.
WVS: World Values Survey. Data & Documentation. Retrieved July 2, 2016. 1–6 Waves: http://www.worldvaluessurvey.org.
Yitzhaki, S. (1974). A Note on Income Tax Evasion: A Theoretical Analysis. Journal of Public Economics, 3(2): 201–202. https://doi.org/10.1016/0047-2727(74)90037-1
Annexes
Table A. Results of the dichotomous logit-probit regression for Estonia.
|
Year of survey |
1990 |
1996 |
1999 |
2008 |
2011 |
|
Independent variable |
Odds ratio / p value |
||||
|
Social-economic factors |
|||||
|
Age |
0.99 / 0.01 |
0.98 / 0.00 |
0.97 / 0.00 |
0.98 / 0.00 |
0.99 / 0.00 |
|
Employment status |
|||||
|
Gender |
0.74 / 0.06 |
0.57 / 0.00 |
0.76 / 0.03 |
||
|
Level of education |
0.93 / 0,08 |
||||
|
Income |
1.11 / 0.00 |
||||
|
Factors of worldview and faith |
|||||
|
Confidence in Parliament |
1.29 / 0.01 |
||||
|
National pride |
1.25 / 0.05 |
1.20 / 0.00 |
1.32 / 0.01 |
1.33 / 0.00 |
1.35 / 0.00 |
|
Religiosity |
1.20 / 0.08 |
1.31 / 0.01 |
|||
|
Acceptance of bribe |
1.76 / 0.00 |
1.48 / 0.00 |
1.97 / 0.00 |
2.30 / 0.00 |
6.98 / 0.00 |
|
Other parameters of regressions |
|||||
|
Classified cases, % |
72.9 |
66.4 |
71.8 |
70.0 |
76.1 |
|
Number of respondents included in regression |
695 |
886 |
621 |
621 |
1 397 |
|
Number of surveyed respondents |
1 000 |
1 021 |
1 005 |
1 518 |
1 533 |
|
Distribution of opposite indicators* |
34.9 / 65.1 |
56.5 / 43.5 |
55.9 / 44.1 |
46.9 / 53.1 |
43.7 / 56.3 |
* numbers of respondents included in regressions (case of evasion / not the case of evasion).
Source: calculated by the author.
Table B. Results of the dichotomous logit-probit regression for Latvia.
|
Year of survey |
1990 |
1996 |
1999 |
2008 |
|
Independent variable |
Odds ratio / p value |
|||
|
Social-economic factors |
||||
|
Age |
0.97 / 0.00 |
0.98 / 0.00 |
0.97 / 0.00 |
|
|
Employment status |
1.14 / 0.01 |
|||
|
Gender |
0.72 / 0.09 |
0.72 / 0.03 |
||
|
Level of education |
1.82 / 0.00 |
|||
|
Income |
1.15 / 0.03 |
|||
|
Factors of worldview and faith |
||||
|
Confidence in Parliament |
||||
|
National pride |
1.14 / 0.01 |
1.22 / 0.08 |
1.31 / 0.01 |
|
|
Religiosity |
||||
|
Acceptance of bribe |
1.51 / 0.00 |
1.82 / 0.00 |
1.98 / 0.00 |
1.97 / 0.00 |
|
Other parameters of regressions |
||||
|
Classified cases, % |
71.8 |
71.0 |
70.3 |
75.9 |
|
Number of respondents included in regression |
609 |
1015 |
637 |
984 |
|
Number of surveyed respondents |
903 |
1200 |
1013 |
1506 |
|
Distribution of opposite indicators* |
34.8 / 65.2 |
68.0 / 32.0 |
40.5 / 59.5 |
58.2 / 41.8 |
* numbers of respondents included in regressions (case of evasion / not the case of evasion)
Source: calculated by the author.
Table C. Results of the dichotomous logit-probit regression for Lithuania.
|
Year of survey |
1990 |
1997 |
1999 |
2008 |
|
Independent variable |
Odds ratio / p value |
|||
|
Social-economic factors |
||||
|
Age |
0.99 / 0.00 |
0.98 / 0.00 |
0.98 / 0.00 |
0.98 / 0.00 |
|
Employment status |
1.10 / 0.03 |
|||
|
Gender |
0.68 / 0.01 |
0.73 / 0.04 |
||
|
Level of education |
0.89 / 0.04 |
|||
|
Income |
1.14 / 0.01 |
1.10 / 0.02 |
0.88 / 0.00 |
|
|
Factors of worldview and faith |
||||
|
Confidence in Parliament |
||||
|
National pride |
1.41 / 0.00 |
1.48 / 0.00 |
1.29 / 0.00 |
1.47 / 0.00 |
|
Religiosity |
1.44 / 0.00 |
|||
|
Acceptance of bribe |
1.25 / 0.00 |
2.77 / 0.00 |
1.44 / 0.00 |
1.85 / 0.00 |
|
Other parameters of regressions |
||||
|
Classified cases, % |
64.9 |
74.1 |
66.0 |
72.5 |
|
Number of respondents included in regression |
861 |
721 |
677 |
978 |
|
Number of surveyed respondents |
1000 |
1009 |
1018 |
1500 |
|
Distribution of opposite indicators* |
42.2 / 57.8 |
53.8 / 46.2 |
57.6 / 42.4 |
62.1 / 37.9 |
* numbers of respondents included in regressions (case of evasion / not the case of evasion)
Source: author’s calculations.