Socialinė teorija, empirija, politika ir praktika ISSN 1648-2425 eISSN 2345-0266
2025, vol. 30, pp. 62–81 DOI: https://doi.org/10.15388/STEPP.2025.30.4
Adolescents’ Attitudes toward Taxes: Case of Lithuania
Vita Mikuličiūtė
Vilnius University
E-mail: vita.mikuliciute@fsf.vu.lt
https://orcid.org/0000-0001-8818-9140
Lauryna Rakickienė
Vilnius University
E-mail: lauryna.rakickiene@fsf.vu.lt
https://orcid.org/0000-0001-8830-177X
Gintautas Valickas
Vilnius University
E-mail: gintautas.valickas@fsf.vu.lt
Kristina Vanagaitė
Vilnius University
E-mail: kristina.vanagaite@fsf.vu.lt
Abstract. Objectives. Considering that adolescents are future tax payers, it is unfortunate that we know virtually nothing about their attitudes toward taxes. The goal of our research is to analyze the effects of sociodemographic characteristics such as age, gender, parental education and place of residence on adolescents’ attitudes toward taxes. Sample and settings. The participants were 1246 adolescents aged 11 to 18 (M = 14.30, SD = 1.98); 57 percent of the participants were female. Adolescents completed a questionnaire on attitudes toward taxes, whereas their parents provided sociodemographic information. Scale of Adolescents’ Attitudes toward Taxes, consisting of 12 items falling into one of four interrelated attitude dimensions (Perceived fairness of taxation, Perceived inevitability of tax paying, Readiness to report tax evasion, and Readiness to pay taxes) has been specifically created for the purposes of this research. Statistical analysis. Correlation analysis, Independent sample t-test, ANOVA test, Exploratory and Confirmatory factor analysis were used in the framework of this research. Results. Age emerged as the only sociodemographic characteristic related to the general attitude toward taxes in adolescence: attitudes toward taxes tend to become more negative with age. The remaining three sociodemographic characteristics (gender, parental education, and the place of residence) were related only to some of the attitude dimensions with small effect sizes. Limitations. Generalization of the results to more diverse societies is limited because of the socioeconomic history of Lithuania.
Keywords: attitude toward taxes, adolescents, sociodemographic characteristics, socialization.
Received: 2024 10 03. Accepted: 2025 03 23.
Copyright © 2025 Vita Mikuličiūtė, Lauryna Rakickienė, Gintautas Valickas, Kristina Vanagaitė. Published by Vilnius University Press. This is an Open Access article distributed under the terms of the Creative Commons Attribution Licence, which permits unrestricted use, distribution, and reproduction in any medium, provided the original author and source are credited.
Introduction
Taxes serve as the foundation of a modern country’s economic functioning, making it crucial for citizens to engage in conscientious tax-paying behavior. Despite this, the European Commission reports a ‘value-added tax (VAT) gap’ annually, indicating a significant amount of underpaid taxes within the European Union. In Lithuania, specifically, the gap between the anticipated and the collected taxes is among the highest in the European Union, surpassing 20 percent in 2019 (Poniatowski et al., 2021). This raises the question: Why are citizens so reluctant to pay taxes?
The Theory of Planned Behavior posits that an individual’s behavior is determined by their behavioral intentions, which are influenced by attitudes, subjective norms, and perceived control (Ajzen, 1991). Consequently, one can forecast an individual’s tax-paying behavior based on their attitudes toward taxes (Fallan, 1999; Sussman and White, 2018). Unfortunately, attitudes toward taxes have been largely overlooked in the field of economic psychology.
When studying factors influencing the tax-paying behavior, most research tends to focus on financial and tax-related knowledge (Furnham, 2005; Saad, 2014; Savitri, 2015; Rachmawan et al., 2020). However, this presents a paradox, as studies indicate that there is no automatic causal relationship between financial knowledge and an improved financial behavior (Van Campenhout, 2015). A meta-analysis encompassing 201 previous studies on the correlation between financial literacy and financial behaviors was conducted in (Fernandes et al., 2014). The findings suggest that intervention programs designed to enhance financial literacy suffer from limited effectiveness, due to explaining only 0.1% of the variance in financial education, which is further diminishing over time. This issue of decay is particularly pertinent concerning tax knowledge and the actual tax-paying behavior. Students who learn about taxes in school may not apply this knowledge until several years later, if at all. Consequently, by the time they become taxpayers, the importance of tax-paying may have been forgotten.
In conclusion, tax knowledge does not appear to influence the tax-paying behavior as much as expected. This underscores the need for research to focus more on attitudes toward taxes rather than solely on tax knowledge. However, both adolescents’ attitudes toward taxes and the factors shaping them remain largely unexplored. To address this gap, our study examines adolescents’ attitudes toward taxes and the influence of sociodemographic characteristics – such as age, gender, parental education, and the place of residence – on these attitudes.
Conceptualization
While some studies have examined attitudes toward taxes, they typically do so in a qualitative manner (Furnham and Rawles, 2004; Randlane, 2012). Only a few studies have explicitly assessed their participants’ attitudes toward taxes by using questionnaires (Eriksen and Fallan, 1996; Fallan, 1999; Kirchler, 1999). These studies acknowledge that attitudes toward taxation encompass various dimensions. The Attitudes Towards Taxes Questionnaire (Eriksen and Fallan, 1996; Fallan, 1999) comprises four scales: (1) Own tax evasion (tax ethics), (2) Other people’s tax evasion, (3) Fairness of the tax system, and (4) Other illegalities (traditional crime). Kirchler (1999) developed a questionnaire also featuring four scales: (1) Perceived limitation of one’s freedom through tax obligations, (2) Attitudes towards tax evasion, (3) Moral standards regarding paying taxes, and (4) Actions to reduce or avoid taxes. However, it is not uncommon for attitudes toward tax paying to be measured with a single item in large-scale studies (Torgler and Schneider, 2007).
Furthermore, research on tax (non-)payment typically focuses on the attitudes and behaviors of adults (Dell’Anno, 2009; Pampel et al., 2019; Holbrook et al., 2022). Although results indicate a correlation between attitudes toward taxes and tax payment (Dell’Anno, 2009), the practical application of such studies is challenging because the attitude system of adults is often rigid and not easily changed (DeLeeuw et al., 2015). This poses a problem in cases where individuals hold negative attitudes toward tax paying. Middle childhood and adolescence are periods during which attitudes can be more readily modified (Moschis, 1985; Van Campenhout, 2015). Therefore, an intervention at this age may be beneficial for raising a generation of conscientious taxpayers. While young children may lack the cognitive ability to fully grasp the tax system, the stage of formal operations, typically achieved in early adolescence, allows young people to understand the essence of the State’s budget and common goods, which form the basis of all tax systems (Furnham and Rawles, 2004). Paradoxically, there is limited research on adolescents and taxes (Furnham and Rawles, 2004; Furnham, 2005).
Sociodemographic Characteristics and Attitudes toward Taxes
Attitudes are learned and shaped by experience and knowledge (Lewis, 1982), making sociodemographic characteristics important as they provide different contexts for shaping attitudes. Hofmann and colleagues (2017) conducted a meta-analysis to investigate tax compliance variation across sociodemographic categories. They found a small but significant correlation between tax compliance and age, sex, education, and income. However, it is worth noting that most studies included in the meta-analysis were conducted with adult samples, with none analyzing sociodemographic differences in tax compliance among adolescents. Furthermore, tax compliance is regarded as only one aspect of attitudes toward taxes, which is not synonymous with the attitudes themselves. Based on a broader scope of research, primarily focusing on financial knowledge and attitudes toward finances, we conclude that age, gender, parental education, and the place of residence can be related to attitudes toward taxes in adolescents (Devos, 2005; Braithwaite et al., 2006; Fallan, 1999; Drever et al., 2015; Grohmann et al., 2015; Kasper et al., 2015).
Age. While knowledge about taxes tends to increase with age (Furnham, 2005; Braithwaite et al., 2006), attitudes do not necessarily become more positive. Previous research yields somewhat inconsistent results. Firstly, it is widely accepted that young children are inclined to follow rules (Helwig and Turiel, 2002), suggesting that they may have more positive attitudes toward taxes than adolescents. Conversely, adolescents typically reject authority, resist the universally accepted rules, and demonstrate a higher inclination to take risks (Kirchler, 1999; Ciupek, 2015), potentially leading to more negative attitudes toward taxation compared to young(er) children. However, findings suggest that older adults exhibit more positive attitudes toward taxes compared to younger ones (Devos, 2005; Braithwaite et al., 2006). Therefore, it seems that attitudes toward taxes could shift from more negative to more positive as individuals age. However, since there are no developmental studies on adolescent attitudes toward taxation, it remains unclear if this shift occurs in late adolescence or only in adulthood.
Gender. Gender can influence attitudes toward taxes in several ways. Firstly, men are often stereotypically associated with opposition to taxation, while women are perceived as supporting redistribution, with men seen as striving to reach their own goals in comparison to women who are seen as caring about the community (Devos, 2005). Secondly, there is extensive evidence that women are generally more risk-averse compared to men (Crosetto et al., 2015), potentially explaining why women are less likely to engage in illegal tax evasion (Olivola and Sussman, 2015). Female students exhibit stricter attitudes toward other people’s tax evasion compared to male students, although no differences were found regarding their own tax evasion or perceptions of the fairness of the tax system (Fallan, 1999). However, due to the limited research on adolescents’ attitudes toward taxes, it remains unclear if girls hold more positive attitudes toward taxes and are more inclined to pay taxes in the future compared to boys.
Parents’ level of education. Parental economic socialization is a key factor in shaping financial knowledge, attitudes, and behaviors in adolescents and young adults (Danes, 1994; Lee and Mortimer, 2009; Van Campenhout, 2015; Drever et al., 2015; Grohmann et al., 2015; Li et al., 2021). A higher paternal (both maternal and fraternal) education level is associated with better economic socialization within the family (Ashby et al., 2011; Webley and Nyhus, 2013). Although there are studies indicating that a higher education level is linked to better tax compliance (Hofmann et al., 2017; Rodrigues-Justicia and Theilen, 2018), these findings apply exclusively to adults and do not elucidate whether higher parental education is associated with more positive attitudes toward taxes in their children.
Place of residence. While direct evidence on the relationship between attitudes toward taxes and the place of residence is lacking, tax compliance can be viewed as a means of supporting the community to which an individual belongs. Thus, a greater psychological sense of community might predict more positive attitudes toward taxes and a greater inclination to adhere to tax-paying norms (Trudinger and Hildebrandt, 2012). Stronger senses of community are often observed among residents of rural areas compared to those in larger cities, possibly due to the smaller size of rural communities fostering stronger feelings of belonging and interdependence (Obst et al., 2002). Consequently, more positive attitudes toward taxes among residents of rural areas could be expected.
In summary, while research has explored the importance of various sociodemographic characteristics for people’s attitudes toward taxes, such investigations have been exclusively conducted in adult samples. There is a significant lack of research on adolescents’ attitudes toward taxes even despite the fact that adolescents should be a key target group for shaping the societal tax perceptions and fostering long-term tax compliance.
Methodology
Participants
The study included 1246 adolescents aged 11 to 18 (Mean = 14.30, SD = 1.98). 57 percent of the participants were female, compared to 48.81 percent of females in the general Lithuanian population of adolescents aged 10–19 years (Official Statistics Portal, 2022). 57.1 percent of the participants lived in cities, compared to 69.07 percent of the Lithuanian population residing in urban areas (Official Statistics Portal, 2022). 51.6 percent of the mothers and 38.6 percent of the fathers of the participating adolescents reported having university education. Detailed sociodemographic characteristics of the study sample are provided in Table 1.
Table 1. Sociodemographic characteristics of the participants
|
Sociodemographic |
Characteristics |
(N = 1246) |
|
Child’s age |
||
|
11–12 years |
25.0% (N = 311) |
|
|
13–14 years |
24.1% (N = 301) |
|
|
15–16 years |
38.8% (N = 484) |
|
|
17–18 years |
11.7% (N = 146) |
|
|
Not specified |
0.3% (N = 4) |
|
|
Gender |
||
|
Female |
57.0% (N =710) |
|
|
Male |
43.0% (N = 536) |
|
|
Place of residence |
||
|
Cities |
57.1% (N = 712) |
|
|
Towns and rural areas |
42.9% (N = 534) |
|
|
Maternal education |
||
|
Secondary education |
18.1% (N = 225) |
|
|
Vocational/some college |
15.4% (N = 192) |
|
|
University education |
51.0% (N = 636) |
|
|
Not specified |
15.5% (N = 193) |
|
|
Paternal education |
||
|
Secondary education |
20.8% (N = 259) |
|
|
Vocational/some college |
17.8% (N = 222) |
|
|
University education |
38.4% (N = 478) |
|
|
Not specified |
23.0% (N = 287) |
Instrument and its construction
Scale of Adolescents’ Attitudes towards Taxes. The scale has been created by the authors of this research. The steps of scale development are as follows:
1. Based on a theoretical review of literature and previous tax questionnaires for youngsters (Furnham, 2005) and adults (Kirchler, 1999; Fallan, 1999; Randlane, 2012), we developed a list of 11 open-ended questions. For example, “What do you think about taxes?” and “Is it fair to give away a part of the salary as taxes?”. Both behavioral and cognitive-affective aspects of attitudes were included in the list. These questions were presented to two groups of adolescents: one consisting of 12- to 13-year-olds, and the other made up of 16- to 17-year-olds. The questions were posed to the entire group, and discussions were encouraged. During this phase, we aimed to understand what concepts related to taxes adolescents comprehend and use in their conversations. After analyzing the content of the discussions, we transformed the questions into statements, specified some aspects concerning taxes, and simplified some formulations. For instance, the question “What do you think about taxes” was divided into three statements: (1) “The taxation system in Lithuania is fair”; (2) “People contribute to the welfare of the State by paying taxes”; and (3) “The taxes paid by people are being used fairly”. In total, 19 statements were generated. The evaluation of the statements was based on a seven-point Likert scale, where ‘1’ means “strongly disagree”, and ‘7’ means “strongly agree”.
2. The initial questionnaire (the first version) was presented to a sample of college undergraduates (N = 93), and exploratory factor analysis was carried out to empirically derive its internal structure. Principal component analysis with Varimax rotation revealed 7 factors with eigenvalues greater than one, explaining 69.39 percent of the data variance. When analyzing the factor weights of the items, we assigned a certain statement to a specific factor when its factor weight was greater than 0.4. The seventh factor comprised only one item (“Tax evasion is a great way to save money”), which was removed, and factor analysis was rerun without this specific statement. Repeated factor analysis revealed 6 factors, of which, the fifth and sixth each comprised one statement (“Usually people willingly pay taxes”; “People who manage to evade taxes are smart”), leading to their exclusion. Exploratory factor analysis was then conducted with the remaining 16 items, identifying five factors with eigenvalues greater than one, explaining 63.65 percent of the data variance: Perceived fairness of taxation, Perceived inevitability of tax paying, Readiness to report tax evasion, Readiness to pay taxes, and Clarity of the taxation system.
3. Further, the resulting list of 16 statements was presented to a small pilot sample of adolescents (N = 49), followed by the elimination of two statements comprising the “Clarity of taxation system” factor. These were the questions that adolescents found hard to answer due to their limited knowledge about the tax situation in Lithuania (resulting in 19.1% and 23.4% missing responses, respectively). This resulted in the final version of the questionnaire consisting of 14 statements (second version).
4. The second version of the questionnaire on attitudes toward taxes was presented to the main sample of this research (N = 1246), and item analysis was carried out to check for item quality. Two statements, specifically, Taxes should be lower in Lithuania and Most Lithuanian people pay taxes honestly, demonstrated low discriminative power and low corrected item-scale correlations (for the complete results of the item analysis, see Table 2). Consequently, they were removed from the scale. Thus, 12 statements (with two of them being reverse-coded) were left in the final version of the instrument. The statements represented four scales: Perceived fairness of taxation (e.g., “Taxes that people pay are being used fairly”, 4 statements in total), Perceived inevitability of tax paying (e.g., “All people who have a job must pay taxes”, 4 statements in total), Readiness to report tax evasion (e.g., “If you find out that your friend or relative is avoiding paying tax, you should report to authorities”, 2 statements in total), and Readiness to pay taxes (e.g., “When I have to pay taxes, I will do so honestly”, 2 statements in total).
5. To confirm the intended four-factor structure of the Scale of Adolescents’ Attitudes toward Taxes, confirmatory factor analysis was carried out. The results of the analysis are presented in Table 2. In line with the current practice, several criteria were used to assess the fit of the data to the model, namely, the χ2 statistic, the root mean square error of approximation (RMSEA), and the comparative fit index (CFI). It should be noted that the χ2 statistic is overly sensitive to model misspecification when sample sizes are large, or the observed variables are not normally distributed. RMSEA gives a measure of the discrepancy in fit per degrees of freedom, with values lower than 0.05 indicating a good fit. The CFI values are restricted to distribution within the 0–1 continuum, with higher values indicating a better fit (Bentler, 1990). Model fit indices show good fit of the four-factor model. Regression weights presented in Table 3 indicate that all items load on the intended factors. Correlations between the subscales are moderate, thus showing that they represent related constructs, and that the calculation of the general attitude score is valid.
Table 2. Item analysis of second version of the developed Scale of Adolescents’ Attitudes towards Taxes (N = 1246)
|
SCALE |
Original item |
Translation to |
M |
SD |
Frequencies |
Item-total |
α if item deleted |
D.P. |
|||||||
|
1 |
2 |
3 |
4 |
5 |
6 |
7 |
missing |
||||||||
|
Perceived fairness of taxation Cronbach |
„Tai. kad dalį uždirbtų pinigų reikia atiduoti valstybei, yra teisinga“ |
“It is fair that people have to give part of their earned money to the State” |
4.74 |
1.62 |
4.0 |
5.9 |
10.7 |
15.9 |
28.3 |
19.1 |
14.5 |
1.8 |
0.48 |
0.68 |
2.67 |
|
„Lietuvos mokesčių sistema yra teisinga“ |
“Lithuanian taxation system is fair” |
3.78 |
1.57 |
9.2 |
12.1 |
15.8 |
29.7 |
18.0 |
8.9 |
4.1 |
2.1 |
0.57 |
0.64 |
2.88 |
|
|
„Žmonių sumokėti mokesčiai panaudojami teisingai“ |
“Taxes that people pay are being used fairly” |
4.10 |
1.54 |
6.0 |
10.4 |
15.4 |
24.9 |
23.5 |
12.1 |
5.4 |
2.3 |
0.56 |
0.64 |
2.74 |
|
|
„Žmonės, mokėdami mokesčius, prisideda prie valstybės gerovės kūrimo“ |
“People contribute to the welfare of the State by paying taxes” |
5.52 |
1.36 |
1.6 |
1.4 |
4.4 |
12.4 |
23.4 |
26.6 |
27.9 |
2.2 |
0.51 |
0.67 |
2.17 |
|
|
Mokesčiai Lietuvoje turėtų būti mažesni* |
“Taxes should be lower in Lithuania”* |
5.91 |
1.30 |
0.6 |
0.9 |
2.0 |
14.2 |
15.6 |
16.9 |
47.5 |
2.4 |
0.30 |
0.74 |
1.70 |
|
|
Perceived inevitability of taxes Cronbach |
„Dauguma Lietuvos žmonių moka mokesčius sąžiningai“ |
“Most Lithuanian people pay taxes honestly” |
4.41 |
1.51 |
3.6 |
6.3 |
14.4 |
24.6 |
23.4 |
18.8 |
6.6 |
2.2 |
0.11 |
0.65 |
1.27 |
|
„Kiekvienas žmogus turi turėti teisę pasirinkti – mokėti mokesčius. ar ne“* |
“Everybody should have the right to choose whether to pay taxes or not”* |
2.87 |
1.95 |
34.7 |
18.0 |
12.1 |
13.0 |
8.3 |
2.8 |
9.3 |
1.9 |
0.32 |
0.57 |
2.92 |
|
|
„Mokesčius mokėti privalu kiekvienam“ |
“Everybody must pay taxes” |
5.33 |
1.60 |
2.5 |
2.6 |
7.0 |
13.2 |
22.2 |
20.2 |
30.1 |
2.2 |
0.46 |
0.48 |
2.38 |
|
|
„Turėtų būti baudžiama už vengimą mokėti mokesčius“ |
“People who avoid paying taxes should be punished” |
5.33 |
1.56 |
3.2 |
2.8 |
4.8 |
15.3 |
22.5 |
19.1 |
29.9 |
2.4 |
0.42 |
0.50 |
2.35 |
|
|
„Visi dirbantys žmonės turi mokėti mokesčius“ |
“All people who have a job must pay taxes” |
5.50 |
1.49 |
2.0 |
2.7 |
5.9 |
10.0 |
23.7 |
20.6 |
33.3 |
1.7 |
0.50 |
0.47 |
2.34 |
|
|
Readiness to pay taxes Cronbach |
„Kai man reikės mokėti mokesčius, aš tai darysiu sąžiningai“ |
“When I have to pay taxes, I will do so honestly” |
6.27 |
1.10 |
0.6 |
0.4 |
0.9 |
7.1 |
9.7 |
21.2 |
57.3 |
2.8 |
0.44 |
- |
2.03 |
|
„Jeigu sužinočiau. kaip galima išvengti mokesčių, taip ir daryčiau“* |
“If I knew how to avoid paying taxes, I would do so”* |
2.76 |
1.80 |
33.9 |
18.7 |
10.0 |
17.8 |
83 |
4.3 |
4.4 |
2.7 |
0.44 |
- |
4.18 |
|
|
Readiness to report tax evasion Cronbach |
„Sužinojus. kad koks nors asmuo vengia mokėti mokesčius, reikėtų pranešti atsakingoms institucijoms“ |
“If you find out that some person is avoiding paying tax, you should report to the relevant authorities” |
5.02 |
1.72 |
0.7 |
5.3 |
3.4 |
4.1 |
22.9 |
18.1 |
24.9 |
2.6 |
0.65 |
- |
3.69 |
|
„Sužinojus, kad tavo draugas (-ė) / artimasis (-oji) vengia mokėti mokesčiu, reikėtų pranešti atsakingoms institucijoms“ |
“If you find out that your friend or relative is avoiding paying tax, you should report to the relevant authorities” |
1.03 |
12.1 |
8.1 |
8.3 |
27.7 |
19.1 |
12.5 |
10.0 |
2.3 |
0.65 |
- |
4.27 |
||
Item-total: corrected Item-total correlation; α if item deleted – Cronbach α if item deleted; D.P. – discriminated power of the item, based on top and bottom 27 percent of the variance; * Reverse-coded items
Table 3. Results of Confirmatory factor analysis (N = 1246)
|
Standardized regression weights |
||||
|
Fairness |
Inevitability |
Readiness |
Readiness |
|
|
It is fair that one has to give part of their earned money to the State |
0.615 |
|||
|
The taxation system in Lithuania is fair |
0.555 |
|||
|
People contribute to the welfare of the state by paying taxes |
0.690 |
|||
|
Taxes that people pay are being used fairly |
0.566 |
|||
|
All the people who have a job must pay taxes |
0.678 |
|||
|
Everybody should have the right to choose whether to pay taxes or not |
-0.395 |
|||
|
Everybody must pay taxes |
0.594 |
|||
|
People who avoid paying taxes should be punished |
0.573 |
|||
|
If you find out that your friend or relative is avoiding paying tax, you should report to the relevant authorities |
0.814 |
|||
|
If you find out that some person is avoiding paying tax, you should report to the relevant authorities |
0.778 |
|||
|
When I have to pay taxes, I will do so honestly |
0.759 |
|||
|
If I knew how to avoid paying taxes, I would do so |
-0.574 |
|||
|
Correlations between scales |
||||
|
Perceived fairness of taxation |
0.334** |
0.364** |
0.347** |
|
|
Perceived inevitability of tax paying |
0.37** |
0.356** |
||
|
Readiness to report tax evasion |
0.415** |
|||
|
Model fit |
||||
|
Χ2 = 233.655, df = 46, p < 0.001 |
||||
|
CFI = 0.953 |
||||
|
RMSAE = 0.057 |
||||
Note. ** p<0.001
To assess the reliability of the scale by means of internal consistency, Cronbach alphas were calculated for each of the four subscales and for the entire scale. The data presented in Table 4 shows that internal consistency of the entire scale is solid, while the internal consistency of separate subscales ranges from poor (“Readiness to pay taxes”) to acceptable (“Perceived fairness of taxes” and “Readiness to report tax evasion”).
Table 4. Internal consistency and mean scores of the Attitude toward taxes subscales
|
Cronbach alfa |
Mean |
SD |
|
|
Attitude toward taxes |
0.812 |
19.29 |
3.54 |
|
Perceived fairness of taxes |
0.736 |
4.05 |
1.01 |
|
Perceived inevitability of taxes |
0.649 |
5.33 |
1.15 |
|
Readiness to report tax evasion |
0.790 |
4.61 |
1.56 |
|
Readiness to pay taxes |
0.560 |
5.3 |
1.04 |
Sociodemographic information. Children were asked to report their age and gender. Parents of the participating children provided information on father’s and mother’s education
Data collection and sampling procedures
This research constitutes a component of a broader national study investigating children’s and adolescents’ knowledge and attitudes toward taxes in Lithuania. All the participants were recruited through their respective schools. A non-random convenience sampling method was employed in this study. Schools from Vilnius and its surrounding District Municipalities were invited to participate. Ultimately, eight schools from Vilnius and six schools from other towns and rural areas (e.g., Alytus, Kaišiadorys, etc.) agreed to take part.
To ensure representativeness within each participating institution, the participating classes were selected randomly. Depending on the school’s size, between one and four classes were chosen, ranging from 6th to 11th grade (12- to 18-year-olds). In smaller schools, a single class was randomly selected, whereas, in the largest schools, four classes were included. The sampling process aimed to maintain higher distribution of students from Vilnius than other towns and rural areas in order to represent the students’ population of Lithuania. Parents of all children in these classes received forms of informed consent, and only students providing written parental consent were included in the study.
Parents of all involved adolescents with provided informed consent also filled in a form of sociodemographic information. The Scale of Attitudes toward Taxes was administered to the adolescent participants as part of a comprehensive battery of measures. Adolescents completed the scale by using paper and pencil in groups of fewer than twenty individuals, under the supervision of two experimenters. In instances where the groups were smaller (less than 10 participants), only one experimenter was physically present.
Data analysis
SPSS 24.0 software was used for data analysis. The collected data had normal distribution (verified by Shapiro-Wilk test), with Skewness and Kurtosis values between -1 and +1 (Hair et al., 2022), and therefore parametric methods (Pearson correlation coefficient, Independent sample t-test, ANOVA test with post hoc Bonferonni) were used. Cohen’s d was used to indicate the standardized difference between two means: small at 0.2, moderate at 0.5, and large at 0.8 (Cohen, 1988).
Results
Initially, we examined differences in the attitudes toward taxes between boys and girls, as well as between residents of cities and those of smaller towns/rural areas. The results of independent samples t-tests are presented in Table 4. Statistically significant gender differences were observed in two subscales of the questionnaire. Boys demonstrated slightly higher perceived fairness of taxes than girls, but girls proved to be more ready to pay taxes. The latter gender difference was more pronounced, as indicated by Cohen’s d effect size. When comparing attitudes toward taxes between adolescents living in cities and those in towns/rural areas, the only significant difference observed was in readiness to report tax evasion (Table 5). Adolescents residing in towns and rural areas displayed greater readiness to report tax evasion.
Table 5. Attitudes toward taxes and sociodemographic variables
|
Boys (N = 536) |
Girls (N = 710) |
t |
df |
p |
Effect size |
|||
|
M |
SD |
M |
SD |
|||||
|
Attitude toward taxes |
5.01 |
1 |
5.09 |
0.88 |
-1.416 |
1177 |
0.157 |
-0.083 |
|
Perceived fairness of taxes |
4.63 |
1.17 |
4.48 |
1.08 |
2.32 |
1233 |
0.02 |
0.134 |
|
Perceived inevitability of taxes |
5.34 |
1.19 |
5.32 |
1.12 |
0.34 |
1196 |
0.73 |
0.02 |
|
Readiness to report tax evasion |
4.54 |
1.68 |
4.64 |
1.46 |
-1.12 |
1046.55 |
0.259 |
-0.066 |
|
Readiness to pay taxes |
5.54 |
1.3 |
5.89 |
1.15 |
-4.75 |
1016.5 |
<0.001 |
-0.283 |
|
Attitude toward taxes |
5.02 |
0.96 |
5.11 |
0.91 |
1.7 |
1177 |
0.09 |
0.1 |
|
Perceived fairness of taxes |
4.57 |
1.17 |
4.51 |
1.07 |
-0.87 |
1183 |
0.385 |
-0.049 |
|
Perceived inevitability of taxes |
5.32 |
1.18 |
5.34 |
1.12 |
-0.383 |
1196 |
0.702 |
0.022 |
|
Readiness to report tax evasion |
4.46 |
1.57 |
4.79 |
1.54 |
3.61 |
1231 |
<0.001 |
0.207 |
|
Readiness to pay taxes |
5.7 |
1.26 |
5.8 |
1.2 |
1.39 |
1191 |
0.164 |
0.081 |
A correlational analysis was conducted to examine the relationship between attitudes toward taxes and the adolescents’ age, yielding mixed results. The perceived fairness of taxes and readiness to report tax evasion were found to decline with age, while the general attitude toward taxes tended to become more negative. Conversely, the perceived inevitability of taxes increased with age. As shown in Table 6, the relationship between age and attitudes toward taxes was weak. One potential explanation for this could be a nonlinear relationship between the adolescents’ age and their attitude toward taxes. To account for possible nonlinear changes throughout adolescence, a one-way analysis of variance (ANOVA) was performed to assess differences in the general score of attitudes toward taxes among four age groups (11 to 12; 13 to 14; 15 to 16; and 17 to 18). ANOVA yielded significance at the 0.05 level, F = 7.24, df = 3, p < 0.01. A post hoc Bonferroni test revealed that the group of 11- to 12-year-olds differed significantly from the age groups of 13–14 and 15–16 (p < 0.05), while there was no significant difference compared to 17–18-year-olds. Conversely, the remaining three groups, comprising older adolescents, did not exhibit significant differences from each other (Table 6).
Table 6. Multiple comparisons of age groups in attitudes toward taxes (post hoc Bonferroni test)
|
(I) Age group |
(J) Age group |
Mean dif (I-J) |
SE |
p |
|
11–12 years |
13–14 years |
0.237 |
0.078 |
0.015 |
|
15–16 years |
0.317 |
0.069 |
<0.001 |
|
|
17–18 years |
0.169 |
0.095 |
0.459 |
|
|
13–14 years |
15–16 years |
0.08 |
0.071 |
1 |
|
17–18 years |
-0.067 |
0.097 |
1 |
|
|
15–16 years |
17–18 years |
-0.147 |
0.09 |
0.607 |
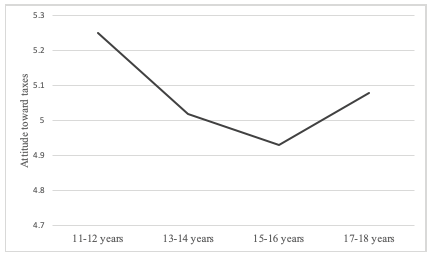
Figure 1. Attitudes toward taxes depending on the age of respondents
Table 7. Correlations between Attitudes toward taxes and sociodemographic characteristics
|
Age |
Maternal |
Paternal |
|
|
Attitude toward taxes |
-0.098** |
0.039 |
0.061 |
|
Perceived fairness of taxes |
-0.127** |
0.053 |
0.083* |
|
Perceived inevitability of taxes |
0.093** |
0.048 |
0.085** |
|
Readiness to report tax evasion |
-0.176** |
-0.025 |
-0.015 |
|
Readiness to pay taxes |
-0.033 |
0.055 |
0.047 |
Note. ** p<0.001; * p<0.05
Finally, we analyzed the relationships between the adolescents’ attitudes toward taxes and the educational level of their parents. Only few weak correlations between paternal, but not maternal education and dimensions of attitudes toward taxes (perceived fairness of taxes and inevitability of taxes) have been detected (Table 7).
Discussion
To explore adolescents’ attitudes toward taxes, we developed a questionnaire consisting of four scales: Perceived fairness of taxes, Perceived inevitability of taxes, Readiness to pay taxes, and Readiness to report tax evasion. This instrument accounts for the multidimensionality of attitudes toward taxes and, to the best of our knowledge, it is the first attempt to introduce a reliable, easy-to-use tool assessing both behavioral and cognitive-affective aspects of attitudes toward taxes throughout adolescence (from 11 to 18 years).
The primary objective of this study was to explore sociodemographic characteristics associated with adolescents’ attitudes toward taxes. Some gender differences in attitudes were anticipated, as previous research suggests that males are usually more associated with the topic of taxes than females (Olivola and Sussman, 2015). Conversely, females are often more inclined to adhere to rules and social norms, making them less likely to illegally evade taxes (Devos, 2005; Olivola and Sussman, 2015) and leading to stricter attitudes toward other people’s tax evasion (Fallan, 1999). While our research found no gender differences in the general attitude toward taxes, boys tended to perceive taxes as fairer than girls. Conversely, girls demonstrated higher readiness to pay taxes in the future. These results partially replicate previous findings, indicating that while the general attitudes toward taxes are similar between sexes, the components of attitudes differ slightly. Boys tend to have more positive cognitive-affective components of attitudes (“Taxes are fair”) compared to girls, whereas girls exhibit more positive behavioral components (“I will pay taxes in the future”). Our research indicates that some differences between sexes in behavioral and cognitive-affective components of attitudes become evident in adolescence.
A weak but significant negative correlation was found between the general attitudes toward taxes and the age of adolescents. This study fills an important gap in previous research by examining attitudes toward taxes across different developmental stages, specifically, adolescence. The tendency to view taxes more positively with an increasing age, observed in samples of adults (Kirchler, 1999; Devos, 2005), does not directly apply to adolescence. In our adolescent sample, the perceived fairness of taxes and readiness to report tax evasion declined with age, while the perception of inevitability of taxes increased. The readiness to pay taxes, however, was not related to age. The perceived inevitability of taxes reflects greater knowledge about taxes acquired through formal and informal education. However, better knowledge and a greater realization that taxes are inevitable do not necessarily lead to perceiving taxes as fair and paying taxes honestly. The tendency to view taxes as less fair with age may be explained by the prevalence of negative messages about taxes in the media (Chen et al., 2018) and an increasing resistance to authorities and rules during adolescence (Helwig and Turiel, 2002). Similarly, declining readiness to report tax evasion could be explained by the norms adolescents adhere to, including avoidance to report misconduct of others (Clayman and Skinns, 2011).
Research indicates that developmental trends are often non-linear (Shadidi, 2013). Adherence to negative peer norms, rejection of authorities and rules, as well as greater risk preference are more expressed in the middle adolescence (Willoughby et al., 2014); therefore, nonlinear relation could explain relatively weak correlations between aspects of the attitudes towards taxes and the age found in this study. Our results suggest that 11–12-year-olds have more positive attitudes than 13–14- and 15–16-year-olds, but not 17–18-year-olds. Additionally, a slight trend toward more positive attitudes can be observed in 17–18-year-old adolescents. As previously noted, research with adult samples indicates a positive correlation between the age and attitudes toward taxes (Devos, 2005; Braithwaite et al., 2006). Therefore, further longitudinal research is needed to determine if late adolescence could be considered a turning point where attitudes toward taxes begin to improve. Nevertheless, this research provides insight into the dynamics of attitudes toward taxes before reaching adulthood demonstrating that attitudes toward taxes are not rigid and are subject to change during adolescence. This invites policy makers to consider attitudes when planning tax-related interventions aimed at young people.
Parental education emerged as another sociodemographic characteristic that we examined for its possible relation to adolescents’ attitudes toward taxes. Such a relationship is expected as parents with higher education tend to have better knowledge and attitudes toward taxes themselves and can provide better economic socialization in the family (Ashby et al., 2011); besides, better-educated adults are more tax compliant (Hofmann et al., 2017, Rodrigues-Justicia and Theilen, 2018). However, our results showed weak correlations between the father’s education and two dimensions of attitudes toward taxes (Perceived fairness and Perceived inevitability of taxes), with the general attitudes toward taxes showing no relations with either parent’s education level. This suggests that parents’ education is not a major factor determining the effectiveness of tax socialization in the family. This calls for further exploration of factors contributing to tax socialization in the family, such as the extent to which parents discuss taxes and finances in general and involve children in financial decisions.
Finally, our data suggests that adolescents living in towns and rural areas tend to be more ready to report tax evasion compared to adolescents living in cities. One possible explanation is the stronger sense of community observed among residents of smaller geographical communities (Obst et al., 2002), which is related to greater tax morale (Trudinger and Hildebrandt, 2012). Taxes can be seen as a way of supporting the community to which the individual feels they belong, making residents of small towns and rural areas less tolerant of tax evasion by others. However, this interpretation should be approached cautiously, and the sense of community should be included in future research as a possible mediating factor between attitudes toward taxes and the place of residence.
This study substantially contributes to the current understanding of factors related to attitudes toward taxes by examining a previously neglected group of adolescents. While our study found some significant relationships between various sociodemographic factors and aspects of attitudes toward taxes, these relationships were relatively weak. This suggests that additional variables explaining attitudes toward taxes in adolescents exist, which should be considered in future research, such as economic knowledge and various aspects of socioeconomic socialization.
The Scale of Adolescents’ Attitudes toward Taxes, developed for this study, holds significant potential as a valuable tool for both researchers and financial planners. It aids in estimating attitudes toward taxes and evaluating the relationships between attitudes, knowledge about taxes, and tax-paying behaviors. In tax education, preexisting attitudes likely play a crucial role in acquiring new knowledge, with negative attitudes potentially hindering the acquisition of new tax-related knowledge, while positive attitudes may facilitate it. Unfortunately, research indicates that while financial education courses are effective in changing financial knowledge, they are less successful in altering attitudes (Johnson et al., 2021). Therefore, educational interventions need to target the attitudes of young people, not just their knowledge. This is especially important for taxes, a topic often subject to negative narratives in society. Thus, an easy-to-use tool for measuring adolescents’ attitudes toward taxes enables educators to better evaluate the effectiveness of tax literacy programs. This evaluation extends beyond assessing mere increases in tax knowledge to include the acquisition of attitudes that promote the beneficial use of this knowledge in society.
Limitations
This study is not without its limitations. First, our sample was a convenience sample rather than a random one, which means that it does not fully represent the entire Lithuanian population. However, the sample’s composition in terms of gender and the place of residence aligns with the demographic distribution of adolescents of this age in Lithuania. Therefore, our results could be considered as ones reflecting Lithuanian adolescents’ attitudes toward taxes. It is worth noting that our sample largely comprises only Caucasians, and therefore caution should be exercised when generalizing the results to more diverse societies.
Second, the issue is that not all surveyed adolescents fully understood what taxes are. Assessing tax knowledge was a separate topic within this project, and it is not discussed in this article. When asked what taxes are, 14.9% of 12–13-year-olds and 5.7% of 16–17-year-olds provided entirely incorrect answers. However, research suggests that knowledge about an object is not a prerequisite for forming attitudes toward it (Zajonc, 1980). Even if adolescents do not fully understand what taxes are, they have likely heard the term before and may still hold certain attitudes toward them.
Furthermore, the socioeconomic history of Lithuania must be considered when interpreting the findings. For nearly half a century, Lithuania was part of the Soviet Union which was following the principles of a social market economy. Although a taxation system did exist there, it differed significantly from that of a free-market economy, and it was not openly discussed. This historical context may partly explain why the tax morale of Lithuanian citizens has been assessed as the lowest in the European Union (Olsen et al., 2018). Although the adolescents involved in this study were born in the Independent Republic of Lithuania and have been raised in a free-market environment, their parents’ attitudes were largely shaped by the socialist ideology. Therefore, the results of the study may not directly apply to countries with a longer history of a free market economy.
Conclusions
1. Although no statistically significant difference was found in the overall attitude toward taxes between boys and girls, girls were significantly more likely to report tax evasion and perceive taxes as less fair.
2. Although no statistically significant difference was found in the overall attitude toward taxes between adolescents living in rural and urban areas, those living in rural areas were significantly more likely to report tax evasion.
3. While a negative correlation between age and attitudes toward taxes was observed, this relationship is not linear. Adolescents’ attitudes toward taxes tend to become more negative between the ages of 11–12 and 15–16 but show a slight improvement at an older age.
4. Adolescents’ attitudes toward taxes are not significantly related to their mother’s level of education. However, certain aspects of their tax-related attitudes are significantly and positively associated with their father’s level of education.
References
Ajzen, I. (1991). The theory of planned behavior. Organizational behavior and human decision processes, 50(2), 179-211. https://doi.org/10.1016/0749-5978(91)90020-T
Ashby, J. S., Schoon, I., & Webley, P. (2011). Save now, save later? European psychologist, 16(3), 227-237. https://doi.org/10.1027/1016-9040/a000067
Bentler, P. M. (1990). Comparative fit indexes in structural models. Psychological bulletin, 107(2), 238. https://doi.org/10.1037/0033-2909.107.2.238
Chen, S., Schuchard, K., & Stomberg, B. (2019). Media coverage of corporate taxes. The Accounting Review, 94(5), 83-116. https://doi.org/10.2308/accr-52342
Clayman, S., & Skinns, L. (2012). To snitch or not to snitch? An exploratory study of the factors influencing whether young people actively cooperate with the police. Policing and society, 22(4), 460-480. https://doi.org/10.1080/10439463.2011.641550
Cohen, J. (1988). Statistical power analysis for the behavioral sciences, 2nd ed. Hillsdale, NJ: Erlbaum.
Crosetto, P., Filippin, A., & Heider, J. (2015). A study of outcome reporting bias using gender differences in risk attitudes. CESifo Economic Studies, 61(1), 239-262. https://doi.org/10.1093/cesifo/ifu029
Danes, S. M. (1994). Parental perceptions of children’s financial socialization. Financial Counseling and Planning, 5(1), 127-149.
Dell’Anno, R. (2009). Tax evasion, tax morale and policy maker’s effectiveness. The Journal of Socio-Economics, 38(6), 988-997. https://doi.org/10.1016/j.socec.2009.06.005
Devos, K. (2005). The attitudes of tertiary students on tax evasion and the penalties for tax evasion: A pilot study and demographic analysis. eJTR, 3, 222.
Drever, A. I., Odders‐White, E., Kalish, C. W., Else‐Quest, N. M., Hoagland, E. M., & Nelms, E. N. (2015). Foundations of financial well‐being: Insights into the role of executive function, financial socialization, and experience‐based learning in childhood and youth. Journal of Consumer Affairs, 49(1), 13-38. https://doi.org/10.1111/joca.12068
Eriksen, K., & Fallan, L. (1996). Tax knowledge and attitudes towards taxation: A report on a quasi-experiment. Journal of Economic Psychology, 17(3), 387-402. https://doi.org/10.1016/0167-4870(96)00015-3
Poniatowski, G., Bonch-Osmolovskiy, M., Śmietanka, A. (2021) VAT gap in the EU : report 2021, European Commission, Directorate-General for Taxation and Customs Union, Publications Office. https://data.europa.eu/doi/10.2778/447556
Fallan, L. (1999). Gender, exposure to tax knowledge, and attitudes towards taxation: An experimental approach. Journal of Business Ethics, 18(2), 173-184. https://doi.org/10.1023/A:1005711905297
Fernandes, D., Lynch, Jr, J. G., & Netemeyer, R. G. (2014). Financial literacy, financial education, and downstream financial behaviors. Management Science, 60(8), 1861-1883. https://doi.org/10.1287/mnsc.2013.1849
Furnham, A., & Rawles, R. (2004). Young people’s ignorance about the topic of taxation. Citizenship, Social and Economics Education, 6(1), 12-23. https://doi.org/10.2304/csee.2004.6.1.
Furnham, A. (2005). Understanding the meaning of tax: Young peoples’ knowledge of the principles of taxation. The Journal of Socio-Economics, 34(5), 703-713. https://doi.org/10.1016/j.socec.2005.07.014
Grohmann, A., Kouwenberg, R., & Menkhoff, L. (2015). Childhood roots of financial literacy. Journal of Economic Psychology, 51, 114-133. https://doi.org/10.1016/j.joep.2015.09.002
Hair, J. F., Hult, G. T. M., Ringle, C. M., & Sarstedt, M. (2022). A Primer on Partial Least Squares Structural Equation Modeling (PLS-SEM) (3 ed.). Thousand Oaks, CA: Sage.
Helwig, C. C., & Turiel, E. (2002). Ed. Children’s social and moral reasoning. In P. K. Smith & C. H. Hart (Eds.) Blackwell handbook of childhood social development, (pp. 476-490). Blackewell publisher.
Hofmann, E., Voracek, M., Bock, C., & Kirchler, E. (2017). Tax compliance across sociodemographic categories: Meta-analyses of survey studies in 111 countries. Journal of Economic Psychology, 62, 63-71. https://doi.org/10.1016/j.joep.2017.06.005
Holbrook, T. M., & Heideman, A. J. (2022). Straight to the (Revenue) Source: Contextual and Individual-Level Determinants of Attitudes Toward Local Taxes. American Politics Research, 50(2), 157-172. https://doi.org/10.1177/1532673X211063212
Johnson, J., Spraggon, D., Stevenson, G., Levine, E., & Mancari, G. (2021). Impact of the FutureSmart Online Financial Education Course on Financial Knowledge of Middle School Students. Journal of Financial Counseling and Planning, 32 (3). https://doi.org/10.1891/JFCP-19-00061
Kasper, M., Kogler, C., & Kirchler, E. (2015). Tax policy and the news: An empirical analysis of taxpayers’ perceptions of tax-related media coverage and its impact on tax compliance. Journal of Behavioral and Experimental Economics, 54, 58-63. https://doi.org/10.1016/j.socec.2014.11.001
Kirchler, E. (1999). Reactance to taxation: Employers’ attitudes towards taxes. The Journal of Socio-Economics, 28(2), 131-138. https://doi.org/10.1016/S1053-5357(99)00003-7
Lee, J., & Mortimer, J. (2009). Family socialization, economic self-efficacy, and the attainment of financial independence in early adulthood. Longitudinal and life course studies, 1 (1), 45–62. https://doi.org/10.14301/LLCS.V1I1.28
Lewis, A. (1982) The Psychology of Taxation. British Journal of Social Psychology, 21 (2), 151–158. https://doi.org/10.1111/j.2044-8309.1982.tb00523.x
Li, Y., Zuiker, V. S., Mendenhall, T. J., & Montalto, C. P. (2021). Parental Financial Socialization, Financial Experiences, and Financial Behaviors: Comparing Asian American and International Asian College Students. Journal of Financial Counseling and Planning, 32(1), 68-85. https://doi.org/10.1891/JFCP-19-00008
Moschis, G. P. (1985). The role of family communication in consumer socialization of children and adolescents. Journal of Consumer Research, 11(4), 898-913. https://doi.org/10.1086/209025
Obst, P., Smith, S. G., & Zinkiewicz, L. (2002). An exploration of sense of community. Part 3: Dimensions and predictors of psychological sense of community in geographical communities. Journal of Community Psychology, 30(1), 119-133. https://doi.org/10.1002/jcop.1054
Official Statistics Portal (2022) https://osp.stat.gov.lt/pradinis
Olivola, C. Y., & Sussman, A. B. (2015). Taxes and consumer behavior. In M. I. Norton, D. D. Rucker, & C. Lamberton (Eds.), The Cambridge handbook of consumer psychology (pp. 564–588). Cambridge University Press.
Olsen, J., Kang, M., & Kirchler, E. (2018). Tax Psychology. In A. Lewis (Ed.), The Cambridge Handbook of Psychology and Economic Behaviour (pp. 405-429). Cambridge: Cambridge University Press.
Pampel, F., Andrighetto, G., Steinmo, S. (2019) How Institutions and Attitudes Shape Tax Compliance: a Cross-National Experiment and Survey, Social Forces, 97 (3), 1337–1364. https://doi.org/10.1093/sf/soy083
Poniatowski, G., Bonch-Osmolovskiy, M., Śmietanka, A. (2021) VAT gap in the EU : report 2021, European Commission, Directorate-General for Taxation and Customs Union, Publications Office, https://data.europa.eu/doi/10.2778/447556
Rachmawan, R., Sübekti, I., & Adib, N. (2020). The effect of tax knowledge on relationship of procedural justice perception towards voluntary tax compliance mediated by trust. International Journal of Research in Business and Social Science, 9(4), 207-213. https://doi.org/10.20525/ijrbs.v9i4.725
Randlane, K. (2012). Tax compliance and tax attitudes: The case of Estonia. Journal of Management & Change, 29(1).
Rodriguez-Justicia, D., & Theilen, B. (2018). Education and tax morale. Journal of Economic Psychology, 64, 18-48. https://doi.org/10.1016/j.joep.2017.10.001
Saad, N. (2014). Tax knowledge, tax complexity and tax compliance: Taxpayers’ view. Procedia-Social and Behavioral Sciences, 109, 1069-1075. https://doi.org/10.1016/j.sbspro.2013.12.590
Shadidi, M. (2013). Developmental linear and non-linear patterns of loneliness: Literature review. The Atlantic Journal of Graduate Studies in Education, 1-15.
Sussman, A. B., & White, S. M. (2018). Negative responses to taxes: Causes and mitigation. Policy Insights from the Behavioral and Brain Sciences, 5(2), 224-231. https://doi.org/10.1177/2372732218790008
Torgler, B., & Schneider, F. (2007). What shapes attitudes toward paying taxes? Evidence from multicultural European countries. Social Science Quarterly, 88(2), 443-470. https://doi.org/10.1111/j.1540-6237.2007.00466.x
Trüdinger, E. M., & Hildebrandt, A. (2013). Causes and contexts of tax morale: Rational considerations, community orientations, and communist rule. International Political Science Review, 34(2), 191-209. https://doi.org/10.1177/0192512112447117
Van Campenhout, G. (2015). Revaluing the role of parents as financial socialization agents in youth financial literacy programs. Journal of Consumer Affairs, 49(1), 186-222. https://www.jstor.org/stable/43861592
Webley, P., & Nyhus, E. K. (2013). Economic socialization, saving and assets in European young adults. Economics of Education Review, 33, 19-30. https://doi.org/10.1016/j.econedurev.2012.09.001
Willoughby, T., Good, T., Adachi, P. J.C., Hamza, C., Tavernier, R. (2014). Examining the link between adolescent brain development and risk taking from a social–developmental perspective. Brain and Cognition, 89, 70-78. https://doi.org/10.1016/j.bandc.2014.07.006.
Zajonc, R. B. (1980). Feeling and thinking: Preferences need no inferences. American Psychologist, 35(2), 151–175. https://doi.org/10.1037/0003-066X.35.2.151