Ekonomika ISSN 1392-1258 eISSN 2424-6166
2024, vol. 103(4), pp. 129–150 DOI: https://doi.org/10.15388/Ekon.2024.103.4.8
Evans Yeboah
Mendel University in Brno, Czech Republic
Email: Yeboahevans869@gmail.com
ORCID ID: https://orcid.org/0000-0002-0934-3996
Abstract. This study investigates the impact of foreign direct investment (FDI), domestic investment, and trade on economic growth in the Baltic countries (Estonia, Latvia, and Lithuania). Using annual time-series data from the World Bank for the period 1995–2022, the analysis employs the Pooled Mean Group Autoregressive Distributed Lag (PMG-ARDL) approach. To ensure robustness, the study also applies the fully modified ordinary least squares (FMOLS) and dynamic ordinary least squares (DOLS) methods. The findings reveal that FDI negatively impacts economic growth in the long term, although it has a positive effect in the short term. In contrast, gross fixed capital formation (used as a proxy for domestic investment) positively influences economic growth over the long term but has no significant short-term effect. Domestic savings are found to contribute positively to long-term economic growth, while having a negative impact in the short term. Exports exhibit a negative long-term effect on economic growth, despite their positive short-term impact. The robustness checks using FMOLS and DOLS largely confirm the results obtained from the PMG-ARDL model. Additionally, the causality analysis reveals a unidirectional relationship between economic growth, domestic savings, and FDI. These findings emphasize the importance of considering both the short-term and long-term effects of FDI on economic growth. Policymakers in the Baltic countries are advised to adopt strategic investment policies that balance the benefits and challenges of FDI to address its long-term impacts. The practical implications include the need for targeted policies to promote sustainable economic growth by addressing the dynamic interactions between FDI, domestic investment, and trade.
Keywords: FDI, gross fixed capital formation, GDP per capital, Gross domestic savings, Exports, Baltic
________
Received: 16/05/2024. Revised: 17/08/2024. Accepted: 26/10/2024
Copyright © 2024 Evans Yeboah. Published by Vilnius University Press
This is an Open Access article distributed under the terms of the Creative Commons Attribution License, which permits unrestricted use, distribution, and reproduction in any medium, provided the original author and source are credited.
________
Foreign direct investment (FDI), trade, and domestic investment are critical components of economic development and growth, each playing a distinct role in shaping productivity, employment, technological advancement, and overall economic dynamism. These factors collectively influence the growth path of nations and foster interconnectedness in the global economy. FDI involves the transfer of capital, technology, and managerial expertise from one country to another. Unlike passive portfolio investments, which primarily involve purchasing stocks or bonds, FDI usually entails significant ownership stakes that often grant investors control over company operations. FDI typically manifests in the form of greenfield investments, where new operations are established, or through mergers and acquisitions, where existing businesses are purchased (Alfaro et al., 2004; Banday et al., 2021; Sijabat, 2022). Through FDI, foreign firms introduce new technologies, management practices, and advanced production techniques that can boost productivity in the host economy. FDI also acts as a conduit for knowledge transfer, leading to positive spillover effects like skill development, innovation, and improved competitiveness among local industries.
For instance, integrating local suppliers into global value chains can drive industrial upgrading and economic diversification. However, these benefits largely depend on the host country’s absorptive capacity, which includes factors such as education levels, infrastructure, and institutional quality (Borensztein et al.,1998). Domestic investment, especially in sectors that may not immediately attract foreign capital, remains a cornerstone of sustainable economic development. Investment by local firms drives the creation of capital goods, infrastructure, and employment while fostering entrepreneurship and the development of industries crucial to the local economy (OECD, 2014). Investments in physical and human capital are vital for enhancing productivity, stimulating innovation, and strengthening competitiveness (OECD, 2018). In many cases, domestic investment is more diversified and closely aligned with local needs, providing a buffer against external shocks and contributing to economic resilience. Meanwhile, international trade plays a pivotal role in connecting economies by facilitating the exchange of goods, services, and capital across borders (Fakhri et al., 2018; Iorember et al., 2022; Yanbo et al., 2022). Trade enables economies to access a broader range of products, tap into global markets, and capitalize on economies of scale, thereby driving innovation, fostering competition, and raising living standards. The significance of these factors is particularly evident in the Baltic countries, where the transition from planned to market economies and subsequent integration into the global economic environment after the collapse of the Soviet Union highlight their importance (Adina and Dumitru-Cristian, 2013; Yucel, 2014).
The Baltic region stands as a dynamic economic entity marked by a robust interplay between FDI, gross fixed capital formation, and international trade. FDI inflows into the Baltic states have been instrumental in driving economic growth and integration with the global market. FDI has emerged as a crucial source of external financing for these countries, facilitating technological transfers, job creation, and export expansion (Barkauskaite and Naraskeviciute, 2016; UNCTAD, 2020). Since gaining independence in the early 1990s, these countries have actively pursued policies aimed at attracting foreign investors, leveraging their strategic locations, skilled workforces, and business-friendly environments (World Bank, 2019). The World Investment Report indicates a steady increase in FDI inflows to the Baltic region in recent years, with sectors such as manufacturing, services, and information technology being the primary beneficiaries (UNCTAD, 2021). In the Baltic countries, domestic investment is influenced by various factors, including national policies, the availability of financing, and external economic conditions (Eurostat, 2024).
However, within the European Union, the Baltic countries face significant challenges in attracting FDI, gross fixed capital formation, and expanding trade. Compared to larger economies like Germany and France, the Baltic region’s smaller market size, perceived political risks, and less developed infrastructure limit their ability to attract substantial FDI. These constraints result in lower FDI inflows, which in turn restrict resources available for technological advancement and industrial growth. Similarly, limited financial resources, bureaucratic hurdles, and regulatory complexities pose challenges to executing large infrastructure projects, thus curtailing the region's productive capacity. In terms of trade, the Baltic nations face stiff competition from stronger EU economies that wield greater influence in trade negotiations and impose barriers limiting access to global markets. These asymmetric trade relationships, coupled with fluctuations in global demand, further hinder economic growth in the region within the broader EU framework.
This paper aims to explore the interdependencies between FDI, trade, and domestic investment and their collective impact on economic growth in the Baltic countries. This research seeks to examine the short- and long-run effects of foreign direct investment (FDI), domestic investment, and trade on economic growth in the Baltic countries. The hypothesis guiding this study is that there are significant associations between these variables and economic growth. Specifically, it is anticipated that FDI will have a positive impact on economic growth in the short term but may exert a negative influence over the long term. Similarly, it is expected that domestic investment will contribute positively to economic growth in the long run, although its impact in the short term may be less pronounced. Additionally, trade (exports) is hypothesized to boost economic growth in the short term but potentially have a negative effect in the long term. This hypothesis is based on the theoretical understanding that while FDI and exports can stimulate economic activity and growth initially, their effects might change over time due to various economic dynamics. The study aims to test these predictions and provide insights into how these factors interact to influence economic growth in the Baltic region. Using the Pooled Mean Group Autoregressive Distributed Lag (ARDL) method, this study assesses both the long- and short-run relationships between the variables. By examining empirical evidence and theoretical frameworks, the study provides a comprehensive analysis of how these factors interact within the selected economies and identifies policy interventions that could optimize their impact on economic growth. The remainder of this paper is organized as follows. Section 2 provides a review of the literature. Section 3 presents the research methodology. Section 4 discusses the empirical findings and their implications. Finally, Section 5 concludes with a summary of key findings and policy recommendations.
Investment theories, from classical to contemporary perspectives, provide a broad understanding of the dynamics of economic growth, though they may not always explicitly link specific variables like FDI, domestic investment, and trade directly to growth outcomes. Classical economists such as Adam Smith and David Ricardo laid the groundwork for understanding the role of capital accumulation and savings in fostering economic development (Smith, 1776; Ricardo, 1817). Their theories emphasize the importance of the rate of return on capital, influenced by technological progress and resource availability, which indirectly highlights the relevance of domestic investment in the growth process. Neoclassical economists, including Alfred Marshall and John Maynard Keynes, further developed investment theory by introducing marginal analysis, which explores the relationship between investment decisions and factors such as interest rates, expected returns, and risk preferences (Marshall, 1890; Keynes, 1936). This framework helps to explain the role of domestic investment in economic growth, as it is closely linked to the marginal efficiency of capital. However, while the neoclassical approach sheds light on investment behavior, it does not fully address the complexities introduced by uncertainty and changing economic conditions.
Keynesian economics, particularly through the work of John Maynard Keynes, introduced a focus on aggregate demand and uncertainty, which has implications for understanding FDI and its impact on economic growth (Keynes, 1936). Keynesian theory suggests that investment, including FDI, is influenced by expectations of future profitability, liquidity preferences, and government policies. This perspective helps to contextualize how FDI might contribute to economic growth by driving capital inflows and influencing domestic investment. Real options theory, advanced by financial economists Robert Merton and Stewart Myers, adds another dimension to investment decision-making by introducing the concept of flexibility (Merton, 1973; Myers, 1977). This theory is particularly relevant for understanding how firms approach domestic investment under uncertainty, enabling them to delay, expand, or abandon projects in response to shifting market conditions. Behavioral economists such as Daniel Kahneman and Richard Thaler have challenged the assumptions of traditional investment theory by highlighting cognitive biases and heuristics that can lead to suboptimal investment outcomes (Kahneman and Tversky, 1979; Thaler, 1980).
The Baltic countries – Estonia, Latvia, and Lithuania – maintain a significant trade relationship due to their geographic proximity and historical ties. Trade routes in this region date back to the Hanseatic League during the medieval period. However, trade within the Baltic region was restricted under Soviet rule due to centralized planning by Moscow. After regaining independence in the early 1990s, these countries focused on developing market economies and revitalizing trade relations. The establishment of the Baltic Assembly and the Baltic Council of Ministers further encouraged cooperation, particularly in trade (Hannu, 1979). Bilateral trade among these nations has flourished, with each country having distinct economic strengths and export profiles. Estonia, for instance, is known for its robust technology sector and e-services, while Latvia and Lithuania have diversified manufacturing industries, including wood processing, machinery, and food products. Additionally, the Baltic countries are members of key regional and global trade organizations, including the European Union (EU) since 2004 and the Baltic Free Trade Area (BAFTA), both of which promote trade and economic cooperation (Claus-Friedrich and Klaus, 2005).
EU membership has helped these countries implement probusiness policies, streamline regulations, and invest in infrastructure. A well-educated workforce and competitive operational costs have made the Baltic states attractive locations for European and international businesses seeking access to the EU single market. Integration into the EU's single market has greatly boosted their trade volumes and export competitiveness. With tariff-free access to the world’s largest single market, businesses in the Baltics have expanded their exports and entered new markets both within the EU and globally. The Baltic countries have effectively leveraged their strengths in sectors like information technology, manufacturing, logistics, and agri-food products, enhancing both export performance and economic resilience. Infrastructure and transport projects, like Rail Baltica and Via Baltica, have improved regional connectivity and logistics, simplifying trade flows within and beyond the Baltic region (Stecenko, 2020). These countries also play an active role in shaping EU trade policy and negotiations, ensuring their interests are represented in global trade agreements. Their strategic position on the EU's eastern frontier gives them access to both European markets and those in other regions. Located at a key crossroads, the Baltic states act as vital transit hubs for trade between Northern Europe, Central Asia, and the Far East, facilitating the smooth movement of goods and services across borders.
The literature reviewed offers a comprehensive analysis of the interplay among foreign direct investment, domestic investment, and trade across diverse regions and countries. Muço et al. (2018) delved into the impact of FDI on productivity growth, university enrollment, and unemployment in eight Balkan countries, highlighting the positive effects of both domestic investments and FDI on productivity growth within these nations. Sineviciene and Krusinskas (2018) examined the influence of international trade on private investment in the post-Soviet Baltic states, revealing substantial impacts of fluctuations in the GDP growth of trading partners on domestic private investment, thereby emphasizing the interconnectedness of economies. Irandoust (2019) explored the causal relationship between domestic saving and investment rates in six transition economies, indicating varying levels of capital mobility across countries, with Estonia, the Russian Federation, and Latvia exhibiting relatively higher mobility compared to others. Riccardo et al. (2021) investigated the effectiveness of Investment Promotion Agencies (IPAs) in Europe, finding a significant positive effect on FDI attraction, even in advanced economies.
Bobenič Hintošová et al. (2020) assessed the influence of inward and outward FDI on innovation performance in Visegrad and Baltic countries, highlighting the significance of outward FDI by domestic firms in enhancing innovation, particularly in Visegrad countries. Devesh and Zoltán (2020) analyzed the impact of economic freedom (EF) and its macroeconomic determinants on FDI inflows in various global regions, revealing significant enhancements in FDI inflows in several regions due to economic freedom. Josifidis et al. (2021) provided insights into the correlation between foreign and domestic investment and its impact on income distribution in postcommunist EU member states, suggesting that FDI mitigated adverse effects of domestic investment on income distribution. Korhan and Aysel (2023) explored determinants of the shadow economy in the Baltic region, highlighting financial development as a key factor. Their empirical results indicated the expansion of the shadow economy due to increased tax burden and institutional development. Cristina and Monica (2016) analyzed the impact of FDI on employment in Central and Eastern European countries, noting a process of creative destruction followed by a positive long-run effect on employment. Nadia (2021) examined sectorial FDI inflows in relation to the business cycle, revealing countercyclical patterns in aggregate services and a cyclical pattern in other sectors.
Elya et al. (2018) explored how financial development facilitates FDI's role in driving economic growth across developing countries, observing a positive impact overall but a negative effect in countries with low financial development. Nawal and Raman (2015) investigated determinants of FDI inflows in BRICS countries, demonstrating the robustness of findings across various variables influencing FDI flows. Kheng et al. (2017) unveiled significant bidirectional causality between human capital and FDI, underlining the need for coordinated policies in FDI and human capital development. Jude (2019) examined the relationship between foreign direct investment (FDI) and domestic investment in ten Central and Eastern European countries, revealing a dynamic interplay where FDI initially crowds out domestic investment in the short term but eventually leads to a crowding-in effect in the long term. Pradhan et al. (2017) explored the causal relationships among trade openness, FDI, financial development, and economic growth in 19 Eurozone countries using panel vector error-correction model, demonstrating significant boosts in FDI inflows over the long run due to trade openness and financial development, which in turn spurred economic growth in the short term. The literature primarily examines the effects of foreign direct investment on various economic indicators, with limited attention to the relationship between FDI, domestic investment, and trade in the Baltic countries. Recognizing this gap, the present study aims to address this research void by investigating the relationship between FDI, trade, and domestic investment in the Baltic economies.
The research utilizes data from the three Baltic economies, which share similar characteristics in governance and economic policies. The study is based on annual time series data from the World Bank, covering the period from 1995 to 2022 for each country. This timeframe was chosen due to the availability of data on the relevant economic indicators and the need to analyze significant events such as the 2008 financial crisis, EU membership, and the COVID-19 pandemic. The economic indicators analyzed include gross domestic product per capita (GDP per capita), exports, gross fixed capital formation (GFCF), foreign direct investment (FDI), and gross domestic savings (GDS). In this study, gross fixed capital formation serves as a proxy for domestic investment. Table 1 provides detailed information on the units of measurement and data sources for each variable analyzed.
|
Variable |
Detail |
Source |
|
Economic growth |
Gross domestic product per capita (GDPpc) measured in thousands ($USD) |
World Bank (2023); |
|
Trade |
Exports measured in billions ($USD) |
World Bank (2023); |
|
Foreign direct investment (FDI) |
Net FDI inflow share of GDP (%) |
World Bank (2023); |
|
Domestic investment |
Gross fixed capital formation Share of GDP (%) |
World Bank (2023); |
|
Gross domestic savings |
Share of GDP (%) |
World Bank (2023); |
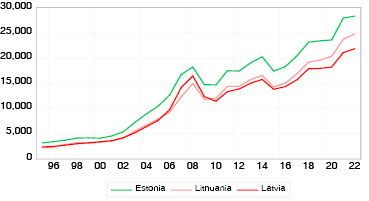
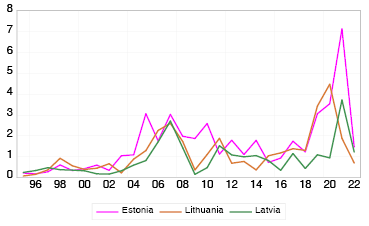
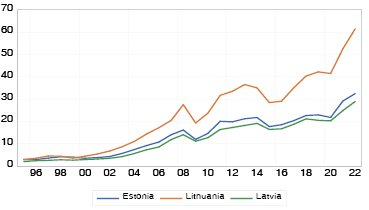
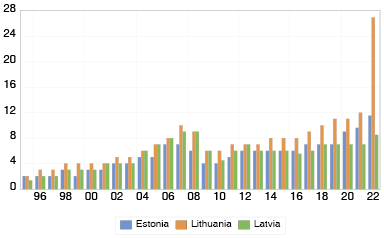
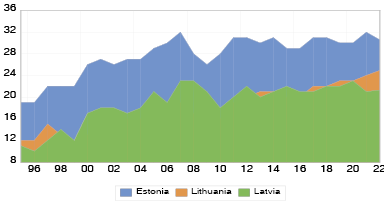
Figure 1 highlights the rise in GDP per capita across the Baltic nations over the sample period. Estonia shows remarkable growth, with GDP per capita rising from below $5,000 to over $25,000 by 2022. Lithuania, which initially lagged behind the other Baltic countries in the early 1990s, has made significant progress and caught up with its neighbors by the 2000s. Latvia, meanwhile, has seen steady and consistent increases in GDP per capita throughout this period. Figure 2 illustrates FDI inflows as a percentage of GDP in the Baltic states. Estonia stands out with significant growth, with FDI rising from less than 1% of GDP in 1995 to over 6% in 2021, outpacing all other Baltic countries before experiencing a sharp decline in 2022. Lithuania also recorded notable growth, although not as dramatic as Estonia's. In contrast, Latvia's FDI inflows have shown fluctuations over the years. Figure 3 shows export trends among the Baltic countries. Lithuania experienced a dramatic surge in exports, increasing from under $10 billion in 1995 to over $50 billion by 2022, reflecting rapid industrialization and economic growth. Estonia also saw a significant rise in exports, though not as pronounced as Lithuania's. Latvia’s export growth during this period has been relatively modest. Figure 4 depicts the growth rates in gross fixed capital formation across the Baltic states. Lithuania leads with the fastest growth rate, highlighting its dynamic economic development and favorable investment environment. Estonia and Latvia show more consistent, steady growth in this area. Figure 5 reveals trends in gross domestic savings from 1995 to 2022. Latvia consistently leads in domestic savings throughout the period, maintaining a strong position. Estonia also demonstrates significant growth in domestic savings over time. On the other hand, Lithuania experienced relatively lower growth in domestic savings during the study period.
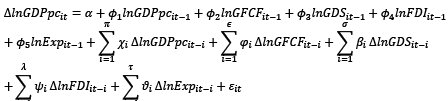
This research investigates the correlation between economic growth, foreign direct investment, domestic investment and trade in the Baltic countries. It utilizes a comprehensive theoretical framework to assess the significance of these variables. Drawing from the theoretical foundations of these variables, the proposed model estimation is in Equation 1
 (1)
(1)
For a correct model specification all the variables were transformed into natural logarithm in Equation 2.
 (2)
(2)
GDPpct represents the gross domestic product per capita, GFCFt stands for gross fixed capital formation, FDIt indicates the foreign direct investment, GDSt shows domestic savings, Expt represents total exports of goods and services, and εt is the error term.
Hypothesis 1: FDI, domestic investment, and exports exert a significant short-term impact on economic growth in the Baltic countries.
Hypothesis 2: FDI, domestic investment, and exports have a long-term effect on economic growth in the Baltic countries.
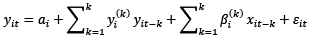
The study applied the Pooled Mean Group (PMG) Autoregressive Distributed Lag (ARDL) methodology introduced by Pesaran et al. (1999). This approach is particularly suitable for handling a relatively small number of observations, as in this study. The PMG-ARDL model incorporates lagged values of both the explanatory and dependent variables, allowing for variation in short-term coefficients and errors across panel groups while keeping the long-term coefficient constant (Pesaran et al., 1999). The PMG-ARDL model has been widely examined and is recognized for its reliability in producing accurate results. A key advantage of the ARDL model is its ability to handle series with both I(0) and I(1) orders of integration. Following Olayungbo (2021), the ARDL model using the selected variables is presented in Equation 3.
 (3)
(3)
The long-term coefficients are ϕ1, ϕ2 ϕ3, ϕ4, and ϕ5. Where the short run coefficients in the equation are χi, φi, βi, ψi and ϑi. The operator ∆ indicates the first difference of the variables. If cointegration is detected within the ARDL model (Equation 3), then the error correction model can be expressed as Equation 4.
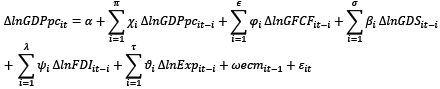 (4)
(4)
The term ωecmit–1 represents a one-period lag of the error correction term, where ω signifies the speed of adjustment from short-run dynamics to long-run equilibrium. The criterion for the coefficient of the error correction term, ω, dictates that its expected sign should be negative and statistically significant for a long-term equilibrium to be established between the dependent variable and the explanatory variables.
This study applies the cointegration tests proposed by Pedroni (2004), Kao (1999), and Johansen (1995) to analyze the relationships among the series. Pedroni (2004) recommends calculating the test statistic by taking the first difference of equation 5 and performing cointegration analysis on its residuals. The error term is then estimated using the first autoregressive process as follows:
 (5)
(5)
The Johansen (1995) cointegration test uses a vector autoregressive (VAR) model to detect multiple cointegrating relationships. The cointegration and the short run terms can be written as follows in Equation 6:
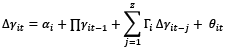 (6)
(6)
where the null hypothesis of no cointegration indicates that z (∏) = 0 and the alternative hypothesis shows cointegration existence when z (∏) ≠ 0. Conversely, Kao (1999) introduced the Kao cointegration test, which is based on a cointegrating regression model. This test analyzes the long-run equilibrium association among dependent variables and multiple explanatory factors in Equation 7.
 (7)
(7)
This allows for assessing cointegration between the dependent variable yit and the regressors, x1it, x2it…, xkit. The individual-specific coefficients βit, β1it, β2i,and βkit accommodate potential variations in the connection across entities within the panel.
The Dumitrescu and Hurlin (2012) method improves causality analysis in heterogeneous datasets. This technique employs the Granger causality test by computing the average of individual Wald statistics for each cross-sectional unit. Initially, Granger causality tests are conducted separately for each unit in the panel, with Wald statistics calculated individually. This method effectively accounts for differences across units, providing a more detailed analysis of causality. The causality test performed is in Equation 8 and 9.
 (8)
(8)
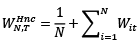 (9)
(9)
|
lnGDPPC |
lnGFCF |
lnGDS |
lnFDI |
lnExports |
|
|
Mean |
9.165 |
6.130 |
21.40 |
1.225 |
16.32 |
|
Median |
9.514 |
6.00 |
21.00 |
0.965 |
15.40 |
|
Maximum |
10.251 |
27.00 |
32.00 |
7.140 |
61.59 |
|
Minimum |
7.681 |
1.340 |
10.00 |
0.070 |
2.000 |
|
Std.Dev |
0.759 |
3.372 |
5.941 |
1.151 |
12.58 |
|
Skewness |
-0.534 |
2.856 |
0.061 |
2.271 |
1.078 |
|
Kurtosis |
1.823 |
18.60 |
2.179 |
10.39 |
4.193 |
|
Jarque–Bera |
8.837 |
966.2 |
2.407 |
263.4 |
21.27 |
|
Probability |
0.012 |
0.000 |
0.299 |
0.00 |
0.00 |
|
Sum |
769 |
514 |
1797 |
102 |
1371 |
|
Sum Sq. Dev |
47.84 |
944 |
2929 |
109 |
13144 |
|
Observation |
84 |
84 |
84 |
84 |
84 |
|
Correlation matrix |
|||||
|
lnGDPPC |
1.000 |
||||
|
lnGFCF |
0.682 |
1.000 |
|||
|
lnGDS |
0.684 |
0.322 |
1.000 |
||
|
lnFDI |
0.576 |
0.405 |
0.498 |
1.000 |
|
|
lnExports |
0.791 |
0.836 |
0.353 |
0.430 |
1.000 |
Table 2 provides descriptive statistics and a pairwise correlation matrix for the selected economic variables, including gross domestic product per capita, gross fixed capital formation, gross domestic savings, foreign direct investment, and exports. The descriptive statistics offer insights into the central tendency, dispersion, and shape of the distribution for each variable. GDPPC has a mean of 9.165 and exhibits negative skewness, indicating that higher-income countries are less common, while GFCF has a mean of 6.130 and considerable positive skewness, suggesting that these economies have relatively low levels of capital formation. GDS has a mean of 21.402 with skewness close to zero, indicating a more symmetric distribution of savings across the selected countries. FDI has a mean of 1.225 and positive skewness, suggesting that these countries attract relatively low levels of foreign direct investment. Exports have a mean of 16.32 and positive skewness, indicating that these countries have moderate export levels.
The correlation matrix reveals the relationships between these variables. GDPPC has a strong positive correlation with exports (0.791), indicating that countries with higher GDP per capita tend to have higher export levels, while GFCF and GDS exhibit moderate positive correlations with exports (0.836 and 0.353, respectively), suggesting that countries with higher capital formation and domestic savings also tend to have higher export levels. FDI shows a moderate positive correlation with exports (0.430), implying that countries attracting more foreign direct investment tend to have higher export levels. GFCF and GDS have a strong positive correlation with each other (0.684), suggesting that countries with higher levels of capital formation also tend to have higher domestic savings. GDPPC and GFCF, as well as GDPPC and GDS, exhibit moderate positive correlations (0.682 and 0.684 respectively), indicating that higher-income countries tend to have higher levels of both capital formation and domestic savings. FDI shows moderate positive correlations with GDPPC (0.576), GFCF (0.405), and GDS (0.498), suggesting that countries with higher income levels, capital formation, and domestic savings tend to attract more foreign direct investment.
To investigate this phenomenon, three tests proposed by Breusch and Pagan (1980), Im et al. (2003), and Pesaran (2004) were applied. Table 3 shows the results of cross-sectional dependence tests for the overall dataset. The Breusch–Pagan LM test statistic is 25.999 with 3 degrees of freedom, yielding a significant p-value, indicating strong evidence against the null hypothesis of no cross-sectional dependence. This suggests significant cross-sectional dependence in the data. Similarly, the Pesaran Scaled LM test statistic is 9.389 with a significant p-value, further supporting the rejection of the null hypothesis. Lastly, the Pesaran CD test statistic is 4.795, with a statistically significant p-value, reinforcing the presence of cross-sectional dependence in the dataset.
|
Test |
Statistic |
d.f |
Prob. |
|
Breusch–Pagan LM |
25.999*** |
3 |
0.000 |
|
Pesaran Scaled LM |
9.389*** |
0.000 |
|
|
Pesaran CD |
4.795*** |
0.000 |
The study employed the Cross-Sectionally Augmented IPS (CIPS) test, a second-generation test introduced by Pesaran (2007), to evaluate the characteristics of the selected variables. Table 4 presents the results of the CIPS unit root test for the chosen economic variables at both level 0 and level 1, using two specifications: one with a constant and another with a constant and trend. For GDP per capita (GDPpc) at level 0, the test statistic with the constant specification shows statistical significance at the 1% level. With the constant and trend option, the GDPpc test statistic at level 0 remains significant at the 1% level. For gross fixed capital formation (GFCF) at level 0, the test statistic is not statistically significant under either specification. However, at level 1, the test statistic for GFCF becomes significant at the 1% level for both specifications. Regarding gross domestic savings (GDS) at level 0, the test statistic with the constant specification is significant at the 10% level. At level 1, the GDS test statistic is significant at the 1% level under both specifications. For foreign direct investment (FDI) at level 0, the test statistic with the constant specification is significant at the 1% level, remaining significant at the 1% level with the constant and trend option. In the case of exports at level 0, the test statistic with the constant specification is significant at the 5% level. At level 1, the test statistic for exports is significant at the 1% level across both specifications.
|
Variable |
Level |
Constant |
Constant and trend |
|
GDPpc |
0 |
-2.931*** |
-4.207*** |
|
GFCF |
0 |
-0.411 |
-0.765 |
|
GFCF |
1 |
-5.307*** |
-3.685*** |
|
GDS |
0 |
-2.226* |
-2.626 |
|
GDS |
1 |
-5.566*** |
-5.674*** |
|
FDI |
0 |
-3.418*** |
-3.367*** |
|
Exports |
0 |
-2.551** |
-2.000 |
|
Exports |
1 |
-6.623*** |
-6.667*** |
The research employs cointegration test proposed by Johansen (1995) to investigate the relationship between the selected variables. Table 5 presents the results of the Johansen panel cointegration test, examining the presence and number of cointegrating vectors within the panel data. The findings reveal evidence of cointegration in the panel data. However, at rank none both the trace test and max eigen test statistics have significant p-values, indicating the presence of cointegration. Subsequently, the results suggest the potential presence of at most one cointegrating vector at rank one, supported by significant p-values. Further analysis indicates the possibility of at most two or three cointegrating vectors at ranks 2 and 3, respectively, with significant trace test statistics but nonsignificant max eigen test statistics. Moreover, at rank 4 both the trace test and max eigen test statistics have significant p-values, suggesting the potential existence of at most four cointegrating vectors. The outcome of the cointegration test shows a long run relationship among the variables in the selected countries.
|
Coint. Rank |
Trace Test |
Prob. |
Max Eigen Test |
Prob. |
|
None |
61.49*** |
0.000 |
38.28*** |
0.000 |
|
At most 1 |
29.79*** |
0.000 |
18.51*** |
0.005 |
|
At most 2 |
16.10** |
0.013 |
9.485 |
0.148 |
|
At most 3 |
11.95* |
0.063 |
6.926 |
0.327 |
|
At most 4 |
14.27** |
0.026 |
14.27** |
0.026 |
Table 6 indicates the results of the Pedroni panel cointegration test and the Kao cointegration test. In the within-dimension category, the panel v-statistic does not indicate evidence of cointegration, as it is nonsignificant in both the unweighted and weighted cases. Similarly, the panel rho-statistic does not show evidence of cointegration, remaining nonsignificant in both its unweighted and weighted forms. However, the panel PP-statistic suggests some evidence of cointegration, as it is marginally significant in the unweighted case and becomes significant when weighted. The panel ADF-statistic, similar to the panel PP-statistic, also suggests evidence of cointegration, being marginally significant in the unweighted form and significant in the weighted form. In the between-dimension category, the group rho-statistic does not indicate cointegration, as it is nonsignificant. However, both the group PP-statistic and the group ADF-statistic suggest evidence of cointegration, as they are marginally significant. The results of the Kao cointegration test further support the existence of a long-run relationship among the variables, as the ADF statistic is highly significant.
|
t-statistic |
Prob. |
Weighted statistic |
Prob. |
|
|
Within dimension |
||||
|
Panel v-statistic |
0.018 |
0.493 |
-0.246 |
0.597 |
|
Panel rho-statistic |
-0.312 |
0.377 |
-0.629 |
0.264 |
|
Panel PP-statistic |
-1.309* |
0.095 |
-1.767 |
0.038** |
|
Panel ADF-statistic |
-1.3109* |
0.095 |
-1.764 |
0.038** |
|
Between dimension |
||||
|
Group rho-statistic |
0.210 |
0.583 |
||
|
Group PP-statistic |
-1.418* |
0.078 |
||
|
Group ADF-statistic |
-1.413* |
0.078 |
||
|
Kao cointegration test |
t-statistic |
Prob. |
||
|
ADF |
-3.627*** |
0.000 |
||
The panel ARDL results in Table 7 show the long-run and short-run relationships between the selected independent variables and GDP per capita. In the long run, gross fixed capital formation significantly boosts economic growth, with a coefficient 0.269, significant at the 1% level. This indicates that investments in physical capital, such as infrastructure and machinery, play a critical role in driving long-term economic expansion. The positive impact of gross fixed capital formation is consistent with similar findings by Ebru et al. (2020). Additionally, higher domestic savings positively impact GDP per capita at the 1% significance level, suggesting that increased savings lead to higher investment levels, thereby promoting long-term economic prosperity. This outcome on domestic investment aligns with the findings from similar study by Muço et al. (2018) and Irandoust (2019). However, it is notable that in the long run, increases in foreign direct investment (FDI) and exports are associated with a decline in GDP per capita at the 5% significance level. This could indicate challenges such as heightened competition and resource shifts from domestic markets to export-oriented production.
The negative long-run effect of FDI aligns with Saglam (2017), who found that FDI negatively impacted economic growth in European transition countries. On the contrary, this negative effect from FDI and exports contradict the results from similar research by Riccardo et al. (2021), Devesh and Zoltán (2020), Pradhan et al. (2017), Elya et al. (2018), and Sineviciene and Krusinskas (2018) whose findings indicated a positive influence from FDI. In the short run, fluctuations in FDI and exports have significant effects on GDP per capita at the 1% level, highlighting the economy's sensitivity to changes in these factors over shorter time frames. This suggests that short-term variations in FDI inflows and export levels can quickly impact economic activity and GDP per capita. Conversely, changes in gross fixed capital formation do not have significant short-run effects on GDP per capita, indicating that short-term investment shifts may not immediately result in noticeable changes in GDP per capita. However, gross domestic savings show significance at the 10% level, indicating a modest short-run influence, suggesting that short-term changes in savings levels may slightly impact GDP per capita, though to a lesser extent compared to FDI and exports. Moreover, the error correction term has a coefficient-0.117, which is statistically significant. This indicates that deviations from the long-run equilibrium are corrected at a rapid pace. Specifically, for each percentage deviation from the equilibrium in the previous period, GDP per capita adjusts by approximately 11.7% toward the long-run equilibrium in the current period.
|
Long Run |
Coefficient |
Std.Error |
t-statistic |
Prob. |
|
GFCF |
0.269*** |
0.081 |
3.330 |
0.002 |
|
GDS |
0.153*** |
0.035 |
4.321 |
0.000 |
|
FDI |
-0.263** |
0.108 |
-2.436 |
0.017 |
|
Exports |
-0.048** |
0.023 |
-2.051 |
0.044 |
|
Short Run |
||||
|
ECT (-1) |
-0.117*** |
0.010 |
-11.468 |
0.000 |
|
∆GFC |
-0.005 |
0.020 |
-0.273 |
0.785 |
|
∆GDS |
-0.007* |
0.004 |
-1.758 |
0.083 |
|
∆FDI |
0.035*** |
0.003 |
9.402 |
0.000 |
|
∆Export |
0.033*** |
0.004 |
7.513 |
0.000 |
|
Constant |
0.663*** |
0.047 |
14.059 |
0.000 |
Table 8 presents the results of Fully Modified Ordinary Least Squares (FMOLS) and Dynamic Ordinary Least Squares (DOLS) for robustness estimation. The FMOLS results show that gross capital formation (GCF) has a negative coefficient -0.015, suggesting that an increase in GCF is associated with a slight decrease in GDP per capita. However, this relationship is not statistically significant, meaning that GCF does not have a real impact on GDP per capita. Gross domestic savings (GDS), on the other hand, has a positive and statistically significant coefficient 0.095 at the 1% significance level. This indicates that higher domestic savings are strongly associated with increased GDP per capita, implying that savings play a crucial role in enhancing a country's economic output per capita. FDI also shows a positive coefficient 0.069, significant at the 5% level, suggesting that an increase in FDI positively influences GDP per capita, reflecting the beneficial impact of foreign investments on economic growth. Exports have a coefficient 0.032, which is significant at the 1% level, indicating that higher exports significantly contribute to GDP per capita, reinforcing the importance of trade in economic development. The DOLS results show that gross capital formation has a positive coefficient 0.106, though it is not statistically significant. This result contrasts with the FMOLS estimation and suggests that while GCF might positively influence GDP per capita. Gross domestic savings has a positive coefficient 0.065, and statistically significant at 10%. This weakens the strong positive relationship observed in the FMOLS results. FDI shows a very small positive coefficient 0.009, which is not significant, indicating no meaningful impact of FDI on GDP per capita. Finally, exports have a positive and significant coefficient 0.024, consistent with the FMOLS results, emphasizing the role of exports in enhancing GDP per capita.
|
Variable |
FMOLS |
DOLS |
||||
|
Coefficient |
Std.Error |
Prob. |
Coefficient |
Std. Error |
Prob. |
|
|
GCF |
-0.015 |
0.015 |
0.351 |
0.106 |
0.075 |
0.169 |
|
GDS |
0.095*** |
0.014 |
0.000 |
0.065* |
0.036 |
0.079 |
|
FDI |
0.069** |
0.029 |
0.021 |
0.009 |
0.148 |
0.951 |
|
Exports |
0.032*** |
0.005 |
0.000 |
0.024*** |
0.007 |
0.005 |
The study applied the Dumitrescu and Hurlin (2012) heterogeneous panel noncausality test to explore the direction of causality among the selected variables. The Pairwise Dumitrescu–Hurlin panel causality test results in Table 9 reveal the causal relationships between various economic indicators. The results show that gross fixed capital formation does not consistently cause GDP per capita, indicating that changes in gross fixed capital formation do not uniformly lead to variations in GDP per capita across the panel. Similarly, GDP per capita does not consistently cause gross fixed capital formation, suggesting that economic growth does not uniformly drive investment in physical capital. However, the test identifies bidirectional causality between GDP per capita and gross domestic savings, indicating that changes in GDP per capita and savings behavior influence each other in a mutually reinforcing manner. FDI is found to consistently cause GDP per capita, implying that shifts in FDI have a uniform impact on economic growth. However, reverse causality is not observed, meaning changes in GDP per capita do not consistently affect FDI levels. Lastly, the analysis shows that exports do not uniformly cause GDP per capita, nor does GDP per capita consistently drive changes in export levels. This suggests that fluctuations in exports and economic growth do not exhibit a uniform causal relationship across the panel.
|
Null Hypothesis |
W-Stat |
Prob. |
Conclusion |
|
GFCF does not homogeneously cause GDPPC |
2.792 |
0.681 |
Not rejected |
|
GDPPC does not homogeneously cause GFCF |
3.971 |
0.214 |
Not rejected |
|
GDS does not homogeneously cause GDPPC |
2.641 |
0.761 |
Not rejected |
|
GDPPC does not homogeneously cause GDS |
7.916 |
0.000 |
Rejected |
|
FDI does not homogeneously cause GDPPC |
4.550 |
0.098 |
Rejected |
|
GDPPC does not homogeneously cause FDI |
3.182 |
0.493 |
Not rejected |
|
Exports does not homogeneously cause GDPPC |
1.645 |
0.690 |
Not rejected |
|
GDPPC does not homogeneously cause Exports |
0.801 |
0.320 |
Not rejected |
This study investigates the effect of FDI,domestic investment and trade in the Baltic countries, namely Latvia, Lithuania, and Estonia. Utilizing the Pooled Mean Autoregressive Distributed Lag method, the research assesses both short- and long-run relationships among the analyzed variables, employing annual data from the World Bank spanning from 1995 to 2022. The long-run estimation results revealed a positive influence of gross fixed capital formation on economic growth in these economies, while exhibiting no significant effect in the short term. Interestingly, FDI was found to have a negative impact on economic growth in the long run in the Baltic economies, despite showing a positive short-term effect. Additionally, other supporting variable such as gross domestic savings were observed to have a long-term positive impact but a negative short-term effect on the selected economies. Furthermore, while exports were seen to negatively influence these countries in the long run, they exhibited a short-term positive effect. Moreover, the causality test indicated a unidirectional association between economic growth, domestic savings, and FDI in the Baltic countries.
Based on the findings of this study, policymakers in the Baltic countries should prioritize measures to promote gross fixed capital formation as a means to stimulate long-term economic growth. This implies fostering investment in physical infrastructure, technology, and human capital development through initiatives such as tax incentives, infrastructure development programs, and investment-friendly regulatory frameworks. Furthermore, policymakers should conduct a comprehensive review of FDI policies to ensure alignment with long-term growth objectives. Despite the short-term positive impact of FDI, the study's findings suggest a negative long-term effect on economic growth in the Baltic countries. Thus, measures should be implemented to promote sustainable and value-added FDI, such as targeting strategic sectors, fostering technology transfer and innovation, and enhancing linkages with domestic industries. Addressing short-term economic volatility is also crucial, given the observed fluctuations in economic variables like FDI, domestic savings, and exports. Policymakers should develop effective mechanisms to manage short-term economic volatility, including implementing countercyclical fiscal and monetary policies, enhancing financial market stability, and promoting diversification of export markets to mitigate adverse effects on economic growth. Additionally, policymakers should invest in enhancing data collection, analysis, and monitoring mechanisms to improve the understanding of the dynamics between FDI, domestic investment, exports, and economic growth. Strengthening institutional capacities, enhancing data transparency, and fostering collaboration with international organizations are essential steps towards accessing timely and reliable economic data for evidence-based policymaking.
One limitation of this study is the use of GDP per capita as the primary measure of economic growth. While GDP per capita provides an average figure of economic output per person, it does not account for income distribution or demographic changes. Therefore, it might not fully capture variations in economic well-being across different segments of the population or adjustments for population growth. Another limitation of the study reliance on annual data from the World Bank, which may not fully capture short-term fluctuations or provide a detailed understanding of the dynamic relationships between variables. In future studies, researchers could overcome this limitation by employing more granular data at a higher frequency, such as quarterly or monthly data, to capture short-term variations more accurately.
Adina, D., & Dumitru-Cristian, O. (2013). Foreign Direct Investment and Post Crisis Economic Growth: Evidence from European Union. Revista Economica, 65(6), 46-60.
Alfaro, L., Chanda, A., Kalemli-Ozcan, S., & Sayek, S. (2004). FDI and economic growth: the role of local financial markets. Journal of International Economics, 60(1), 89-112.https://doi.org/10.1016/S0022-1996(03)00081-3.
Banday, U. J., Murugan, S., & Maryam, J. (2021). Foreign direct investment, trade openness and economic growth in BRICS countries: evidences from panel data. Transnational Corporations Review, 13(2), 211–221. https://doi.org/10.1080/19186444.2020.1851162.
Barkauskaite, A., & Naraskeviciute, V. (2016). Foreign Direct Investment Impact on Economic Indicators of the Baltic Countries. Economics and Business, 28, 61-67.doi: 10.1515/eb-2016-0009.
Bobenič Hintošová, A., Bruothová, M., & Vasková, I. (2020). Does Foreign Direct Investment Boost Innovation? The Case of the Visegrad and Baltic Countries. Quality Innovation Prosperity, 24(3), 106–121. https://doi.org/10.12776/qip.v24i3.1519.
Borensztein, E., De Gregorio, J., & Lee, J. W. (1998). How Does Foreign Direct Investment Affect Economic Growth? Journal of International Economics, 45(1), 115-135.https://doi.org/10.1016/S0022-1996(97)00033-0.
Breusch, T. S., & Pagan, A. R. (1980). The Lagrange Multiplier Test and its Applications to Model Specification in Econometrics. The Review of Economic Studies, 47(1), 239-253. http://dx.doi.org/10.2307/2297111.
Claus-Friedrich, L., & Klaus, S. (2005). Baltic Trade with Europe: Back to the Roots? Baltic Journal of Economics, 5(2), 15-37, DOI: 10.1080/1406099X.2005.10840421.
Cristina, J., & Monica, I. P. (2016). Employment effects of foreign direct investment: New evidence from Central and Eastern European countries. International Economics, 145, 32-49.https://doi.org/10.1016/j.inteco.2015.02.003.
Dixit, A., & Pindyck, R. (1994). Investment Under Uncertainty. New Jersey: Princeton University Press.
Dumitrescu, E., & Hurlin, C. (2012). Testing for Granger non-causality in heterogeneous panels. Economic Modelling, 29(4), 1450-1460.
Devesh, S., & Zoltán, G. (2020). Economic Freedom and its Impact on Foreign Direct Investment: Global Overview. Review of Economic Perspectives, 20(1), 73–90.DOI: 10.2478/revecp-2020-0004.
Ebru, T., Buket, A., & Alper, A. (2020). Global evidence from the link between economic growth, natural resources, energy consumption, and gross capital formation. Resources Policy, 66, 101622.https://doi.org/10.1016/j.resourpol.2020.101622.
Elya, N. A., Abu, H. S., Nor, H. H., & Tamat, S. (2018). Foreign Direct Investment, Financial Development and Economic Growth: A Panel Data Analysis. Jurnal Pengurusan, 11 – 24 https://doi.org/10.17576/pengurusan-2018-51-02.
Eurostat. (2024). Gross fixed capital formation (investments). Kirchberg, Luxembourg: Eurostat.
Fakhri, J. H., Brantley, L., & Jeyhun, I. M. (2018). The impact of international trade on CO2 emissions in oil exporting countries: Territory vs consumption emissions accounting. Energy Economics, 74, 343-350.https://doi.org/10.1016/j.eneco.2018.06.004.
Hannu, K. (1979). The Development of Trade Relations Between the Baltic States, 1945-1975: A Theoretical Assessment and an Empirical Survey. Current Research on Peace and Violence, 2(3), 157-183.
Im, K. S., Pesaran, M. H., & Shin, Y. (2003). Testing for unit roots in heterogeneous panels. Journal of Econometrics, 115(1), 53-74. http://dx.doi.org/10.1016/S0304-4076(03)00092-7.
Irandoust, M. (2019). Saving and investment causality: implications for financial integration in transition countries of Eastern Europe. International Economics and Economic Policy, 16, 397–416.https://doi.org/10.1007/s10368-017-0390-6.
Iorember, P. T., Gbaka, S., Jelilov, G., Alymkulova, N., & Usman, O. (2022). Impact of international trade, energy consumption and income on environmental degradation in Africa’s OPEC member countries. African Development Review, 34, 175–187. https://doi.org/10.1111/1467-8268.12629.
Johansen, S. (1995). Likelihood-Based Inference in Cointegrated Vector Autoregressive Models. Oxford: University Press.
Josifidis, K., Supić, N., & Bodor, S. (2021). Distributional Effects of Foreign versus Domestic Investment: Evidence from Post-Communist EU Member States. Panoeconomicus,, 68(2), 187–211. https://doi.org/10.2298/PAN2102187J.
Jude, C. (2019). Does FDI crowd out domestic investment in transition countries? Economics of Transition, 27, 163-200. https://doi.org/10.1111/ecot.12184.
Kahneman, D., & Tversky, A. (1979). Prospect Theory: An Analysis of Decision under Risk. Econometrica, 47(2), 263-292.https://doi.org/10.2307/1914185.
Kao, C. (1999). Spurious regression and residual-based tests for cointegration in panel data. Journal of Econometrics, 90(1), 1–44. https://doi.org/10.1016/s0304-4076(98)00023-2
Keynes, M. J. (1936). The General Theory of Employment, Interest, and Money. London: Macmillan.
Kheng, V., Sun, S., & Anwar, S. (2017). Foreign direct investment and human capital in developing countries: a panel data approach. Economic Change and Restructuring, 341–365. https://doi.org/10.1007/s10644-016-9191-0.
Korhan, K. G., & Aysel, A. (2023). Investigating the Determinants of the Shadow Economy: The Baltic Region. Eastern European Economics, 61(2), 181-198, DOI: 10.1080/00128775.2022.2163905.
Marshall, A. (1890). Principles of Economics . London: Macmillan.
Merton, C. R. (1973). Theory of Rational Option Pricing. The Bell Journal of Economics and Management Science, 4(1), 141-183.https://doi.org/10.2307/3003143.
Muço, K., Valentini, E., & Lucarelli, S. (2018). The Impact of Foreign Direct Investment on the Productivity of the Balkan Countries. Transition Studies Review, 25(2), 37-54. doi:https://doi.org/10.14665/1614-4007-25-2-003.
Myers, C. S. (1977). Determinants of corporate borrowing. Journal of Financial Economics, 5(2), 147-175.https://doi.org/10.1016/0304-405X(77)90015-0.
Nadia, D. (2021). Do FDI inflows to Eastern Europe and Central Asia respond to the business cycle? A sector level analysis. The Journal of Economic Asymmetries, 23, e00194.https://doi.org/10.1016/j.jeca.2020.e00194.
Nawal, K., & Raman, P. S. (2015). Determinants of FDI and its Impact on BRICS Countries: A Panel Data Approach. Transnational Corporations Review, 7(3), 269-278, DOI: 10.5148/tncr.2015.7302.
OECD. (2014). “Investment”, in National Accounts at a Glance 2014. Paris: OECD Publishing,.
OECD. (2018). OECD Economic Outlook. Paris: OECD Publishing.
Olayungbo, O. D. (2021). Global oil price and food prices in food importing and oil exporting developing countries: A panel ARDL analysis. Heliyon, 7, e06357.https://doi.org/10.1016/j.heliyon.2021.e06357.
Pedroni, P. (2004). Panel cointegration: Asymptotic and finite sample properties of pooled time series tests with an application to the PPP hypothesis. Econometric Theory, 20, 597 - 625. https://doi.org/10.1017/S0266466604203073
Pesaran, M. H. (2004). General Diagnostic Tests for Cross Section Dependence in Panels. IZA Discussion Paper(1240), 1-41. http://dx.doi.org/10.2139/ssrn.572504.
Pesaran, M. H. (2007). A simple panel unit root test in the presence of cross-section dependence. Journal of Applied Econometrics, 22(2), 265-312. http://dx.doi.org/10.1002/JAE.951.
Pesaran, M., Shin, Y., & Smith, R. (1999). Pooled mean group estimation of dynamic heterogeneous panels. Journal of the American Statistical Association, 94(446), 621-634, DOI: 10.1080/01621459.1999.10474156.
Pradhan, R. P., Arvin, M. B., Hall, J. H., & Nair, M. (2017). Trade openness, foreign direct investment, and finance-growth nexus in the Eurozone countries. The Journal of International Trade & Economic Development, 26(3), 336–360. https://doi.org/10.1080/09638199.2016.1249392.
Ricardo, D. (1817). On the Principles of Political Economy and Taxation. London: John Murray.
Riccardo, C., Marco, D. C., & Mara, G. (2021). FDI inflows in Europe: Does investment promotion work? Journal of International Economics, 132, 103497.https://doi.org/10.1016/j.jinteco.2021.103497.
Saglam, Y. (2017). FDI and Economic Growth in European Transition Economies: Panel Data Analysis. Journal of Yasar University, 12(46), 123-135.
Sijabat, R. (2022). The Association of Economic Growth, Foreign Aid, Foreign Direct Investment and Gross Capital Formation in Indonesia: Evidence from the Toda–Yamamoto Approach. Economies, 10(93), 1-12.https://doi.org/10.3390/economies10040093.
Sineviciene, L., & Krusinskas, R. (2018). How Dependent Are the Baltic States on Russia? Europe-Asia Studies, 70(8), 1264-1280, DOI: 10.1080/09668136.2018.1508643.
Smith, A. (1776). An Inquiry into the Nature and Causes of the Wealth of Nations. London: W. Strahan and T. Cadell.
Stecenko, I. (2020). Assessment of The Prospects for The Development of Trade Relations of The Baltic Countries and Southeast Asia. Baltic Journal of Economic Studies, 6(2), 54-60.https://doi.org/10.30525/2256-0742/2020-6-2-54-60.
Thaler, R. (1980). Toward a positive theory of consumer choice. Journal of Economic Behavior & Organization, 1(1), 39-60.https://doi.org/10.1016/0167-2681(80)90051-7.
UNCTAD. (2020). World Investment Report: International Production Beyond the Pandemic. Geneva: United Nations Conference on Trade and Development.
UNCTAD. (2021). World Investment Report:Investing in Sustainable Recovery. Geneva: United Nations Conference on Trade and Development.
World Bank. (2019). Doing Business 2019:Training for Reform. Washington DC: The World Bank Group.
Yanbo, S., Junling, L., & Wen, T. (2022). Interaction between international trade and logistics carbon emissions. Energy Reports, 8, 10334-10345.https://doi.org/10.1016/j.egyr.2022.07.159.
Yucel, E. G. (2014). FDI and Economic Growth: The Case of Baltic Countries. Research in World Economy, 5(2), 115-134.http://dx.doi.org/10.5430/rwe.v5n2p115 .