Ekonomika ISSN 1392-1258 eISSN 2424-6166
2025, vol. 104(1), pp. 103–121 DOI: https://doi.org/10.15388/Ekon.2025.104.1.6
Ľubomíra Kubíková
Department of Tourism, Faculty of Commerce, University of Economics in Bratislava,
Bratislava, The Slovak Republic
Email: lubomira.kubikova@euba.sk
ORCID ID: https://orcid.org/0009-0009-2143-9163
Stanislav Rudý
Department of Corporate Financial Management, Faculty of Business Economics with seat in Košice,
University of Economics in Bratislava, The Slovak Republic
Email: stanislav.rudy@euba.sk
ORCID ID: https://orcid.org/0009-0009-1236-4091
Viera Kubičková
3Department of Tourism, Faculty of Commerce, University of Economics in Bratislava,
Bratislava, The Slovak Republic
Email: viera.kubickova@euba.sk
ORCID ID: https://orcid.org/0000-0001-6129-2471
Abstract. The objective of this study is to analyse the relationship between tourist attitudes towards waste generation in Slovakia and their corresponding behaviours. With an increasing emphasis on environmental responsibility, understanding the behaviours and beliefs of tourists concerning waste management is crucial for promoting sustainable practices within tourism. This research focused specifically on tourists visiting Slovakia, offering valuable insights into their waste management attitudes. A questionnaire was distributed electronically to 324 respondents through platforms such as MS Teams, email, and social networks. The questionnaire captured tourist attitudes and behaviours regarding waste generation, responsible consumption, and environmentally sustainable practices. The sample size of 324 responses was validated for representativeness. The statistical method, principal component factor analysis (PCA), was used to assess data suitability and identify the underlying patterns. Correlation analysis was conducted to examine the relationships between variables, with a significance check included. The results showed a significant correlation between tourist attitudes towards waste reduction and their environmentally responsible behaviours. This study provides important implications for promoting sustainable tourism practices in Slovakia and enhancing environmental stewardship in the industry. These findings offer insights that can support more targeted interventions so that to improve waste management in tourism, thereby contributing to Slovakia’s sustainability goals.
Keywords: tourism, sustainability, waste, consumer attitude, consumption, PCA, correlation.
Funding. This study is part of the projects KEGA n. 035EU-4/2022 Achieving the Goals of the 2030 Agenda for Sustainable Development under the Influence of the Global Pandemic COVID-19 and VEGA 1/0271/23 Sustainable Renewal of Spa Tourism in the Slovak Republic in the Context of the Impacts of Civilization Crises.
_________
Received: 14/06/2024. Revised: 03/10/2024. Accepted: 05/01/2025
Copyright © 2025 Ľubomíra Kubíková, Stanislav Rudý, Viera Kubičková. Published by Vilnius University Press
This is an Open Access article distributed under the terms of the Creative Commons Attribution License, which permits unrestricted use, distribution, and reproduction in any medium, provided the original author and source are credited.
Consumer attitudes towards tourism waste are crucial for achieving sustainable tourism. Understanding these attitudes helps mitigate negative environmental impacts and develop strategies for better waste management.
Tourism has been one of the most critical sectors of the global economy for decades, and its economic activity continues to grow despite the interference of the COVID-19 pandemic, which interrupted its long-lasting period of constant growth (Herrero et al., 2022).
Handling food waste in tourism challenges the economy, the environment and society. Eating habits, perceptions, attitudes, and behaviours of consumers are essential in the generation of waste in the tourism industry (Amicarelli et al., 2022). As a society, we must take responsibility and act. Sustainable development initiatives are integral to the UN Agenda, and also to tourists who drive sustainable changes (Amundson, 2022).
Tourism brings relaxation, enjoyment, and entertainment to tourists, which may cause their behaviour to be less environmentally friendly than at home, where they are considerate of sustainable activities and the environment (Liu et al., 2022).
Collectivistic associations and group references are related to the expected achievement of a group goal, and the normative motive of being an exception to everyday life in the form of a holiday or vacation may cause tourists to behave less environmentally sustainably (Liu et al., 2022).
The growth of tourism has adverse effects on the environment of the tourism destination. The increase in the numbers of visitors in the tourist sector is also associated with an increase in waste produced by tourists, which affects the ecology, vegetation, soil, and water, thus ultimately disrupting the entire ecosystem, which raises concerns and supports the search for practical solutions for waste sorting. The success of waste sorting in tourist destinations largely depends on tourists’ behaviour, culture, and awareness (Cao et al., 2022).
Tourism must be sustainable for the economies of the countries involved so that they could prosper and grow green. A dramatic and excessive increase in the number of visitors has a long-term impact on the lifestyle of residents and leads to adverse effects. Adoption of a sustainable development strategy increases environmental awareness. It points to green tourism, which is considered the future direction of development as it seeks to protect the green environment and ecological principles (Markose et al., 2022).
Consumer attitudes wield substantial influence on sustainable tourism, shaping decisions and actions that directly impact environmental preservation, cultural heritage, economic progress, and waste reduction (Juvan and Dolnicar, 2016).
Examining consumers’ attitudes towards waste generation in tourism is essential in the context of scientific outputs.
The first point is that tourism is an industry with an ever-increasing impact on the environment and society. Therefore, it is essential to understand how consumers behave in this area, and how their attitudes affect environmental sustainability.
The second reason is the relative novelty of this topic. Given the growing emphasis on environmental sustainability and responsible travel, there is still much room for research on consumer attitudes towards waste in the tourism industry. This space allows researchers to discover new knowledge and identify trends and patterns in consumer behaviour. This can lead to a better understanding of this issue and the development of more effective strategies to improve environmental sustainability in tourism.
Moreover, more research indicates the need for further investigation and data collection. New studies can provide new information and insights into the issue of waste in the tourism industry, leading to improved policies and measures to protect the environment. Given these factors, researchers must address this topic and contribute to developing knowledge of consumer behaviour and environmental sustainability in tourism. For this reason, we are interested in this topic.
The study employed various statistical methods. The Kaiser-Meyer-Olkin test was employed to evaluate the appropriateness of factor analysis. Bartlett’s Test of Sphericity was administered to ascertain the uniformity of the correlation matrix among the chosen variables, which is a critical prerequisite for effective factor analysis. Factor analysis was used to capture the correlation between variables. Factor Analysis utilising the Principal Components Method (PCA) was executed to discern the underlying patterns, subsequently condensing them into principal components, thereby facilitating dimensionality reduction. These methodological approaches collectively yielded insights into the dataset’s congruence and structural patterns, thereby enhancing the precision of the interpretation of the research results.
The study objective is to identify the relationship between consumer attitudes towards waste generation in tourism in Slovakia. By understanding whether there is a correlation between attitudes and behaviours related to waste generation in tourism, we want to gain insights into consumer decision-making processes and identify potential areas for promoting sustainable practices within the tourism industry. For behaviours related to waste generation in tourism, we aim to gain insights into consumer decision-making processes and potential areas for promoting sustainable practices within tourism.
Slovakia is known for its stunning natural landscapes, including mountains, forests, and national parks, which attract high numbers of tourists annually. Tourism plays a significant role in the country’s economy and regional development. However, the growing influx of visitors brings environmental challenges, such as increased waste production, the degradation of natural resources, and pollution of delicate ecosystems. In response to these challenges, there is a rising emphasis on sustainable tourism which aims to minimise negative environmental impacts. Responsible behaviour by tourists, along with eco-friendly practices implemented by tourism service providers, is crucial for preserving the environment and ensuring that Slovakia’s natural treasures remain protected for future generations (Cakoci et al., 2014).
The research on Slovak consumers’ attitudes toward waste generation in tourism is expected to provide valuable insights into how tourists perceive the environmental impact of their activities. Additionally, the study will assess the level of environmental awareness among tourists and their willingness to reduce waste in travel destinations. This research could offer important guidance for promoting more sustainable practices in Slovak tourism, ultimately helping to protect the natural environment for future generations (Štrba et al., 2022).
This study is among the first to focus on the waste management behaviours of tourists in Slovakia. While much research has been conducted on local populations and their waste habits, few studies have explored how tourists’ behaviours in tourism settings contribute to waste generation. Hence, the present research is expected to provide valuable insights into the challenges and opportunities for sustainable tourism in the region.
Tourism consumers’ attitudes towards waste are crucial to their socially responsible behaviour. These attitudes consider their relationship with the environment and influence the decisions they make when travelling. One of the main points of view is the responsibility for generating one’s waste. Nowadays, many consumers are interested in environmentally responsible behaviour, and are willing to take responsibility for their waste (Liobikienė and Juknys, 2016; Thøgersen, 2006). Another important aspect is the support of sustainable initiatives, where consumers show a positive attitude towards destinations and businesses which implement sustainable waste policies. Education and awareness also play a key role in forming attitudes, where education contributes to greater sensitivity to the environmental problems associated with waste (Padilla and Trujillo, 2020). Use of reusable packaging is another manifestation of positive attitudes, where consumers prefer recyclable materials that contribute to waste reduction. Some consumers are also actively involved in volunteer activities aimed at cleaning and caring for the environment in tourist places (Šuškevičė and Kruopienė, 2021; Coelho et al., 2020).
As part of travel planning, consumers can also evaluate the waste policies of destinations. Destinations with clear and effective waste policies may be given preference in their decision-making. Research on consumer attitudes towards waste in tourism can offer insight into how these attitudes influence their behaviour and contribute to social responsibility (Ezeah et al., 2015). The waste behaviour of tourism consumers is an essential part of environmentally responsible behaviour. Consumers directly influence the structure and volume of waste, especially in its creation and separation phases. By their behaviour, they condition favourable ecological procedures in the waste management of tourism entities and destinations. With their expectations, attitudes, and values, they can influence the approaches of tourism service producers in waste policy (Coelho et al., 2020; Ezeah et al., 2015).
If tourists behave pro-environmentally, they limit and prevent environmental destruction in tourist destinations (Ulusoy, 2016; Xiong, 2023). Pro-environmental behaviour with factors based on tourists’ world outlook is key to sustainable waste management. Waste sorting is beneficial for waste management, it contributes to waste disposal, and supports sustainable development. In connection with this issue, the following sub-chapter examines waste and its connection with tourism in more detail.
Responsible consumption and sustainable tourism share a strong connection, serving as vital components for the industry’s long-term growth while preserving the environment. By embracing responsible consumption practices within tourism, we establish a foundation for sustainable development, which is crucial for mitigating adverse impacts on nature. As such, it is essential to incorporate responsible consumption into the waste management strategies of businesses and tourism destinations, thus ensuring that they align with sustainability goals and contribute to minimising negative consequences on the environment. Several authors deal with the issue of responsible consumption and pro-environmental behaviour (Han, 2021; Patwary, 2023; Wang et al., 2023; Stern, 2002; Soper, 2008; Bartošová and Musová, 2022; Hall, 2010; Sharpley, 2006; Goodwin and Font, 2011; Cavalheiro et al., 2020).
Responsible tourist behaviour can be motivated by the theory of planned behaviour and the theory of consumption values. The theory of planned behaviour deals with anticipated patterns of behaviour that are influenced by attitudes, subjective norms, and perceived control over behaviour. Therefore, tourists may exhibit environmentally responsible behaviour based on their attitudes towards nature conservation and ecological concerns and due to expected reactions from society and friends. On the other hand, the Consumer Value Theory focuses on the values that influence consumer decisions and preferences. Tourists can display responsible tourism behaviour based on their value orientations, such as environmental protection, social responsibility, and sustainability. These values can lead to a preference for environmentally sustainable destinations, services, and products. Together, these theories offer insight into the factors influencing tourists’ responsible behaviour and help them gain better understanding of their decision-making processes and preferences towards sustainable tourism (Hsu and Huang, 2012; Ulker-Demirel and Ciftci, 2020; Phau et al., 2014; Gallarza and Gil Saura, 2020; Wang and Ritchie, 2012).
This study employed a questionnaire to gather data from 324 tourists visiting Slovakia. The questionnaire was designed to measure their attitudes toward waste generation and behaviours related to sustainable tourism practices. Statistical analysis was used to test the relationship between these variables.
A questionnaire was constructed in Google Docs. This questionnaire aimed to gather insights from tourists visiting Slovakia. Following its creation, we electronically disseminated the questionnaire through various platforms, including MS Teams, email, and various social networks.
Through these channels, we successfully reached out to 324 respondents. Their participation and input provided valuable data for our study, enabling us to analyse and understand various aspects of tourism in Slovakia from the visitors’ perspective.
The substantial response rate reflects the tourists’ interest and engagement in contributing to our research efforts. This diverse pool of respondents enhances the comprehensiveness of our findings, enriching our understanding of tourists’ experiences and preferences in Slovakia. The research was conducted from December 2023 to January 2024.
The questionnaire was designed to capture consumers’ attitudes toward waste generation within tourism. It aimed to explore the participants’ behaviours and beliefs regarding responsible consumption and environmentally sustainable practices.
Selected attitudes present responsible consumption, leading to the minimisation of waste in the context of daily life and, at the same time, applicable in tourism:
A1: I am willing to prefer products with renewable or recyclable packaging.
A2: I am considering buying products with minimal packaging or no packaging.
A3: I am willing to buy ‘second-hand’ or use shared products instead of buying new ones.
A4: I am willing to follow ecological and sustainable certificates when choosing products.
A5: I prefer to carry my own packaging instead of the individual packaging of products sold directly in the store.
A6: I minimise waste by extending the life of the products I buy.
A7: I prefer to produce some products that thereby contribute to minimising waste.
A8: I am considering growing my food or buying from local farmers to minimise packaging and transport emissions.
A9: I monitor the waste my shopping produces and try to minimise delivery packaging.
A10: I am willing to look for accommodation that actively practices waste recycling.
A11: I am willing to prefer restaurants and catering facilities that use recyclable containers and dishes.
A12: I am willing to adapt my food and drink consumption to my actual consumption and thereby contribute to minimising waste.
A13: Minimising single-use plastic products such as straws or food packaging is essential.
A14: I am willing to take my reusable water bottle or coffee cup while travelling.
A15: I am interested in information about sustainable transport options while travelling.
A16: I am willing to use public transport to contribute to reducing the use of cars and thereby reduce emissions in the air.
A17: I am willing to buy souvenirs or products from local producers supporting sustainable practices.
A18: I am willing to volunteer for local programs to clean up the environment during my vacations and trips.
A19: I am willing to inform the neighbourhood about sustainable practices in my destination.
A20: I am willing to partially use digital technology, thereby supporting the minimisation of waste generation.
The research question “How do consumers’ attitudes towards waste generation in tourism correlate with their behaviours?” was formulated after studying the relevant literature and research papers.
Upon verifying the research question, we have formulated the following hypotheses:
H10: There is no statistically significant correlation between tourists’ attitudes towards waste generation and their waste management behaviours in tourism within Slovakia.
H1: T here is a statistically significant correlation between tourists’ attitudes towards waste generation and their waste management behaviours in tourism within Slovakia.
The respondents were given an opportunity to express their agreement /disagreement in the form of answers ‘yes/no’ and, at the same time, agree/disagree with the given attitude through a 5-point Likert scale, while the values are as follows: ‘1’ – completely disagree, ‘2’ – disagree, ‘3’ – neutral, ‘4’ – agree, ‘5’ – completely agree. We used several statistical methods to analyse the data.
Before performing the factor analysis, the Kaiser-Meyer-Olkin Test and the Bartlett’s Test of Sphericity were performed. The Kaiser-Meyer-Olkin Test was used to assess the suitability of the data for factor analysis. The KMO statistic is a measure of how suited the data is for factor analysis. The test checks the proportion of variance among variables that might be common variance. Higher KMO values (for example, above 0.4) indicate the suitability of the data for factor analysis. Bartlett’s Test of Sphericity was used to test whether the correlation matrix is significantly different from an identity matrix. If the p-value is less than a specified significance level (0.05), we reject the null hypothesis, thereby indicating that the correlation matrix is not identical.
• Significance: This method is used to identify patterns in many variables and reduce them to a smaller number of independent variables known as principal components.
• Calculation: PCA identifies principal components by calculating a correlation matrix and then applying a linear transformation to the data. It then selects the principal components with the highest eigenvalues that represent the explained variance of the data.
Following the factor analysis, Spearman’s correlation was used to explore direct relationships between the variables, such as the connection between tourists’ willingness to engage in waste reduction behaviours and their environmental attitudes. Its values range from ‘-1’ (perfect negative correlation) to ‘1’ (perfect positive correlation), with ‘0’ indicating no monotonic relationship between the variables.
These methods provided us with the necessary information about the data’s fit and the structure of the patterns in our research, allowing us to understand and interpret the results more accurately.
Factor analysis captures correlations between the variables in the data, although it does not do so while directly using correlation coefficients such as Pearson’s or Spearman’s coefficients. Instead, it identifies patterns or factors in the input data and determines how well those factors explain the variability in the data.
Correlations between variables are essential to factor analysis because this method seeks to identify hidden factors that lead to the patterns observed in the data. Strong correlations between variables indicate that these variables are likely part of the same factor. These relationships between the variables are then considered in factor analysis to estimate the interrelationships between the factors and the original variables.
Conversely, PCA focuses on reducing the dimensionality of data by transforming the original variables into a new set of variables called the principal components. These components are orthogonal, which means that they are uncorrelated and are ordered based on the amount of variance they explain. Although PCA does not directly measure correlations between variables, the initial correlations among variables influence the selection and composition of the principal components. Strong correlations between variables lead to more significant variability, which is better captured by principal components, and which results in a closer relationship between the original variables and certain principal components.
In summary, while factor analysis and PCA do not directly rely on correlation coefficients, they are indirectly influenced by the correlations between variables. Understanding these relationships is crucial for accurately interpreting the outcomes of factor analysis and PCA.
Two tests were conducted to ensure the suitability of the research variables before performing a factor analysis. To simplify the presentation, attitudes within the model were denoted as A1 to A20.
The Kaiser-Meyer-Olkin (KMO) adequacy Test was employed to assess the data appropriateness for factor analysis. The obtained results affirmed that all variables tapped into the same latent construct, and none were deemed unsuitable for subsequent analysis. Bartlett’s test of sphericity was applied to gauge the uniformity of the correlation matrix among the chosen variables. The findings of this test revealed significant correlations among variables, signalling the potential for factor analysis to unveil concealed relationships or factors within the dataset.
These initial tests provided robust validation of data suitability, setting a strong foundation for the ensuing factor analysis. They ensured a reliable exploration of latent constructs and interrelationships among the model’s simplified attitudes (A1 to A20).
|
KMO test |
0.858 |
|
|
Bartlett’s Test of Sphericity |
Chi-Square |
2624.762 |
|
df |
190 |
|
|
Sig. |
0 |
|
By utilising the Kaiser criterion, three factors were selected to explain 85.8% of the variability observed in the original manifest variables. Factor loadings exceeding 0.40 were considered significant, aiding in identifying the most influential items for each factor. A correlation analysis was conducted to examine the relationships between these factors, with significant correlations highlighted in blue in Table 2. A moderately strong positive correlation emerged between attitudes, thus indicating interconnectedness among consumer perceptions.
The most notable correlation was found between attitudes A10 and A11, revealing a propensity for consumers who actively seek accommodations practising waste separation to favour restaurants and catering establishments employing recyclable containers and dishes.
A5 and A2: The correlation between preferring to carry one’s packaging instead of individual packaging from the store (A5) and considering buying products with minimal packaging or no packaging (A2) suggests that individuals who prefer reusable packaging are also likely to choose products with minimal packaging, which indicates a commitment to waste reduction.
A11 and A10: The correlation between being inclined to prefer restaurants and catering facilities that use recyclable containers and dishes (A11) and being inclined to look for accommodations that actively practice waste recycling (A10) suggests a connection between preferences for sustainable dining options and eco-conscious accommodation choices. This correlation indicates a comprehensive commitment to sustainability in travelling dining and lodging experiences.
A14 and A13: The correlation between being inclined to take a reusable water bottle or coffee cup while travelling (A14) and minimising single-use plastic products such as straws or food packaging (A13) implies a connection between preferences for reusable containers during travel and efforts to reduce single-use plastics. This correlation suggests a consistent commitment to waste reduction and environmental conservation while travelling.
A15 and A16: The correlation between taking interest in sustainable transport options while travelling (A15) and the willingness to use public transport to reduce emissions (A16) suggests a connection between interests in sustainable transportation and preferences.
A18 and A19: The correlation between being eager to volunteer for local programs to clean up the environment during vacations and trips (A18) and being inclined to inform the neighbourhood about sustainable practices in the destination (A19) implies a connection between engagement in environmental volunteering and advocacy for sustainable practices. This correlation suggests that individuals who engage in environmental volunteering are also likely to advocate for sustainability within their communities.
Other correlations are shown in Table 2. Overall, these findings unveil underlying structures in consumer attitudes towards waste management practices, offering insights into the interplay between different aspects of environmental behaviour and consumer preferences.
|
Corr. |
A1 |
A2 |
A3 |
A4 |
A5 |
A6 |
A7 |
A8 |
A9 |
A10 |
A11 |
A12 |
A13 |
A14 |
A15 |
A16 |
A17 |
A18 |
A19 |
A20 |
|
A1 |
1.00 |
0.48 |
0.06 |
0.38 |
0.38 |
0.37 |
-0.05 |
0.23 |
0.24 |
0.21 |
0.29 |
0.35 |
0.17 |
0.32 |
0.46 |
0.38 |
0.10 |
0.19 |
0.21 |
0.24 |
|
A2 |
0.48 |
1.00 |
0.28 |
0.44 |
0.51 |
0.28 |
0.25 |
0.28 |
0.39 |
0.25 |
0.27 |
0.39 |
0.32 |
0.39 |
0.38 |
0.39 |
0.24 |
0.29 |
0.23 |
0.31 |
|
A3 |
0.06 |
0.28 |
1.00 |
0.26 |
0.26 |
0.24 |
0.28 |
0.15 |
0.21 |
0.11 |
0.26 |
0.11 |
0.23 |
0.21 |
0.21 |
0.36 |
0.18 |
0.21 |
0.20 |
0.10 |
|
A4 |
0.38 |
0.44 |
0.26 |
1.00 |
0.39 |
0.36 |
0.27 |
0.27 |
0.44 |
0.45 |
0.47 |
0.38 |
0.23 |
0.29 |
0.42 |
0.34 |
0.34 |
0.44 |
0.35 |
0.40 |
|
A5 |
0.38 |
0.51 |
0.26 |
0.39 |
1.00 |
0.36 |
0.17 |
0.16 |
0.31 |
0.27 |
0.22 |
0.23 |
0.23 |
0.35 |
0.31 |
0.36 |
0.14 |
0.26 |
0.39 |
0.31 |
|
A6 |
0.37 |
0.28 |
0.24 |
0.36 |
0.36 |
1.00 |
0.24 |
0.36 |
0.34 |
0.38 |
0.33 |
0.38 |
0.26 |
0.31 |
0.32 |
0.36 |
0.23 |
0.31 |
0.26 |
0.27 |
|
A7 |
-0.05 |
0.25 |
0.28 |
0.27 |
0.17 |
0.24 |
1.00 |
0.36 |
0.45 |
0.34 |
0.18 |
0.06 |
-0.03 |
-0.11 |
0.10 |
0.08 |
0.34 |
0.23 |
0.29 |
0.10 |
|
A8 |
0.23 |
0.28 |
0.15 |
0.27 |
0.16 |
0.36 |
0.36 |
1.00 |
0.44 |
0.40 |
0.30 |
0.38 |
0.27 |
0.26 |
0.29 |
0.19 |
0.37 |
0.33 |
0.19 |
0.15 |
|
A9 |
0.24 |
0.39 |
0.21 |
0.44 |
0.31 |
0.34 |
0.45 |
0.44 |
1.00 |
0.45 |
0.36 |
0.28 |
0.28 |
0.20 |
0.30 |
0.29 |
0.33 |
0.44 |
0.45 |
0.47 |
|
A10 |
0.21 |
0.25 |
0.11 |
0.45 |
0.27 |
0.38 |
0.34 |
0.40 |
0.45 |
1.00 |
0.61 |
0.31 |
0.21 |
0.15 |
0.30 |
0.19 |
0.36 |
0.40 |
0.47 |
0.35 |
|
A11 |
0.29 |
0.27 |
0.26 |
0.47 |
0.22 |
0.33 |
0.18 |
0.30 |
0.36 |
0.61 |
1.00 |
0.37 |
0.30 |
0.19 |
0.34 |
0.32 |
0.35 |
0.40 |
0.37 |
0.32 |
|
A12 |
0.35 |
0.39 |
0.11 |
0.38 |
0.23 |
0.38 |
0.06 |
0.38 |
0.28 |
0.31 |
0.37 |
1.00 |
0.34 |
0.47 |
0.42 |
0.39 |
0.24 |
0.22 |
0.11 |
0.26 |
|
A13 |
0.17 |
0.32 |
0.23 |
0.23 |
0.23 |
0.26 |
-0.03 |
0.27 |
0.28 |
0.21 |
0.30 |
0.34 |
1.00 |
0.56 |
0.40 |
0.40 |
0.40 |
0.21 |
0.25 |
0.28 |
|
A14 |
0.32 |
0.39 |
0.21 |
0.29 |
0.35 |
0.31 |
-0.11 |
0.26 |
0.20 |
0.15 |
0.19 |
0.47 |
0.56 |
1.00 |
0.44 |
0.48 |
0.32 |
0.21 |
0.12 |
0.22 |
|
A15 |
0.46 |
0.38 |
0.21 |
0.42 |
0.31 |
0.32 |
0.10 |
0.29 |
0.30 |
0.30 |
0.34 |
0.42 |
0.40 |
0.44 |
1.00 |
0.59 |
0.33 |
0.33 |
0.37 |
0.33 |
|
A16 |
0.38 |
0.39 |
0.36 |
0.34 |
0.36 |
0.36 |
0.08 |
0.19 |
0.29 |
0.19 |
0.32 |
0.39 |
0.40 |
0.48 |
0.59 |
1.00 |
0.29 |
0.34 |
0.38 |
0.30 |
|
A17 |
0.10 |
0.24 |
0.18 |
0.34 |
0.14 |
0.23 |
0.34 |
0.37 |
0.33 |
0.36 |
0.35 |
0.24 |
0.40 |
0.32 |
0.33 |
0.29 |
1.00 |
0.44 |
0.36 |
0.24 |
|
A18 |
0.19 |
0.29 |
0.21 |
0.44 |
0.26 |
0.31 |
0.23 |
0.33 |
0.44 |
0.40 |
0.40 |
0.22 |
0.21 |
0.21 |
0.33 |
0.34 |
0.44 |
1.00 |
0.62 |
0.40 |
|
A19 |
0.21 |
0.23 |
0.20 |
0.35 |
0.39 |
0.26 |
0.29 |
0.19 |
0.45 |
0.47 |
0.37 |
0.11 |
0.25 |
0.12 |
0.37 |
0.38 |
0.36 |
0.62 |
1.00 |
0.47 |
|
A20 |
0.24 |
0.31 |
0.10 |
0.40 |
0.31 |
0.27 |
0.10 |
0.15 |
0.47 |
0.35 |
0.32 |
0.26 |
0.28 |
0.22 |
0.33 |
0.30 |
0.24 |
0.40 |
0.47 |
1.00 |
|
Significant level (1-tailed), p-value < 0.05 |
||||||||||||||||||||
|
A1 |
|
0.00 |
0.14 |
0.00 |
0.00 |
0.00 |
0.17 |
0.00 |
0.00 |
0.00 |
0.00 |
0.00 |
0.00 |
0.00 |
0.00 |
0.00 |
0.04 |
0.00 |
0.00 |
0.00 |
|
A2 |
0.00 |
|
0.00 |
0.00 |
0.00 |
0.00 |
0.00 |
0.00 |
0.00 |
0.00 |
0.00 |
0.00 |
0.00 |
0.00 |
0.00 |
0.00 |
0.00 |
0.00 |
0.00 |
0.00 |
|
A3 |
0.14 |
0.00 |
|
0.00 |
0.00 |
0.00 |
0.00 |
0.00 |
0.00 |
0.02 |
0.00 |
0.03 |
0.00 |
0.00 |
0.00 |
0.00 |
0.00 |
0.00 |
0.00 |
0.04 |
|
A4 |
0.00 |
0.00 |
0.00 |
|
0.00 |
0.00 |
0.00 |
0.00 |
0.00 |
0.00 |
0.00 |
0.00 |
0.00 |
0.00 |
0.00 |
0.00 |
0.00 |
0.00 |
0.00 |
0.00 |
|
A5 |
0.00 |
0.00 |
0.00 |
0.00 |
|
0.00 |
0.00 |
0.00 |
0.00 |
0.00 |
0.00 |
0.00 |
0.00 |
0.00 |
0.00 |
0.00 |
0.01 |
0.00 |
0.00 |
0.00 |
|
A6 |
0.00 |
0.00 |
0.00 |
0.00 |
0.00 |
|
0.00 |
0.00 |
0.00 |
0.00 |
0.00 |
0.00 |
0.00 |
0.00 |
0.00 |
0.00 |
0.00 |
0.00 |
0.00 |
0.00 |
|
A7 |
0.17 |
0.00 |
0.00 |
0.00 |
0.00 |
0.00 |
|
0.00 |
0.00 |
0.00 |
0.00 |
0.15 |
0.32 |
0.02 |
0.03 |
0.08 |
0.00 |
0.00 |
0.00 |
0.04 |
|
A8 |
0.00 |
0.00 |
0.00 |
0.00 |
0.00 |
0.00 |
0.00 |
|
0.00 |
0.00 |
0.00 |
0.00 |
0.00 |
0.00 |
0.00 |
0.00 |
0.00 |
0.00 |
0.00 |
0.00 |
|
A9 |
0.00 |
0.00 |
0.00 |
0.00 |
0.00 |
0.00 |
0.00 |
0.00 |
|
0.00 |
0.00 |
0.00 |
0.00 |
0.00 |
0.00 |
0.00 |
0.00 |
0.00 |
0.00 |
0.00 |
|
A10 |
0.00 |
0.00 |
0.02 |
0.00 |
0.00 |
0.00 |
0.00 |
0.00 |
0.00 |
|
0.00 |
0.00 |
0.00 |
0.00 |
0.00 |
0.00 |
0.00 |
0.00 |
0.00 |
0.00 |
|
A11 |
0.00 |
0.00 |
0.00 |
0.00 |
0.00 |
0.00 |
0.00 |
0.00 |
0.00 |
0.00 |
|
0.00 |
0.00 |
0.00 |
0.00 |
0.00 |
0.00 |
0.00 |
0.00 |
0.00 |
|
A12 |
0.00 |
0.00 |
0.03 |
0.00 |
0.00 |
0.00 |
0.15 |
0.00 |
0.00 |
0.00 |
0.00 |
|
0.00 |
0.00 |
0.00 |
0.00 |
0.00 |
0.00 |
0.02 |
0.00 |
|
A13 |
0.00 |
0.00 |
0.00 |
0.00 |
0.00 |
0.00 |
0.32 |
0.00 |
0.00 |
0.00 |
0.00 |
0.00 |
|
0.00 |
0.00 |
0.00 |
0.00 |
0.00 |
0.00 |
0.00 |
|
A14 |
0.00 |
0.00 |
0.00 |
0.00 |
0.00 |
0.00 |
0.02 |
0.00 |
0.00 |
0.00 |
0.00 |
0.00 |
0.00 |
|
0.00 |
0.00 |
0.00 |
0.00 |
0.02 |
0.00 |
|
A15 |
0.00 |
0.00 |
0.00 |
0.00 |
0.00 |
0.00 |
0.03 |
0.00 |
0.00 |
0.00 |
0.00 |
0.00 |
0.00 |
0.00 |
|
0.00 |
0.00 |
0.00 |
0.00 |
0.00 |
|
A16 |
0.00 |
0.00 |
0.00 |
0.00 |
0.00 |
0.00 |
0.08 |
0.00 |
0.00 |
0.00 |
0.00 |
0.00 |
0.00 |
0.00 |
0.00 |
|
0.00 |
0.00 |
0.00 |
0.00 |
|
A17 |
0.04 |
0.00 |
0.00 |
0.00 |
0.01 |
0.00 |
0.00 |
0.00 |
0.00 |
0.00 |
0.00 |
0.00 |
0.00 |
0.00 |
0.00 |
0.00 |
|
0.00 |
0.00 |
0.00 |
|
A18 |
0.00 |
0.00 |
0.00 |
0.00 |
0.00 |
0.00 |
0.00 |
0.00 |
0.00 |
0.00 |
0.00 |
0.00 |
0.00 |
0.00 |
0.00 |
0.00 |
0.00 |
|
0.00 |
0.00 |
|
A19 |
0.00 |
0.00 |
0.00 |
0.00 |
0.00 |
0.00 |
0.00 |
0.00 |
0.00 |
0.00 |
0.00 |
0.02 |
0.00 |
0.02 |
0.00 |
0.00 |
0.00 |
0.00 |
|
0.00 |
|
A20 |
0.00 |
0.00 |
0.04 |
0.00 |
0.00 |
0.00 |
0.04 |
0.00 |
0.00 |
0.00 |
0.00 |
0.00 |
0.00 |
0.00 |
0.00 |
0.00 |
0.00 |
0.00 |
0.00 |
|
When using the principal component analysis (PCA) method, we focused on eigenvalues which indicate the total explained variance for each principal component. The findings are shown in Table 3:
• Component 1: eigenvalue of 6.84, explaining 34.22% of the total variance.
• Component 2: eigenvalue of 1.95, explaining 9.76% of the total variance.
• Component 3: eigenvalue of 1.27, representing 5.86% of the total variance.
|
Comp. |
Initial eigenvalues |
Extraction sums of squared loadings |
||||
|
Total |
% of Variance |
Cumulative % |
Total |
% of Variance |
Cumulative % |
|
|
A1 |
6.843 |
34.216 |
34.216 |
6.843 |
34.216 |
34.216 |
|
A2 |
1.952 |
9.760 |
43.976 |
1.952 |
9.760 |
43.976 |
|
A3 |
1.269 |
6.346 |
50.323 |
1.269 |
6.346 |
50.323 |
|
A4 |
1.204 |
6.020 |
56.343 |
1.204 |
6.020 |
56.343 |
|
A5 |
1.170 |
5.852 |
62.195 |
1.170 |
5.852 |
62.195 |
|
A6 |
0.898 |
4.488 |
66.683 |
|
|
|
|
A7 |
0.776 |
3.879 |
70.562 |
|
|
|
|
A8 |
0.738 |
3.689 |
74.251 |
|
|
|
|
A9 |
0.676 |
3.379 |
77.630 |
|
|
|
|
A10 |
0.608 |
3.041 |
80.671 |
|
|
|
|
A11 |
0.578 |
2.892 |
83.563 |
|
|
|
|
A12 |
0.538 |
2.692 |
86.255 |
|
|
|
|
A13 |
0.461 |
2.305 |
88.560 |
|
|
|
|
A14 |
0.423 |
2.117 |
90.676 |
|
|
|
|
A15 |
0.387 |
1.935 |
92.612 |
|
|
|
|
A16 |
0.355 |
1.775 |
94.387 |
|
|
|
|
A17 |
0.342 |
1.712 |
96.099 |
|
|
|
|
A18 |
0.309 |
1.545 |
97.644 |
|
|
|
|
A19 |
0.264 |
1.322 |
98.966 |
|
|
|
|
A20 |
0.207 |
1.034 |
100.000 |
|
|
|
We extracted the same number of components as the items; the values in the ‘Extracted sums of squared loadings’ column match those in the ‘Initial eigenvalues’ column. Our primary objective in this research was to reduce variables while retaining as much meaningful variance as possible.
These results demonstrate how each principal component explains the variance within the dataset. By identifying and prioritising components with higher eigenvalues, we effectively capture and summarise the most significant patterns and relationships which are present in the data. This reduction of variables facilitates a more manageable and insightful analysis, aligning with our research objectives.
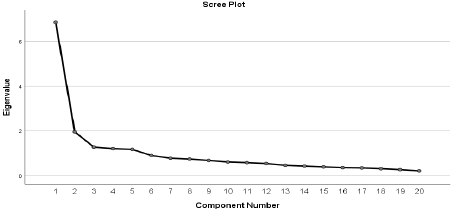
Five components were identified based on the criterion (these components should have eigenvalues greater than 1). The values are shown in Figure 1.
Based on the obtained results, we can interpret the following findings. Generally, the first component achieves the highest total variance, while the final component achieves the lowest value. However, all three components reach values higher than the eigenvalue.
Five components reach a value higher than 1. The break occurs in component 6, where the variance reaches a value lower than 1.
|
A1 |
A2 |
A3 |
A4 |
A5 |
|
0.525 |
-0.380 |
-0.349 |
0.221 |
-0.307 |
|
0.629 |
-0.215 |
-0.218 |
0.338 |
0.109 |
|
0.396 |
0.011 |
0.039 |
0.183 |
0.683 |
|
0.691 |
0.079 |
-0.178 |
0.085 |
-0.106 |
|
0.565 |
-0.145 |
-0.446 |
0.195 |
0.195 |
|
0.595 |
-0.032 |
0.018 |
0.269 |
-0.092 |
|
0.366 |
0.617 |
0.113 |
0.427 |
0.273 |
|
0.539 |
0.174 |
0.448 |
0.327 |
-0.179 |
|
0.658 |
0.337 |
-0.033 |
0.097 |
-0.017 |
|
0.625 |
0.394 |
0.061 |
-0.019 |
-0.334 |
|
0.630 |
0.173 |
0.083 |
-0.111 |
-0.244 |
|
0.579 |
-0.324 |
0.243 |
0.167 |
-0.325 |
|
0.543 |
-0.340 |
0.383 |
-0.284 |
0.160 |
|
0.551 |
-0.574 |
0.255 |
-0.084 |
0.093 |
|
0.669 |
-0.290 |
0.002 |
-0.125 |
-0.006 |
|
0.645 |
-0.343 |
-0.049 |
-0.144 |
0.266 |
|
0.564 |
0.199 |
0.441 |
-0.219 |
0.120 |
|
0.633 |
0.312 |
-0.074 |
-0.316 |
0.043 |
|
0.615 |
0.354 |
-0.280 |
-0.403 |
0.125 |
|
0.569 |
0.099 |
-0.302 |
-0.340 |
-0.138 |
A component matrix related to principal component analysis (PCA) presents each row of the matrix representing one of the original variables, while the columns represent individual principal components. Values in individual cells indicate weights, respectively. The contributions of the original variables refer to the individual principal components. For example, a value of 0.525 in the first row and first column means that the first variable positively contributes to the first principal component. Likewise, a value of -0.38 in the first row and second column means that the first variable negatively contributes to the second principal component. The results are shown in Table 4.
The findings of the study highlight significant correlations between consumer attitudes and behaviours regarding waste management in tourism, particularly concerning the reduction of waste. Spearman’s correlation analysis revealed moderate to strong positive relationships among the key attitudes. For example, the correlation between the respondents’ willingness to use reusable packaging and their preference for products with minimal or no packaging (A5 and A2) underscores a consistent commitment to waste reduction. This suggests that those who prioritise sustainable packaging choices also tend to align their broader consumption habits with environmental concerns, thereby reinforcing their dedication to reducing waste. The use of PCA further simplified the complex interrelations by reducing the dataset into principal components, thus making it easier to identify the core patterns in consumer behaviour. The first component, which captured the highest variance, reflects the overarching trend of sustainable practices among consumers. The eigenvalues associated with the principal components highlight that a significant portion of the variance in waste management attitudes can be attributed to a few key factors, such as the willingness to choose environmentally responsible accommodations (A10) and dining options (A11), as these were strongly correlated in both the correlation analysis and the PCA results.
We rejected the null hypothesis based on our results.
In our result, a correlation analysis revealed a moderately strong positive correlation among consumer attitudes.
The identified correlations emphasise the interconnectedness of various attitudes towards sustainability in the context of consumer behaviour and travel preferences.
Firstly, the correlation between preferring reusable packaging (A5) and considering products with minimal or no packaging (A2) underscores interest of individuals in waste reduction. This suggests that those inclined towards using reusable packaging are also likely to opt for products that align with their environmental values, which indicates a cohesive approach to minimising waste.
Similarly, the correlation between the willingness to patronise restaurants and catering facilities employing recyclable containers (A11) and actively seeking accommodations that practice waste recycling (A10) highlights a holistic interest in sustainability in travel-related dining and lodging experiences. This correlation implies that individuals prioritising eco-friendly dining options are also inclined to select accommodation providers with similar environmental practices, thus reinforcing their dedication to sustainable living.
Furthermore, the correlation between carrying reusable containers while travelling (A14) and minimising single-use plastics (A13) suggests a conscientious effort to reduce waste and preserve the environment during travel. This linkage implies that individuals who embrace reusable alternatives for beverages and food containers are also likely to actively reduce their reliance on single-use plastics, thereby promoting environmentally friendly habits while on the go.
Moreover, the correlation between taking interest in sustainable transportation options while traveling (A15) and willingness to utilise public transport to mitigate emissions (A16) underscores a connection between environmental consciousness and transportation preferences. This suggests that individuals interested in sustainable travel are more inclined to adopt eco-friendly modes of transportation, thus contributing to their efforts aimed at reducing carbon footprints during travel.
Lastly, the correlation between volunteering for local environmental cleanup programs during vacations (A18) and advocating for sustainable practices within communities (A19) suggests a synergistic relationship between environmental engagement and advocacy. This implies that individuals actively involved in ecological volunteering are also likely to champion sustainability initiatives within their communities, thus fostering a culture of environmental stewardship beyond individual actions.
Overall, these correlations highlight the multifaceted nature of sustainability attitudes and behaviours, emphasising the importance of integrated approaches towards fostering environmentally responsible lifestyles at home and during travel.
Additionally, we conducted principal component analysis (PCA) focused on eigenvalues. It indicated the total explained variance for each principal component. The first component explained the highest total variance, with the subsequent components explaining decreasing amounts of variance. Five components (A1–A5) had eigenvalues greater than 1, while the break occurred before the sixth component (A6), where the variance fell below 1.
The component matrix related to PCA illustrated the contributions of original variables to individual principal components. Each row represented one of the original variables, with the columns representing individual principal components. Positive and negative values in the matrix indicated the direction and strength of each variable’s contribution to the components. These findings offer insights into the underlying structures of consumer attitudes towards waste management practices and the interplay between environmental behaviour and consumer preferences.
Our results are similar to above-cited studies. Our findings emphasise the importance of individuals’ relationships with the environment, and how these influence their travel decisions. The following similarities have been observed:
• Interest in environmentally responsible behaviour. Our findings highlight the growing interest among consumers in environmentally responsible behaviour, such as waste reduction and recycling, reflecting a positive attitude towards sustainability (Liobikienė and Juknys, 2016; Thøgersen, 2006).
• Support for sustainable initiatives. Our findings highlight how consumers are positive about implementing sustainable waste policies, indicating a preference for environmentally friendly practices (Padilla and Trujillo, 2020).
• Importance of education and awareness. Our findings recognise the role of education and awareness in shaping consumer attitudes towards waste management and sustainable behaviour, suggesting that greater sensitivity to environmental issues contributes to positive attitudes (Šuškevičė and Kruopienė, 2021; Coelho et al., 2020).
• Behaviour influencing waste management. Our findings emphasise how consumer behaviour directly influences waste management practices in tourism entities and destinations, highlighting the importance of individual actions in promoting environmentally responsible behaviour (Coelho et al., 2020; Ezeah et al., 2015).
• The connection between pro-environmental behaviour and waste management. Our findings highlight that pro-environmental behaviour, such as waste sorting and minimising single-use plastics, is essential for sustainable waste management and environmental preservation (Ulusoy, 2016; Xiong, 2023).
To sum up, our findings underscore the significance of consumer attitudes and behaviours in promoting sustainability and waste reduction in the context of travel, reflecting a shared understanding of the importance of responsible consumption practices and environmental stewardship.
The research has identified certain limitations. The principles of sample surveys are essential for research, as conducting a study on the entire primary population would be impractical due to the extensive physical, time, and financial resources required. We can apply survey results to the entire base population by using the induction method and ensure that specific criteria are met, such as the sample’s representativeness and matching the base set’s parameters. In the course of conducting the survey, we identified several limitations. Firstly, lengthy, or time-consuming questionnaires can exhaust the respondents and affect their ability to provide accurate answers. Secondly, there is a limitation in relying on the respondents’ memory, as their ability to recall events or experiences accurately may be limited. Additionally, the fear of the researcher’s failure to maintain anonymity may lead to dishonest answers or refusal to participate in the survey. Finally, unexpected external events such as political, economic, or social changes can affect the research environment and consequently impact the results.
To justify the representativeness of the sample, we calculated the minimum sample size required for a population of tourists in Slovakia. Given a significance level of 95% and a margin of error of 5%, a sample size of 384 respondents is representative, assuming a normal distribution. Although the ideal representative sample for Slovakia’s population (over 5 million people) should be approximately 384 respondents, a sample size of 324 is still considered sufficiently representative. The margin of error for a sample size of 324 respondents for a population of 5 million, at a 95% confidence level, is approximately 5.44%. This means that the results from this sample are expected to reflect the population’s responses with an error margin of ±5.44%The difference of around 0.44% is relatively small, and its impact on the accuracy of the findings is minimal. Discussions within the research team indicated that such a difference in the sample size rarely leads to significant changes in the conclusions or interpretations of the research. With a confidence interval of a 5% margin of error, the sample size of 324 is close enough to the ideal value, thereby ensuring the relevance and reliability of the obtained results. Based on these considerations, we conclude that the sample size of 324 is appropriate for this study and provides credible data for analysing consumer behaviour in Slovakia.
Although similar findings were obtained, the importance of further research must be emphasised. Consumer attitudes and behaviours towards sustainability and waste management are continuously changing. As societal awareness of environmental issues is growing and new trends are emerging, updated studies are needed to capture these changes accurately.
Consumer sustainability and waste management behaviours can vary significantly across regions and cultures. Conducting additional studies allows researchers to explore these differences comprehensively and tailor interventions or policies accordingly. With technological advancements and the emergence of new trends, such as the rise of eco-friendly products or sustainable tourism practices, there is a need to investigate their impact on consumer behaviour. A new study can provide insights into how these trends influence consumer attitudes and decision-making processes.
The understanding of consumer attitudes towards sustainability and waste management significantly impacts businesses, governments, and other stakeholders. Additional research can help policymakers devise more effective strategies to promote sustainable practices and address environmental challenges. While there is existing research on consumer attitudes towards sustainability and waste management in the context of travel, there may still be gaps and/or unanswered questions that warrant further investigation. A new study can contribute to filling these gaps and advancing knowledge in the field.
This study addresses the scientific problem of understanding the interconnectedness of various attitudes towards sustainability in the context of consumer behaviour and travel preferences. By identifying correlations between different sustainability attitudes, the study contributes to a deeper understanding of how these attitudes influence consumer choices and behaviours during travel.
Our results underscore that consumers are interested in environmentally responsible behaviour and are willing to take responsibility for their waste. For example, consumers are inclined to use reusable packaging and prefer recyclable materials that contribute to waste reduction. Some consumers are interested in energetically participating in volunteer activities aimed at cleaning and caring for the environment in tourist places. As part of travel planning, consumers can also evaluate the waste policies of destinations. Destinations with a clear and effective waste policy may be preferred in their decision-making.
The results provide valuable insights by advancing our understanding of sustainable tourism and consumer behaviour. Entrepreneurs can benefit from these findings by understanding the consumer preferences better and making informed decisions so that to align their businesses with sustainability goals. Moreover, society can benefit from the promotion of environmentally friendly behaviours and the preservation of natural resources in tourism destinations.
However, it is essential to emphasise that, due to a limited number of currently available studies in this area, continuing research in sustainable tourism and consumer behaviour is vital. The identified correlations highlight the interconnectedness of attitudes towards sustainability and travel preferences, emphasising the need for further investigation. Additional research can validate and extend these findings across different contexts, while uncovering nuanced relationships. Moreover, further research can identify effective interventions for promoting sustainable tourism behaviour and monitor changes over time in consumer attitudes. Collaboration and knowledge exchange within academia, industry, and policymaking are essential for advancing sustainable tourism practices.
The authors do not have any competing financial, professional, or personal interests in relation to any other parties within the scope of this research.
Amicarelli, V., Aluculesei, A. C., Lagioia, G., Pamfilie, R. & Bux, C. (2022). How to manage and minimize food waste in the hotel industry: an exploratory research. International Journal of Culture, Tourism and Hospitality Research, 16(1), 152–167. https://doi.org/10.1108/IJCTHR-01-2021-0019
Amundson, A. V. (2022). A multi-stakeholder partnership to fight food waste in the hospitality industry: a contribution to the United Nations Sustainable Development Goals 12 and 17. Journal of Sustainable Tourism, 30(10), 2448-2475. https://doi.org/10.1080/09669582.2020.1849232
Bartošová, S., Musová, Z. (2022). Environmentally responsible consumer behavior in the context of circular economy principles. Ekonomika a spoločnosť, 23(1), 142–164, https://doi.org/10.24040/eas.2022.23.1.142-164
Cakoci, R., Kasagranda, A., & Tolmáči, L. (2014). Cestovný ruch na Slovensku. Regionálne dimenzie Slovenska, (1), 479-496, https://doi.org/10.13140/2.1.4413.9204
Cao, J., Qiu, H., Morrison, A. M., & Wei, W. (2022). The Role of Social Capital in Predicting Tourists’ Waste Sorting Intentions in Rural Destinations: Extending the Theory of Planned Behavior. International Journal of Environmental Research and Public Health, 19(19):12789, 1–20. https://doi.org/10.3390/ijerph191912789
Cavalheiro, B. M., Joia, L. A., Marcuzzo D. C. C. G. (2020). Towards a Smart Tourism Destination Development Model: Promoting Environmental, Economic, Socio-cultural and Political Values. Tourism Planning & Development, 17(3), 237-259, https://doi.org/10.1080/21568316.2019.1597763
Coelho, P. M. et al. (2020). Sustainability of reusable packaging–Current situation and trends. Resources, 6(100037), 1-11. https://doi.org/10.1016/j.rcrx.2020.100037
Ezeah, Ch. et al. (2015). Tourism Waste Management in the European Union: Lessons Learned from Four Popular EU Tourist Destinations. American Journal of Climate Change, 4(5), 1-15. https://www.scirp.org/html/4-2360302_61933.htm
Gallarza, G. M., Saura, G. I. (2020). Consumer value in tourism: a perspective article. Tourism Review, 75(1), 41-44, https://doi.org/10.1108/TR-06-2019-0227
Goodwin, H., Font, X. (2011). Progress in Sustainable Tourism. Responsible Tourism, 1, https://haroldgoodwin.info/resources/PiRT1(1).pdf
Hall, M. C. (2010). Tourism and biodiversity: More significant than climate change? Journal of Heritage Tourism, 5(4), 253-266, https://doi.org/10.1080/1743873X.2010.517843
Han, H. (2021). Consumer behavior and environmental sustainability in tourism and hospitality: a review of theories, concepts, and latest research. Journal of Sustainable Tourism, 29(7), 1021–1042. https://doi.org/10.1080/09669582.2021.1903019
Herrero, C. C., Laso, J., Cristóbal, J., Palmer, P. F., Albertí, J., Fullana, M., Herrero, Á., Margallo, M., Aldaco, R. (2022). Tourism under a life cycle thinking approach: A review of perspectives and new challenges for the tourism sector in the last decades. Science of The Total Environment, 845:157261, 1–14. https://doi.org/10.1016/j.scitotenv.2022.157261
Hsu, H. C. C., Huang, S. (2012). An extension of the theory of planned behavior model for tourists. Journal of Hospitality & Tourism Research, 36(3), 390-417, https://doi.org/10.1177/1096348010390817
Juvan, E., Dolnicar S. (2016). Measuring environmentally sustainable tourist behaviour. Annals of Tourism Research, 59, 30-44.
Liobikienė, G., Juknys, R. (2016). The role of values, environmental risk perception, awareness of consequences, and willingness to assume responsibility for environmentally-friendly behaviour: the Lithuanian case. Journal of Cleaner Production, 112(4), 3413-3422. https://doi.org/10.1016/j.jclepro.2015.10.049
Liu, T., Juvan, E., Qiu, H., & Dolnicar, S. (2022). Contextand culture-dependent behaviors for the greater good: a comparative analysis of plate waste generation. Journal of Sustainable Tourism, 30(6), 1200–1218. https://doi.org/10.1080/09669582.2021.1918132
Markose, N., Bindu, V. T., & Babu G. (2022). Sustainability Initiatives for Green Tourism Development: The Case of Wayanad, India. Journal of Risk and Financial Management, 15(2):52, 1–13. https://doi.org/10.3390/jrfm15020052
Padilla, A., Trujillo, J. (2018). Waste disposal and households’ heterogeneity. Identifying factors shaping attitudes towards source-separated recycling in Bogotá, Colombia. Waste Management, 74, 16-33. https://doi.org/10.1016/j.wasman.2017.11.052
Patwary, K. A. (2023). Examining environmentally responsible behaviour, environmental beliefs, and conservation commitment of tourists: a path towards responsible consumption and production in tourism. Environmental Science and Pollution Research, 30, 5815–5824, https://doi.org/10.1007/s11356-022-22577-w
Phau, I., Quintal, V., Shanka, T. (2014). Examining a consumption values theory approach of young tourists toward destination choice intentions. International Journal of Culture, Tourism and Hospitality Research, 8(2), 125-139, https://doi.org/10.1108/IJCTHR-12-2012-0090
Sharpley, R. (2006). Ecotourism: A consumption perspective. Journal of Ecotourism, 5(1–2), 7–22, https://doi.org/10.1080/14724040608668444
Soper, K. (2008) Alternative Hedonism, Cultural Theory, and the Role of Aesthetic Revisioning. Cultural Studies, 22(5), 567-587, https://doi.org/10.1080/09502380802245829
Stern, C. P. (2002). New Environmental Theories: Toward a Coherent Theory of Environmentally Significant Behavior. Journal of Social Issues, 56(3), 407-424, https://doi.org/10.1111/0022-4537.00175
Štrba, Ľ., Kolačkovská, J., Kršák, B., Sidor, C., Lukáč, M. (2022). Perception of the Impacts of Tourism by the Administrations of Protected Areas and Sustainable Tourism (Un)Development in Slovakia. Sustainability, 14(11), 1-20, https://doi.org/10.3390/su14116696
Šuškevičė, V. – Kruopienė, J. (2021). Improvement of Packaging Circularity through the Application of Reusable Beverage Cup Reuse Models at Outdoor Festivals and Events. Sustainability, 13(1), 247. https://doi.org/10.3390/su13010247
Thøgersen, J. (2006). Norms for environmentally responsible behaviour: An extended taxonomy. Journal of Environmental Psychology, 26(4), 247-261. https://doi.org/10.1016/j.jenvp.2006.09.004
Ulker, D. E., Ciftci, G. (2020). A systematic literature review of the theory of planned behavior in tourism, leisure, and hospitality management research. Journal of Hospitality and Tourism Management, 43, 209-219, https://doi.org/10.1016/j.jhtm.2020.04.003
Ulusoy, E. (2016). Experiential responsible consumption. Journal of Business Research, 69(1), 284–297. https://doi.org/10.1016/j.jbusres.2015.07.041
Wang, J., Ritchie, W. B. (2012). Understanding accommodation managers’ crisis planning intention: An application of the theory of planned behaviour. Tourism Management, 33(5), 1057-1067, https://doi.org/10.1016/j.tourman.2011.12.006
Xiong, W., Huang, M., Leung, Zhang, Y., Cai, X. (2023). How environmental emotions link to responsible consumption behavior: Tourism Agenda 2030. Tourism Review, 78(2), 517-530, https://doi.org/10.1108/TR-01-2022-0010