Ekonomika ISSN 1392-1258 eISSN 2424-6166
2024, vol. 103(4), pp. 39–60 DOI: https://doi.org/10.15388/Ekon.2024.103.4.3
Heba Ezzeldin Helmy
October University for Modern Sciences and Arts (MSA), Egypt
Email: hezz@msa.edu.eg
ORCID ID: https://orcid.org/0000-0003-4628-614X
Abstract. The Egyptian pound (LE) has experienced multiple devaluations over the last few years. One of the proclaimed causes was the severe rise in the prices of Egypt’s two main imports – wheat and oil – that followed the eruption of the Russian-Ukraine war and inflated Egypt’s import bill, resulting in an increased shortage of the US dollars and creating downward pressures on the LE. Using a nonlinear autoregressive distributed lag (NARDL) method we probe whether an asymmetric relationship exists between Egypt’s exchange rate and each of the international prices of oil and wheat. Short-run asymmetric effects of oil and wheat prices on Egypt’s currency rate were found, as the latter rose in response to upsurges in the oil price and fell in response to downturns in the price of wheat, with no impacts from the opposite changes in the short run. Oil price rises may thus temporarily function as a weak hedge for the LE.
Keywords: Exchange rate, Oil price, Wheat price, ARDL, NARDL, Egypt
_________
Received: 12/08/2024. Revised: 09/09/2024. Accepted: 26/10/2024
Copyright © 2024 Heba Ezzeldin Helmy. Published by Vilnius University Press
This is an Open Access article distributed under the terms of the Creative Commons Attribution License, which permits unrestricted use, distribution, and reproduction in any medium, provided the original author and source are credited.
_________
Over the past few years, the Egyptian pound (LE) has been devalued multiple times. One of the proclaimed causes was the severe rise in the prices of Egypt’s two main imports – wheat and oil – that followed the eruption of the Russian-Ukraine war and inflated Egypt’s import bill, resulting in an increased shortage of the US dollars and creating new downward pressures on the LE. Nonetheless, the mitigation of the prices of the two aforementioned products one year after the war did not seem to have affected positively the exchange rate, sparking debate over the linearity of oil- and wheat-LE relationships. Complicating the nexus is the fact that Egypt is both an importer and exporter of crude oil and wheat. In 2021, Egypt’s exports of crude oil reached $3.69 billion, while its crude oil imports were valued at $3.13 billion (OEC, n.d.-a). This means that Egypt’s crude oil trade surplus in 2021 amounted to $0.56 billion, a situation dissimilar to that that had existed several years earlier when Egypt was a net importer of crude oil. Concerning wheat, Egypt is considered its number one importer worldwide with imports valued at $4.53 billion and exports at $19,000 in 2021 (OEC, n.d.-b). Accordingly, any alterations in the international prices of oil and wheat will impact the total value of Egypt’s imports and exports, its current account, and ultimately its exchange rate. Despite the importance of that issue to Egypt, a major research problem lies in the fact that no study has ever assessed whether or not the final net impact on the exchange rate resulting from such changes is symmetric or asymmetric. Many researchers examining the oil price and currency rate association have assumed a linear relationship. Linearity in the commodity price and exchange rate relationship has been recently criticized by many researchers as commodity prices have been behaving like financial prices over the past years (Jain and Biswal, 2016). Our paper fills this extremely important lacuna in the literature as it is the only paper that simultaneously tackles the asymmetric impacts on Egypt’s currency rate arising from global oil and wheat price variations.
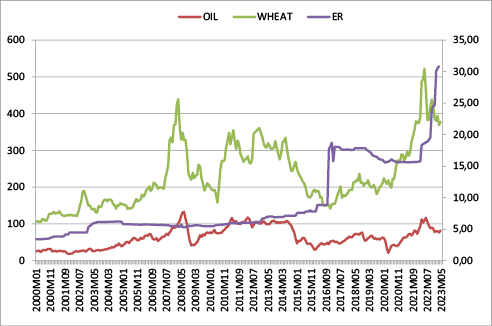
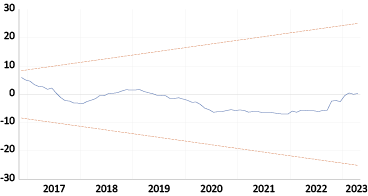
Historical trends of the nominal LE from 2000 to 2023 and the global prices of wheat and crude oil (in US dollars) (Figure 1 with the nominal LE having the acronym ER and equivalent to LEs per 1 US dollar), do not pinpoint to a definite positive or negative relationship among the two commodities’ prices and the exchange rate. However, knowing that Egypt adopts a de facto managed float exchange rate regime implies that the LE does not float freely to account for short-term changes in its market value. Since most pressures on the LE are downward rather than upward, this connotes that whenever the pressures accumulate and the overvalued LE becomes unsustainable, authorities permit the LE to slump, as what happened when the LE/US dollar fell from 8.8 to 17.7 in November 2016, from 19.5 to 24 in October 2022, and from 24.7 to 30.1 in January 2023 (CBE Exchange Rates Historical Data, n.d.). Such slumps are evident in Figure 1.
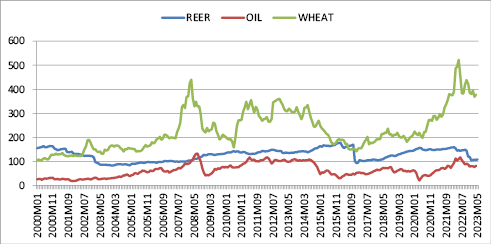
To disclose such obfuscated impacts that do not appear in the official rate until it is allowed to depreciate, it may be beneficial to compare oil and wheat prices with Egypt’s real effective exchange rate (Figure 2 with the real exchange rate having the acronym REER). REER measures a CPI-based price of a currency against some selected other currencies. As evident from Figure 2, devaluations in the previously mentioned periods returned the REER index to 100. Otherwise, the REER kept on appreciating above its market value marking the overvaluation of the LE. Strangely enough, while no clear impact seems to be from oil prices on REER, a negative relation sometimes appears from wheat prices to REER. The periods 2000–2003, 2007–2016, and 2016–2023 provide some evidence of this negative relation. The negative relation means that as the international price of wheat falls REER rises or the LE becomes overvalued. In other words, the decrease in wheat prices creates a downward pressure on the LE. This is strange as it is expected that the rising – not the falling – price of wheat would mount pressure on the LE through its impact on the import bill.
The absence of a clear linear relationship between the two commodities’ prices with the LE pinpoints a potential asymmetric association. Our paper, therefore, inspects the asymmetric links between the LE and the international prices of oil and wheat, a topic hitherto ignored by researchers. The first step involves analyzing the relationships in both the short and long runs between the two variables and the LE exchange rate using Pesaran et al. (2001) linear autoregressive distributed lag (ARDL) model. Subsequently, we conduct a nonlinear ARDL (henceforth NARDL) model of Shin et al. (2014) to probe the short-term and long-term asymmetries in the exchange rate interconnections with each of the two variables. The study concludes that the short-term relationships between the LE and the prices of wheat and oil are asymmetric, with the LE appreciating due to the rising crude oil price, and depreciating due to the falling price of wheat. The opposite changes have no short-term influences on the LE. The results are very important to policymakers as they imply that the rising price of oil can act as a weak hedge for the LE in the short run. After this introduction, the theoretical background and the literature on the asymmetric effects of wheat and oil prices on the exchange rate are reviewed in Section 2. We present our methodology, our data set description, and the necessary diagnostic tests in Section 3. We go over the empirical analysis and findings in Section 4. In Section 5, we wrap up, go over the policy implications, and make some suggestions for potential future developments on the topic.
The difficulty in understanding the relationship between oil prices and the exchange rate lies in the fact that causation can run in both directions and can either be positive or negative. Economic theory suggests that several transmission channels of oil prices and exchange rates exist: the wealth effect channel, the portfolio reallocation channel, the expectations channel, and the terms of trade channel (Buetzer, 2016). The wealth and portfolio channels suggest a relationship between the nominal exchange rate and the nominal oil price, while the expectations channel allows for causalities between the nominal variables in both directions. The terms of trade channel primarily focuses on the link between real oil prices and real exchange rates.
The portfolio and wealth channel, which was first proposed by Golub (1983) and Krugman (1983), focuses on the dynamics of nominal exchange rates. Its basic idea is that if the price of oil increases, wealth is transferred to oil-exporting countries as a result of the higher exports revenues, which is translated to an amelioration in the current account balance, and a subsequent appreciation of the local nominal currency (Bénassy-Quéré et al., 2007). At the same time, an increase in the oil price results in a decline in the trade balance in net oil-importing countries, which could lead to local currency depreciation. The portfolio channel evaluates the medium- and long-term effects, while the wealth channel reflects the ensuing short-run effect. Notwithstanding, the expectations channel allows for causalities between the nominal variables in both directions. What complicates interpreting the impact of this channel with respect to Egypt is that it is both an importer and exporter of crude oil as previously mentioned.
The terms of trade channel primarily focuses on the link between real oil prices and exchange rates. Its fundamental concept is to relate oil prices to price levels, which have an impact on real exchange rates (Benassy-Quere et al., 2007). If two countries trade while the former relies more on oil for production than the latter, then if the price of oil rises, the output price of the former’s country nontradable sector will rise in relation to the output price of the latter (if it is more energy-intensive than the tradable sector). This suggests that greater inflation causes the former’s country real exchange rate to appreciate relative to the latter (Chen and Chen, 2007). The nominal exchange rate will suffer if the presumption that the price of tradable goods is internationally fixed is abandoned. If the price of oil increases, we expect the currencies of countries whose tradeable sector heavily depends on oil to depreciate in reaction to growing inflation. Therefore, changes in the nominal exchange rate and the impact of any changes in the prices of the previously mentioned traded and nontraded goods will determine how the real exchange rate responds. Overall, the causality present in the terms of trade channel may vary depending on how prices are adjusted (Beckmann, 2020).
The theoretical context of the oil price and exchange rate nexus can be generalized to encompass wheat in many respects. With respect to the portfolio and wealth channel, rising wheat prices can be one of the main causes of inflation for wheat-importing countries (and subsequent depreciation of the nominal exchange rate) as wealth is transferred to wheat-exporting countries as a result of the higher exports revenues (and vice versa). As for the terms of trade channel, real wheat prices can also impact domestic inflation and real exchange rate, not because industries depend on wheat for production (as in the case of oil), but because wheat or the cost of bread determines wages and therefore cost of goods produced (as in the case of oil). As stated by Arintoko (2024), global inflation is usually induced by rising of energy and food prices, with the impact being more pronounced in developing compared to developed countries.
One last channel should be referred to in the two commodities’ prices and exchange rate relation, and that is the impact of their prices on the US dollar through the US economy and not through the economy where the exchange rate belongs. The US dollar followed the commodity prices in a predictable manner ever since the 1980s (at least until the eve of the COVID-19 pandemic). Usually during booms in commodity prices, the US dollar declined; contrariwise, the US dollar’s value tended to increase when commodity prices declined (Rees, 2023). The reasons for this relation abound. One explanation is that the rising oil price is associated with a lower expected growth rate of the US economy and hence a lower dollar (Klitgaard et al., 2019). Another explanation assumes that an increase in oil prices impacts relatively more oil-intensive nations like the US or strengthens the petrodollar’s recycling into significant demand for goods and services from other regions like Europe, thereby causing a decline in the value of the US dollar (Fratzscher et al., 2014). Since oil is sold in the international market in US dollars, this means that a change in the price of oil would raise the exchange rate of a foreign country like Egypt through their impact on the US dollar and not through their impact on the LE as per the previously mentioned channels.
Underscoring the asymmetric association were a plethora of studies, the results of which were mixed and inconclusive. The findings seemed to provide evidence of the asymmetric relation in some countries, such as OPEC countries with floating exchange (Baek, 2021), Canada and China in the long run, and China, Japan, and the United Kingdom in the short run, with signs of asymmetric adjustments also traced in Brazil, Nigeria, the Eurozone countries, and the UK (Ahmed and Hernandez, 2013). Kumar (2019) confirms it for India with the positive oil-price shock effect exceeding the negative one, while Bal and Rath (2015) confirm it for India and China, Baek (2022) for South Korea, Alqaralleh (2019) for the G20 countries, and Longe et al. (2019) and Saidi et al. (2020) for Indonesia, Onodje et al. (2022) for Nigeria, Chekouri et al. (2021) for Algeria and Kim and Jung (2018) for the United States and oil-exporting countries. Few studies found mixed symmetric and asymmetric results depending on the country’s exchange rate, such as that by Kiswanni and Elian (2021) on five OECD countries, Saidu et al. (2021) on six African countries, and Zhang and Baek (2022) on some south-east Asian countries. Khraief et al. (2021) tested the relationship in China and India, and their findings concluded that there is long-term asymmetry but short-term symmetry for both nations. Nevertheless, the asymmetric relation in India becomes symmetric when the noise effect is eliminated. Only two studies’ results revealed a symmetric relation. De Vita and Trachanas (2016) found such symmetry in India and China. Chen et al. (2016) also found that there was not much evidence of nonlinear relationships between oil prices and exchange rate in the United States.
Despite the ample evidence on the nonlinear oil price and currency relation, very few academics and practitioners examined this relation in the MENA region, with only one study including Egypt (Nouira et al., 2019). However the study’s results on Egypt did not bring any specific findings related to Egypt in particular, but only pinpointed to the existence of oil price volatility spillovers in some selected Middle Eastern countries.
Wheat price and exchange rate nexus studies on Egypt were practically nonexistent with the only existing studies linking food prices in general to the inflation rate rather than the exchange rate. An example of such studies is Ianchovichina, Loening, and Wood’s (2014) study which highlighted how transmission from food prices is asymmetric, raising domestic prices when international food prices rise but not decreasing them when international food prices fall.
Summing up, our study comes to fill a vital lacuna by investigating the unaccounted-for asymmetric interconnection between oil and wheat prices and Egypt’s exchange rate. Up to the researcher’s knowledge, no study was ever done before on this topic in Egypt. This paper takes the literature forward as it applies the recently developed novel econometric methodology (NARDL) that tests for asymmetric effects through decomposing the oil price and wheat price into positive and negative shocks. Accordingly, we test two main hypotheses:
H1: There is an asymmetric relation between the international price of oil and Egypt’s exchange rate in the short and long runs.
H2: There is an asymmetric relation between the international price of wheat and Egypt’s exchange rate in the short and long runs.
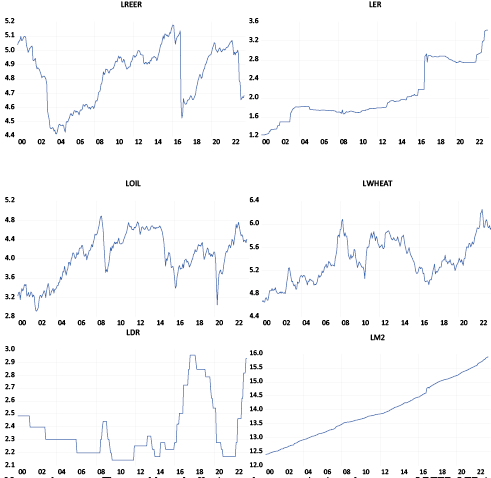
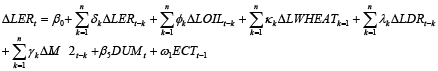
Predicated on the exchange rate theories and earlier research, the most fundamental macroeconomic control factors that can explain the changes in the currency values are the interest rate and monetary aggregates. We use monthly data starting 2000M1 until 2023M3. The CPI-based monthly real effective exchange rate is used after being transformed into natural logs and given the acronym LREER. It is worth noting that the value of a currency relative to a basket of other currencies is determined by the real effective exchange rate. The data comes from Bruegel’s database. LER is the monthly nominal exchange rate’s natural log; that is, the logged value of $1 expressed in LEs. The natural log of Egypt’s monthly discount rate is used to represent the interest rate and given the acronym LDR. The Egyptian monthly consumer price index, or LCPI, is the natural log of the CPI, and is used to represent the price level. LM2 is Egypt’s broad money expressed in natural logs. The data for LER, LDR, LCPI, and LM2 comes from both the International Financial Statistics (IFS) database of the International Monetary Fund (n.d.) and the Central Bank of Egypt (2023) (for the recent figures not recorded in IFS). LWHEAT is the natural log of wheat’s “no. 2 hard red winter Gulf export price; June 2020 backwards, no. 1, hard red winter, ordinary protein, export price delivered at the US Gulf port for prompt or 30 days shipment” (Indexmundi, 2021a) with the price valued in US dollars for each Metric Ton. LOIL is the natural log of “crude oil average spot price per barrel of Brent, Dubai, and West Texas Intermediate, equally weighed” (Indexmundi, 2021b). The data also come from the IndexMundi data portal. Figure 3 shows the logged time series of the selected variables.
The characteristics of our data set are described first, followed by a correlation analysis. Two models are proposed, the first with REER while the second uses LER as the regressand. The order of our time series variables is explored first to ensure that all are integrated of order I(0) or I(I), a condition necessary for the application of the ARDL estimation technique. Preliminary correlation results and the ARDL models prioritized the model with ER as the dependent variable (details explained in the next section). Our general model is thus constructed as follows:
 (1)
(1)
The definitions of the acronyms were explained earlier in Section 3.1, while v is the error term. All variables are transformed into natural logs.
Rewriting the previous equation in the framework of an Error Correction Model (ECM), we can capture the short-term impacts of the different selected regressors by examining the first differenced variables’ coefficients (equation 2),
 (2)
(2)
However, the long-term fluctuations in the exchange rate brought about by alterations in the independent variables are represented by the coefficients of the lagged-level regressors. As will be explained later we add a dummy variable DUMt = (DUM1t,…,DUMjt). When an observation relates to the jth period, the dummy variable’s value is 1, and in all other periods, it is 0. According to Pesaran et al. (2001), if the variables, I(0) and I(1), have a common trend and their linear combination is stationary, they are cointegrated. Pesaran et al. (2001) also developed a standard F-test with critical bounds to assess cointegration of the variables, which, in the ARDL model, can be either exogenous or endogenous. The linear combination of the lagged level variables can be replaced by the lagged Error Correction Term (ECTt-1) (equation 3).
 (3)
(3)
Unfortunately, the linear ARDL model in equation 3 assumes that the currency rate reactions to any shocks originating from the independent variables are symmetric, meaning that opposite changes result in identically opposite responses, which, predicated on the literature, is not always the case. As a result, we use the Shin et al. (2014) NARDL model, which generalizes the linear ARDL model, so that we can incorporate the potential asymmetries in the Egyptian currency rate’s reaction to changes in the factors being examined.
The NARDL model has a significant advantage over linear VAR and nonlinear techniques like quantile regression and Markov-switching models, which have gained popularity recently in the uncertainty literature. The NARDL model explicitly captures the short- and long-run equilibrium exchange rate adjustments that follow oil and wheat price shocks. Moreover, in contrast to these nonlinear switching models, the NARDL approach takes into account complex cointegration dynamics between the input series in addition to asymmetry (Apergis & Cooray, 2015).
The relationship expressed in equation 4 is the long-term asymmetric one, in accordance with Shin et al. (2014)
 (4)
(4)
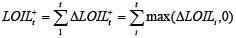
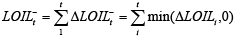
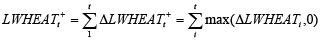
The expressions LOIL+t and LOIL-t are the fractional summation processes of positive and negative alterations in LOIL; LWHEAT+t and LWHEAT-t are the fractional summation processes of positive and negative alterations in LWHEAT. Their calcuations are expressed in equations (5)–(8)
 (5)
(5)
 (6)
(6)
 (7)
(7)
 (8)
(8)
where LOIL+t and LOIL-t are positive and negative alterations in the international price of crude oil; the LWHEAT +t and LWHEAT –t are positive and negative alterations in the international price of wheat. The δ+ and δ- are long-term parameters that reflect the oil price rises and declines respectively; the σ+ and σ- are long run parameters that reflect the rise of and fall in the wheat price respectively. The NARDL model can be obtained by substituting LOIL and LWHEAT in the linear ARDL model of equation 2 with LOIL+t, LOIL-t , LWHEAT +t and LWHEAT –t respectively.
 (9)
(9)
The nonlinear cointegration among the selected variables can be tested using the F-statistics with the null hypothesis assuming no cointegration (ρ = ψ+ = ψ- = 0, and ρ = ϖ+ = ϖ- =0) against the alternative hypothesis of cointegration. To test for the long-run asymmetric effect, we examine the long-term symmetric effect of surges and falls in the international price of oil, or whether or not ψ+ = ψ- where ψ+ = ψ+/ρ and ψ- = ψ-/ρ; and for the existence of the null hypothesis of long-term symmetric effect of inclines and declines of the international price of wheat, or whether ϖ+ = ϖ- where ϖ+ = ϖ+/ ρ and ϖ- = ϖ-/ρ. If the null hypothesis is rejected in any or all, then this will be an indication of the existence of long-run asymmetries in the effects of oil and wheat prices alterations on Egypt’s currency rate. We also test the null hypothesis of short-term symmetry in the impact of the upsurges and decreases in the crude oil price on Egypt’s currency rate; or
 (10)
(10)
and the null hypothesis of short-term symmetry in the impact of the rise and fall in the international price of wheat on Egypt’s currency rate; or
 (11)
(11)
Rejecting one or both null hypotheses indicates that there are short-run asymmetric effects in one or the two variables. In addition, if the fractional summation processes in one or the two independent variables take different lags, then this will imply that there is an asymmetry in short-run adjustments toward reaching the long-run equilibrium.
We begin by investigating the untransformed data of our variables (not reported here). Except for REER, the mean clearly surpasses the median, implying that the distributions of most variables are right-skewed and that the means are closer to the tail of the distributions. Kurtosis values clearly exceed 3 in the ER, DR, and M2 variables, implying that the distributions of the variables have higher-than-normal peaks with thicker-than-normal tails. The greater departure from zero in the three variables implies that they are highly skewed. To remove the discrepancies between the mean and the median, and decrease the skewness of the variables we transformed the time series of our variables to natural logs, adding the letter ‘L’ before each acronym. This would also ease the interpretation of the resulting coefficients, which can now be interpreted as elasticities. Table 1 displays the transformed variables’ descriptive statistics. The values of the mean and median are very close, the variance has been stabilized, while the kurtosis values have become much closer to 3.
|
LREER |
LER |
LOIL |
LWHEAT |
LCPI |
LDR |
LM2 |
|
|
Mean |
4.837875 |
2.065719 |
4.04932 |
5.369376 |
4.75323 |
2.365242 |
13.97903 |
|
Median |
4.901936 |
1.814825 |
4.11349 |
5.327609 |
4.72088 |
2.30258 |
13.83994 |
|
Maximum |
5.179027 |
3.428813 |
4.88907 |
6.258223 |
6.13997 |
2.957511 |
15.90356 |
|
Minimum |
4.416186 |
1.226712 |
2.91885 |
4.655007 |
3.79702 |
2.140066 |
12.40460 |
|
Standard deviation |
0.202268 |
0.548436 |
0.483408 |
0.362567 |
0.700158 |
0.222205 |
0.98533 |
|
Skewness |
-0.479296 |
0.704062 |
-0.401739 |
0.146255 |
0.227439 |
1.27533 |
0.237222 |
|
Kurtosis |
2.008651 |
2.272956 |
2.167508 |
2.194370 |
1.735058 |
3.617385 |
1.92724 |
Testing for multicollinearity among the dependent variables (Table 2), indicates that the variables do not display perfect multicollinearity. On the other hand, the correlation matrix also shows that the money supply and the consumer price index have strong multicollinearity (0.995). Moreover, it is clear that the correlations between LREER and our two variables of interest – oil and wheat prices – are very weak (0.077) and insignificant in the case of oil, and weak (0.198) in the case of wheat.
|
LREER |
LOIL |
LWHEAT |
LCPI |
LDR |
LM2 |
|
|
LREER |
1.000000 |
|||||
|
LOIL |
0.077466 |
1.000000 |
||||
|
LWHEAT |
0.198008*** |
0.829118*** |
1.000000 |
|||
|
LCPI |
0.367235*** |
0.441517*** |
0.557641*** |
1.000000 |
||
|
LDR |
-0.122088** |
-0.174175*** |
-0.217969*** |
0.377529*** |
1.000000 |
|
|
LM2 |
0.315029*** |
0.456266*** |
0.583312*** |
0.995192*** |
0.343007*** |
1.000000 |
Moving to the correlation analysis for model 2 (Table 3), it is evident that the correlation between LER and our two variables of interest becomes much stronger with the oil price-exchange rate correlation becoming 0.271 instead of 0.077 and that wheat price-exchange rate becoming 0.393 instead of 0.198 (both relationships significant). This implies that model 2 better explains the exchange rate repercussions compared to model 1. Finally, the high CPI-money supply multicollinearity (0.995) necessitates that we drop one of them to overcome the multicollinearity problem. We prefer to drop the LCPI variable, as according to theory, CPI hikes usually result from the money supply rises, and not vice versa.
|
LER |
LOIL |
LWHEAT |
LCPI |
LDR |
LM2 |
|
|
LER |
1.000000 |
|||||
|
LOIL |
0.271771*** |
1.000000*** |
||||
|
LWHEAT |
0.393974*** |
0.829118*** |
1.000000 |
|||
|
LCPI |
0.926019*** |
0.441517*** |
0.557641*** |
1.000000 |
||
|
LDR |
0.551836*** |
-0.174175*** |
-0.217969*** |
0.377529*** |
1.000000 |
|
|
LM2 |
0.935006*** |
0.456266*** |
0.583312*** |
0.995192*** |
0.343007*** |
1.000000 |
Table 4 presents the results of the Philips–Perron (PP) and Augmented Dickey–Fuller (ADF) tests, which show that the variables are stationary at first differences whereas they were nonstationary at levels. The results guarantee the nonexistence of any I(2) variables.
|
Variable |
ADF test |
PP test |
||||||
|
Level |
First difference |
Level |
First difference |
|||||
|
Intercept |
Intercept and trend |
Intercept |
Intercept and trend |
Intercept |
Intercept and trend |
Intercept |
Intercept and trend |
|
|
LREER |
-2.147111 |
-2.371383 |
-14.01864*** |
-13.99464*** |
-1.973601 |
-2.155630 |
-14.02609*** |
-14.00213*** |
|
LER |
0.469652 |
-1.150082 |
-16.87399*** |
-16.91258*** |
0.486285 |
-1.205255 |
-16.87311*** |
-16.91176*** |
|
LOIL |
-2.475696 |
-2.704408 |
-12.25906*** |
-12.24010*** |
-2.258416 |
-2.389411 |
-11.79089*** |
-11.76471*** |
|
LWHEAT |
-2.065419 |
-2.479120 |
-13.33833*** |
-13.31537*** |
-1.968659 |
-2.339096 |
-13.36250*** |
-13.33973*** |
|
LDR |
-1.436240 |
-1.873552 |
-9.230308*** |
-9.360569*** |
-1.531539 |
-1.916290 |
-16.95515*** |
-17.02020*** |
|
LM2 |
2.890156 |
0.004498 |
-16.10139*** |
-16.53440*** |
2.786216 |
-0.074580 |
-16.24894*** |
-16.55057*** |
We additionally test for unit roots with structural breaks (Table 5) in order to mitigate any potential bias in the results of the traditional unit root tests caused by the presence of structural breaks (Perron, 1989).
|
Level |
First difference |
|
|
LREER |
-3.155453 |
-21.15651*** |
|
LER |
-4.068688 |
-17.66631*** |
|
LOIL |
-5.038384* |
-13.48927*** |
|
LWHEAT |
-4.318087 |
-13.83529*** |
|
LDR |
-2.786183 |
-18.49179*** |
|
LM2 |
-3.332432 |
-23.84080*** |
The results of the breakpoint unit root tests aligned with those of the standard ones. While for each time series there was a different suggested breakpoint, there was one common breakpoint for the LREER, LER, and LM2 time series which was October 2016. To minimize the number of dummies, we generated one dummy variable which starts from October 2016 (the month that immediately preceded the Egyptian currency’s dramatic devaluation) till the end of the period under study. The dummy variable will take the value 1 starting at the breakpoint date and 0 otherwise.
To ensure the nonlinearity of our time series we use the Broock et al. (1996) BDS independence test (Table 6).
|
BDS Statistics Series |
Dimension 2 |
Dimension 3 |
Dimension 4 |
Dimension 5 |
Dimension 6 |
|
LREER |
0.188355*** |
0.317484*** |
0.404801*** |
٠.٤٦١٥٢١*** |
0.496719*** |
|
LOIL |
0.175718*** |
0.295545*** |
0.374597*** |
0.424934*** |
0.454723*** |
|
LWHEAT |
0.177153*** |
0.297263*** |
0.376663*** |
0.428452*** |
0.459945*** |
|
LDR |
0.191371*** |
0.319817*** |
0.406143*** |
0.463652*** |
0.501386*** |
|
LM2 |
0.201724*** |
0.340776*** |
0.437645*** |
0.505867*** |
0.554542*** |
The results collectively reject the null hypothesis that our variables are independent and identically distributed implying the appropriateness of using the NARDL technique.
We estimate the ARDL and NARDL models stated in equations (1) to (11) in order to evaluate the impact of the money supply, interest rate, and wheat and oil prices on the exchange rate and ascertain whether these effects are symmetric or asymmetric over the short and long terms. We begin first by estimating two models using the conventional ARDL technique (not reported here); the first model uses LREER as the dependent variable, whereas the second model uses the official nominal exchange rate as the regressand. The short and long-run results of both ARDL models show no impacts of either oil or wheat prices on the real effective exchange rate (model 1) or the nominal exchange rate (model 2) in Egypt, whereas all influences arise from the interest rate and the money supply. Both models do not suffer from serial correlation, or instability; but both suffer from heteroskedasticity. Moreover, model 1 suffers from model misspecification, whereas model 2 does not. Accordingly, we decided to proceed with model 2 using the NARDL estimation, especially since the cointegration coefficient of model 2 shows that the adjusting speed to equilibrium is faster compared to model 1, in addition to the higher correlation between the two regressors and LER compared to LREER.
Results of the NARDL model illustrated in Table 7 reveal that concerning oil prices, there was no impact on the exchange rate from any negative shock in oil prices. However, an increase in oil prices decreases the dollar price of the LE (appreciates the LE) gradually over the course of three months after the oil price hike. The impact is statistically significant at the 5- and 10-percent significance levels, although the magnitude of the impact is not large ranging from a 0.06 to 0.08 percent rise in the value of the LE as a result of a 1 percent rise in the international oil price. Extending our view to the long term, both the positive and negative impacts of oil price changes on the LE were insignificant.
With respect to wheat prices, only the decrease in the price of wheat seems to be impactful, with a 1 percent fall in wheat price leading to a 0.1 percent appreciation of the US dollar (depreciation of the LE). No impact on the LE appears from wheat price rises. As in the case of oil in the long run, both the positive and negative impacts of wheat price changes on the LE were insignificant. In a nutshell, no changes in oil and wheat prices lead to the depreciation of the LE in the long run, but the rise in the oil price leads to the appreciation of the LE, while the fall in the wheat price leads to the depreciation of the LE in the short run only. As expected, the lion’s share of the depreciation of the LE in the short run comes from the rise in the money supply.
Diagnostic tests on the NARDL model reveal that it does not suffer from autocorrelation, instability, or misspecification although there is some indication of heteroskedasticity. Figure 4 shows the CUSUM graph for the NARDL model.
|
Short-run results of the NARDL model |
|
|
Dependent variable LER |
Model 2 |
|
D(LER(-1)) |
-0.093865 |
|
D(LER(-2)) |
-0.046480 |
|
D(LER(-3)) |
-0.001873 |
|
D(LER(-4)) |
0.031252 |
|
D(LER(-5)) |
-0.067559 |
|
D(LER(-6)) |
-0.141977** |
|
D(LER(-7)) |
-0.238465*** |
|
D(LOIL_POS) |
-0.017434 |
|
D(LOIL_POS(-1)) |
-0.065238* |
|
D(LOIL_POS(-2)) |
-0.082756** |
|
D(LOIL_POS(-3)) |
-0.061304* |
|
D(LOIL_POS(-4)) |
-0.056226 |
|
D(LOIL_POS(-5)) |
-0.044660 |
|
D(LWHEAT_NEG) |
-0.051830 |
|
D(LWHEAT_NEG(-1)) |
-0.102967** |
|
D(LDR) |
0.217455*** |
|
D(LDR(-1)) |
0.132205*** |
|
D(LM2) |
3.054704*** |
|
D(LM2(-1)) |
0.172835 |
|
D(LM2(-2)) |
0.162897 |
|
D(LM2(-3)) |
-0.143687 |
|
D(LM2(-4)) |
0.030208 |
|
D(LM2(-5)) |
0.274739 |
|
D(LM2(-6)) |
0.224227 |
|
D(LM2(-7)) |
0.858208*** |
|
D(LM2(-8)) |
-0.148882 |
|
D(LM2(-9)) |
-0.504967*** |
|
DUM |
0.048140*** |
|
Long-run results of the NARDL model |
|
|
Dependent variable D(LER) |
Model 2 |
|
LOIL_POS |
0.239947 |
|
LOIL_NEG |
-0.725034 |
|
LWHEAT_POS |
0.161177 |
|
LWHEAT_NEG |
0.290114 |
|
LDR |
0.850649* |
|
LM2 |
-2.533374 |
|
C |
30.34990 |
|
Diagnostic checks |
Model 2 |
|
CointEq(-1)* |
-0.043478*** |
|
Adj. R-sq |
0.759600 |
|
Serial correlation LM test (Obs. R2) |
12.12711 |
|
Ramsey RESET test (t-statistic) |
1.909228 |
|
CUSUM |
Stable |
|
Breusch-Pagan-Godfrey heteroskedasticity test (Obs. R2) |
134.0312*** |
|
F-Bounds Test |
5.529059*** |
|
Observations |
270 |
|
Model Selection |
Akaike |
Wald tests confirm our NARDL results (Table 8). In the short run, no short-run negative impact of oil price and no short-run positive impact of wheat price on the LE appeared, thereby indicating the asymmetric impacts of oil price and wheat price changes on the LE. In the long run, the null hypothesis of the absence of symmetry in the impact of the oil prices on the exchange rate is rejected at the 5% significance level, which confirms the asymmetric impact of the oil price. However, concerning the wheat price level, it is clear that the null hypothesis is not rejected, which confirms the nonexistence of asymmetry in the long run. It should be noted here however that the NARDL results showed that both the positive and negative coefficients for both variables were insignificant in the long run.
|
Short run |
Long run |
|
|
t-Statistic WLOIL |
There is an asymmetric effect because the exchange rate only experiences the effects of a positive shock to oil prices; conversely, a negative shock to oil prices has no effect. |
3.007925 (0.0029) |
|
Result |
Although both impacts are insignificant, there are asymmetric effects |
|
|
t-statistic |
There is an asymmetric effect as the results from a negative shock in wheat only appear, while no results appear from a positive shock in wheat prices on the exchange rate |
-0.553709 (0.5803) |
|
WLWHEAT Result |
Although both impacts are insignificant, there are no long-run asymmetric effects. |
|
|
Result |
There are clear asymmetric effects between the LE and each of the prices of oil and wheat |
There are asymmetric effects between the LE and the price of oil only |
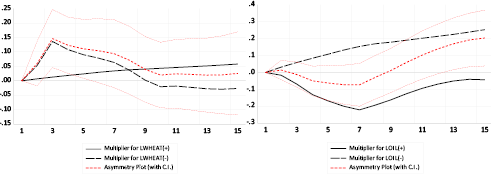
Designed by Shin et al. (2014), the dynamic multipliers illustrate how equilibrium is adjusted dynamically following a shock in a regressor. The dashed and bold curves illustrate the reactions of Egypt’s nominal exchange rate to a 1 percent increase and decrease in the international prices of oil and wheat (Figure 5). The asymmetry curve, represented by the dotted red curve, depicts the linear combination of the dynamic multipliers associated with the positive and negative shocks to the oil price. The asymmetry curve’s 95% confidence level is indicated by the two red thin dotted curves. Figure 5 underscores the greater positive oil price shock’s effect on the Egyptian currency compared to the negative one, ultimately leading to a decrease in the dollar/LE (or appreciation of the LE). Concerning wheat prices, a negative shock seems to outweigh that of a positive shock, pushing toward an increase in the dollar’s value with respect to the LE (depreciation of the LE).
To validate the applicability of our results, we conducted robustness checks using alternative model specifications (not reported here). We estimated additional NARDL models; the first included oil only without wheat as an independent variable together with the other regressors; the second included wheat but excluded oil from the independent variables, and the third included wheat but excluded oil and the discount rate from the regressors. All the signs of the coefficents of the focus and the control variables did not change, despite very slight changes in the magnitude of the coefficents, thus confirming the robustness of the results.
Using a NARDL approach, our empirical results demonstrated several asymmetric short-tun relationships; first, positive oil price shocks tend to appreciate the LE in the short run, whereas negative oil shocks impacts on the LE are nonexistent. This is contrary to what is usually promulgated in the media on the negative impact of the rising oil price on the LE. While this might have been true several years ago when Egypt’s crude oil trade balance was experiencing a deficit, surpluses in the oil trade balance (e.g., 2021) may probably boost the LE through increasing the oil exports revenues. The study thus confirms the wealth and portfolio theory in Egypt with respect to oil exports. Moreover, as mentioned earlier, the inverse global relation between the oil price and the US dollar implies that a falling dollar value occurring in tandem with a rising oil price can act as a mitigating element against the downward pressures on the LE in the short run (in case of rising oil prices and oil imports exceeding oil exports). Accordingly, a rise in oil prices may depreciate the dollar (thereby appreciating the LE) for reasons affecting the US fundamentals rather than those of the Egyptian economy. Second, only negative wheat price shocks tend to depreciate the LE in the short run, a result that was confirmed by Wald tests and the asymmetric dynamic multiplier analysis. Lower wheat prices may induce higher imports, creating extra pressure on the LE to depreciate. This was confirmed lately when wheat prices were at their lowest in four years, yet Egypt sought in August 2024 to purchase 3.8 million tons of wheat imports in a tender that was considered the largest ever in Egypt’s history. Officials announced that the tender was an attempt to take advantage of wheat low prices and buy as much as possible (Hassan, 2024). Rising wheat prices, on the other hand, do not affect the LE in the short run as the government may defer payments in case of a severe dollar shortage which can occur with higher wheat prices (Riyad, 2023).
This paper examined any potential asymmetry in the association between each of the price of oil and the price of wheat and the LE. Our research’s findings suggest that the prices of wheat and oil have asymmetric short-term effects on the LE since only positive oil price shocks tend to appreciate the LE. In contrast, only negative wheat price shocks tend to depreciate the LE in the short run, with no significant impacts in the long run.
Our findings refute the argument that one of the proclaimed causes for the severe depreciation of the LE was the acute rise in the prices of Egypt’s two main imports – wheat and oil – that followed the eruption of the Russian-Ukraine war and inflated Egypt’s import bill, resulting in an increased shortage of the US dollars and creating downward pressures on the LE. It is worth noting that in November 2016, when Egypt allowed its currency to free float, the LE plummeted from 8.8 LE/$US a month earlier to 17.7 LE/$US, at a time when both oil prices and wheat prices were steadily falling for not less than two years (Figure 1) implying that other factors have greater long-run impacts on the LE. Results from our NARDL model show that a 1 percent increase in money supply decreases the LE by 0.858 percent after seven months while a 1 percent rise in the discount rate decreases the value of the LE by 0.851 percent in the long run (Table 7). Our results thus align with those of Nouira et al. (2019) on the asymmetric impact of the international oil price on the exchange rate in the MENA countries including Egypt (the only study on Egypt) and with a plethora of studies that confirmed this relation in multiple countries (Ahmed and Hernandez, 2013; Bal and Rath, 2015; Kumar, 2019; Alqaralleh, 2019; Longe et al, 2019; Chekouri et al, 2021; Kiswanni and Elian, 2021; Saidu et al, 2021; Onodje et al, 2022; Baek, 2021, 2022). However, the direction of causation differs in Egypt from many other countries. For example, our results differ from those of southeast Asian countries such as Bangladesh, China, Hong Kong, India, the Philippines, and Thailand (Korea), which experience a prompt (delayed), brief, and statistically significant currency depreciation in response to a positive oil price shock (Zhang and Baek, 2022), whereas in Egypt the LE appreciates in response to a similar shock. One explanation for this could be that, given that these seven nations are categorized as net oil importers, a spike in the price of crude oil would probably result in lower exports from them as a result of higher production costs and a worsening trade balance (Zhang and Baek, 2022). However, Egypt is both an importer and exporter of oil, with a much smaller export sector compared to southeast Asian countries.
Unlike the main policy recommendation advocated by most of the previous studies underscoring the importance of stabilizing the oil price to stabilize the exchange rate, our findings imply that the rising international oil price can serve as a weak hedge against other factors that depreciate the LE, with the rising oil price temporarily appreciating the LE. Nevertheless, it should be stressed that such an impact – although statistically significant – is not economically influential. Future studies can probe the impact of refined petroleum (also a major export and import commodity) and Russian wheat prices on the exchange rate in Egypt (since Egypt imports 80 percent of its wheat from Russia, with variations between the world price and the Russian price). Incorporating such factors may potentially produce different asymmetric relationships between the two commodities’ prices and the LE.
Ahmad, A, Hernandez, R. M., (2013). Asymmetric adjustment between oil prices and exchange rates: Empirical evidence from major oil producers and consumers. Journal of International Financial Markets, Institutions & Money, 27, 306-317, https://www.sciencedirect.com/science/article/abs/pii/S1042443113000784
Alqaralleh, H. (2019). On the asymmetric response of the exchange rate to shocks in the crude oil market. International Journal of Energy Sector Management, 14(4),839-852, DOI 10.1108/IJESM-10-2019-0011
Apergis, N., & Cooray, A. (2015). Asymmetric interest rate pass-through in the US, the UK and Australia: New evidence from selected individual banks. Journal of Macroeconomics, 45, 155-172. https://www.sciencedirect.com/science/article/abs/pii/S016407041500052X
Arintoko, A., Kadarwati, N. and Badriah, L.S. (2024). The Asymmetric Effects of Global Energy and Food Prices, Exchange Rate Dynamics, and Monetary Policy Conduct on Inflation in Indonesia. Ekonomica, 103(2), 66-89. https://www.journals.vu.lt/ekonomika/article/view/33953
Bal, D.P., Rath, B.N. (2015). Nonlinear causality between crude oil price and exchange rate: a comparative study of China and India. Energy Economics, 51.149–156, https://www.sciencedirect.com/science/article/abs/pii/S0140988315001899
Baek, J. (2021). A new look at the oil price-exchange rate nexus: Asymmetric evidence from selected OPEC member countries. Economic Analysis and Policy, 70, 172-181, https://www.sciencedirect.com/science/article/abs/pii/S031359262100028X
Baek, J. (2022). Does COVID-19 play any role in the asymmetric relationship between oil prices and exchange rates? Evidence from South Korea. Economic Analysis and Policy, 74, 553 – 559. https://www.sciencedirect.com/science/article/pii/S0313592622000443
Beckmann, J., Czudaj, R. L., & Arora, V. (2020). The relationship between oil prices and exchange rates: Revisiting theory and evidence. Energy Economics, 88, 104772. https://doi.org/10.1016/j.eneco.2020.104772
Bénassy-Quéré, A., Mignon, V., Penot, A., (2007). China and the relationship between the oil price and the dollar. Energy Policy 35 (11), 5795–5805. https://doi.org/10.1016/j.enpol.2007.05.035
Breugel Database. (2024). Available at: https://www.bruegel.org/publications/datasets/real-effective-exchange-rates-for-178-countries-a-new-database.
Broock, W.A., Scheinkman, J.A., Dechert, W.D., & LeBaron, B., (1996). A test for independence based on the correlation dimension. Econometric Reviews, 15(3), 197–235, doi:10.1080/07474939608800353.
Buetzer, S., Habib, M.M., Stracca, L., (2016). Global exchange rate configurations: Do oil shocks matter? IMF Economic Review 64 (3), 443–470. https://www.ecb.europa.eu/pub/pdf/scpwps/ecbwp1442.pdf
Central Bank of Egypt (CBE). (2023). Available at: https://www.cbe.org.eg/
Central Bank of Egypt (CBE). (2023). CBE Exchange Rates Historical Data. Available at: https://www.cbe.org.eg/en/economic-research/statistics/cbe-exchange-rates/historical-data
Chekouri, S. M., Sahed, A. and Chibi, A. (2021). Oil price and exchange rate nexus in Algeria: evidence from nonlinear asymmetric and frequency domain approach. International Journal of Energy Sector Management, 15(5), pp. 949-968, https://www.emerald.com/insight/content/doi/10.1108/IJESM-08-2020-0018/full/html
Chen, S.-S., Chen, H.-C., (2007). Oil prices and real exchange rates. Energy Economics, 29 (3), 390-404. https://doi.org/10.1016/j.eneco.2006.08.003
Chen, H., Liu, L., Wang, Y., & Zhu, Y. (2016). Oil price shocks and US dollar exchange rates. Energy, 112, 1036-1048. https://www.sciencedirect.com/science/article/abs/pii/S036054421630932X
De Vita, G., Trachanas, E. (2016). Nonlinear causality between crude oil price and exchange rate: A comparative study of China and India’ — A failed replication (negative Type 1 and Type 2). Energy Economics, 56, 150 – 160. https://www.sciencedirect.com/science/article/abs/pii/S0140988316300524
Fratzscher, Marcel and Schneider, Daniel and Van Robays, Ine, Oil Prices, Exchange Rates and Asset Prices (May 27, 2014). ECB Working Paper No. 1689, Available at SSRN: https://ssrn.com/abstract=2442276 or http://dx.doi.org/10.2139/ssrn.2442276
Golub, S., (1983). Oil prices and exchange rates. The Economic Journal, 93 (371), 576–593. https://academic.oup.com/ej/article/93/371/576/5220559
Hassan, A.M. (2024). Egypt’s Sisi ordered huge wheat purchase fearing new supply crisis, sources say. Reuters (20 August 2024). https://www.reuters.com/world/africa/egypts-sisi-ordered-huge-wheat-purchase-fearing-new-supply-crisis-sources-say-2024-08-29/
Klitgaard, T. Pesenti, P. and Wang, L. (January 9, 2019). The Perplexing Co-Movement of the Dollar and Oil Prices (2019). Federal Bank of New York. https://libertystreeteconomics.newyorkfed.org/2019/01/the-perplexing-co-movement-of-the-dollar-and-oil-prices/
Krugman, P., (1983). Oil and the dollar. In: Jagdeeps, B., Bulfordh, P. (Eds.), Economic Interdependence and Flexible Exchange Rates. MIT Press, Cambridge, MA. https://mitpress.mit.edu/9780262520836/economic-interdependence-flexible-exchange-rates/
Ianchovichina, E.I., Loening, J.L. and Wood, C.A. (2014). How Vulnerable Are Arab Countries to Global Food Price Shocks? Journal of Development Studies, 50(9), 1302-1319, https://www.tandfonline.com/doi/abs/10.1080/00220388.2014.928698
IndexMundi (2021a). Wheat Prices per Metric Ton – US dollars per Metric Ton. Available at: https://www.indexmundi.com/commodities/?commodity=wheat&months=360
IndexMundi (2021b). Crude Oil (Petroleum) Monthly Price – US Dollars per Barrel. Available at: https://www.indexmundi.com/commodities/?commodity=crude-oil&months=360
International Monetary Fund. (n.d.). International Financial Statistics. Available at https://www.imf.org/en/Data
Jain, A. and Biswal, P.C. (2016). Dynamic linkages among oil price, gold price, exchange rate, and stock market in India. Resources Policy, 49, 179-185, https://www.sciencedirect.com/science/article/abs/pii/S0301420716301374
Khraief, N., Shahbaz M., Mahalik, M., Bhattacharya, M. (2021). “Movements of oil prices and exchange rates in China and India: New evidence from wavelet-based, non-linear, autoregressive distributed lag estimations.” Physica A, Vol. 563, 125423, https://www.sciencedirect.com/science/article/abs/pii/S037843712030755X
Kim, J. M., & Jung, H. (2018). Dependence structure between oil prices, exchange rates, and interest rates. The Energy Journal, 39(2), 259-280. https://journals.sagepub.com/doi/abs/10.5547/01956574.39.2.jkim
Kisswani, K. and Elian, M. (2021). Analyzing the (a)symmetric impacts of oil price, economic policy uncertainty, and global geopolitical risk on exchange rate.The Journal of Economic Asymmetries, 24, e00203, https://www.sciencedirect.com/science/article/pii/S1703494921000098
Kumar, S. (2019). Asymmetric impact of oil prices on exchange rate and stock prices. Quarterly Review of Economics and Finance, 72, 41-51, https://www.sciencedirect.com/science/article/abs/pii/S1062976918300838
Longe, A. E., Muhammad, S., Ajayi, P. I., Omitogun, O. (2019). Oil price, trade openness, current account balances and the official exchange rate in Nigeria. OPEC Energy Review, 43(4), 397-511, https://onlinelibrary.wiley.com/doi/epdf/10.1111/opec.12164
Nouira, R., Hadj Amor, T. and Rault, C. (2019), Oil price fluctuations and exchange rate dynamics in the MENA region: evidence from non-causality-in-variance and asymmetric non-causality tests. Quarterly Review of Economics and Finance, 73, 159-171. https://doi.org/10.1016/j.qref.2018.07.011
OEC (n.d.-a). Crude Petroleum in Egypt. Available at: https://oec.world/en/profile/bilateral-product/crude-petroleum/reporter/egy#Profile
OEC (n.d.-b). Wheat in Egypt. Available at: https://oec.world/en/profile/bilateral-product/wheat/reporter/egy
Onodje, P., Oke, T.A. and Aina, O. (2022). Asymmetric effects of oil price changes on the Nigerian exchange rate. International Journal of Energy Sector Management, 16(3), 529-544, https://www.emerald.com/insight/content/doi/10.1108/IJESM-01-2020-0003/full/html
Pesaran, M. H., Shin, Y., & Smith, R. J. (2001). Bound testing approaches to the analysis of level relationship. Journal of Applied Econometrics, 16(3), 289-326, https://onlinelibrary.wiley.com/doi/full/10.1002/jae.616
Rees, D. M. (2023). Commodity prices and the US Dollar. BIS Working Papers No 1083. https://www.bis.org/publ/work1083.pdf
Riyad, M. (2023) Egypt defers payments for wheat imports amid dollar crunches. Milling and Grain (2 August 2023). https://millingandgrain.com/egypt-defers-payments-for-wheat-imports-amid-dollar-crunches/
Saidi, L., Aedy, H., Saranani, F., Rosnawintang, R., Adam, P. and Sani, L.A. (2020). Crude Oil Price and Exchange Rate: An Analysis of the Asymmetric Effect and Volatility Using the Non Linear Autoregressive Distributed Lag and General Autoregressive Conditional Heterochedasticity in Mean Models. International Journal of Energy Economics and Policy, 10(1), 104-108. https://www.econjournals.com/index.php/ijeep/article/view/8362
Saidu, M.T., Naseem, N.A.M., Law, S.H. and Yasmin, B. (2021). Exploring the asymmetric effect of oil price on exchange rate: Evidence from the top six African net oil importers. Energy Reports, 7, 8238 – 8257. https://www.sciencedirect.com/science/article/pii/S2352484721005023
Shin, Y., Yu, B., Greenwood-Nimmo, M. (2014). Modelling Asymmetric Cointegration and Dynamic Multipliers in a Nonlinear ARDL Framework. In: Sickles, R., Horrace, W. (eds) Festschrift in Honor of Peter Schmidt. Springer, New York, NY, https://doi.org/10.1007/978-1-4899-8008-3_9
Zhang, X., & Baek, J. (2022). The role of oil price shocks on exchange rates for the selected Asian countries: Asymmetric evidence from nonlinear ARDL and generalized IRFs approaches. Energy Economics, 112, 106178. https://doi.org/10.1016/j.eneco.2022.106178