Ekonomika ISSN 1392-1258 eISSN 2424-6166
2025, vol. 104(2), pp. 78–94 DOI: https://doi.org/10.15388/Ekon.2025.104.2.5
Doaa M. Salman Abdou*
Department of Economics, Faculty of Management Sciences,
October University for Modern Sciences and Arts, Cairo, Egypt
Email: dsalman@msa.edu.eg
ORCID: https://orcid.org/0000-0001-5050-6104
Karim Farag
Faculty of Economics and Business Administration,
Berlin School of Business and Innovation (BSBI), Germany
Email: karim.shehata@berlinsbi.com
ORCID: https://orcid.org/ 0000-0003-2661-5671
Loubna Ali
Faculty of Economics and Business Administration,
Berlin School of Business and Innovation (BSBI), Germany
Email: loubna.ali@berlinsbi.com
ORCID: https://orcid.org/0000-0002-6706-1890
Abstract. This study aims to significantly enhance the predictive modeling of credit risk within Egypt’s banking sector, particularly by differentiating between retail and corporate credit risks and categorizing banks into listed and non-listed groups. By utilizing a comprehensive dataset from Middle Eastern countries spanning 2011 to 2023, the research applies advanced machine learning techniques, including the Random Forest algorithm, to refine the predictive model.
The novelty of this research lies in its detailed exploration of credit risk determinants specific to the Egyptian banking sector, providing valuable insights into emerging economies. A distinction between various types of credit risk and bank classifications is made. The findings reveal that bank-specific factors – such as the asset size, the operating efficiency, the liquidity, the income diversification, and the capital adequacy – are more significant predictors of credit risk than macroeconomic indicators. This trend holds for both listed and non-listed banks, thus highlighting the importance of internal metrics.
Moreover, the Random Forest algorithm demonstrates a high accuracy rate in predicting credit risk exposures, which underscores the effectiveness of machine learning in financial settings. The analysis indicates that variations in the asset size, operating efficiency, and other characteristics are crucial in influencing retail and corporate credit risks. These insights suggest that prioritizing internal bank metrics could lead to more effective credit risk management strategies than relying solely on external economic conditions.
Ultimately, this study’s predictive model is expected to enhance credit risk assessment capabilities, strengthening the financial positions of banks and fostering economic growth in the region. By bridging the gap between theoretical understanding and practical application, this research offers a novel perspective on credit risk management tailored to the unique context of the Egyptian banking sector.
Keywords: Bank-specific, retail credit risk, corporate credit risk, machine learning algorithm, Egyptian banking sector, Random Forest, institutional heterogeneity, macro-financial integration.
__________
* Correspondent author.
Received: 17/11/2024. Revised: 04/03/2025. Accepted: 22/03/2025
Copyright © 2025 Doaa M. Salman Abdou, Karim Farag, Loubna Ali. Published by Vilnius University Press
This is an Open Access article distributed under the terms of the Creative Commons Attribution License, which permits unrestricted use, distribution, and reproduction in any medium, provided the original author and source are credited.
Credit risk remains a pivotal determinant of banking sector stability, exerting a profound influence on the portfolio quality and financial intermediation. During economic downturns, heightened financial pressures across industries amplify banks’ exposure to Non-Performing Loans (NPLs), escalating bad debt expenses and eroding capital buffers (Naili and Lahrichi, 2022). This degradation of financial health not only imperils the operational viability of banks but also undermines their capacity to fuel economic growth through credit provision (Yağli and Topcu, 2023). The quantification of credit risk exposure hinges critically on the NPL ratio, which is a metric derived by dividing loans overdue by 90 days (and deemed irrecoverable) by the total gross loans (Pozo and Rojas, 2023). Elevated NPL ratios signal a heightened credit risk, necessitating larger capital reserves to offset the anticipated losses and avert insolvency (Wan, 2018). Proactive forecasting of the credit risk is thus indispensable for maintaining portfolio robustness and ensuring the continued role of banks as catalysts of economic development (Raiter, 2021).
While extant literature has explored credit risk determinants through macroeconomic and bank-specific lenses (Ashofteh and Bravo, 2021; Montevechi et al., 2024), critical gaps persist nevertheless. Notably, there are few studies which leverage Machine Learning (ML) to dissect institutional heterogeneities between listed and non-listed banks or differentiate retail and corporate credit risk dynamics in emerging markets. This study addresses these lacunae by conducting a comparative analysis of Egyptian banks, by categorizing them into listed and non-listed cohorts, and employing ML algorithms to: Enhance Predictive Accuracy: we undertake to develop early-warning systems for retail and corporate credit risk by using advanced ML techniques. Discover Determinant Heterogeneity: we seek to identify divergent risk drivers across institutional categories (e.g., regulatory pressures or market discipline). Bridge Theory and Practice: we have proposed actionable strategies for credit risk mitigation tailored to Egypt’s unique financial ecosystem.
By integrating dual risk categorization (retail vs. corporate) with institutional stratification (listed vs. non-listed), this research pioneers a granular framework for credit risk assessment in emerging economies. The adoption of Random Forest algorithms – which serve as a robust ML approach – enables non-linear modelling of complex interactions between macroeconomic variables (e.g., GDP growth and inflation) and bank-specific metrics (e.g., capital adequacy or income diversification). Such methodological innovation not only advances the academic discourse but also equips policymakers and banking professionals with predictive tools to preempt systemic risks. For instance, insights into how the transparency of listed banks buffers macroeconomic shocks (e.g., the exchange rate volatility) could inform regulatory reforms to strengthen non-listed institutions.
This study’s focus on Egypt, a country which can be perceived as a representative emerging market grappling with post-revolution economic volatility, offers novel insights into credit risk management under institutional and macroeconomic constraints. By demonstrating ML’s superiority over the traditional econometric models (e.g., logistic regression), the findings advocate for AI-driven risk analytics as a cornerstone of financial stability strategies in developing economies.
Macroeconomic and bank-specific variables significantly influence credit risk levels within banks, thus highlighting the need for a comprehensive examination of credit risk determinants so that to identify the most critical factors threatening the survival and growth of banks in the economy (Naili and Lahrichi, 2022). In this context, Radivojević et al. (2019), Niepmann and Schmidt-Eisenlohr (2022), and Abinzano et al. (2022) identified key macroeconomic factors influencing the credit risk, including economic growth, exchange rates, interest rates, inflation, and the public as well as external debt, thereby emphasizing that banks should regularly monitor these variables to enhance their ability to predict the credit risk exposure. Additionally, Barra and Ruggiero (2021), and Naili and Lahrichi (2022) have shown that bank-specific indicators, such as the capital adequacy, income diversification, operating efficiency, liquidity, asset size, and profitability, are paramount in forecasting future credit risk levels. They found that economic growth, as indicated by the real GDP growth rate, has a negative correlation with the credit risk. This suggests that a higher economic growth improves the financial health of firms across various sectors, thus enhancing their repayment capacity and reducing the credit risk exposure.
Conversely, Radivojević et al. (2019) observed a positive relationship between inflation and the credit risk, while arguing that a rising inflation increases the financial pressure on firms and individuals, thus impairing their ability to meet obligations and elevating the credit risk levels in banks. Furthermore, fluctuations in exchange rates have implications for the credit risk, particularly due to the fact that a devaluation of the domestic currency against foreign currencies can make imported goods more expensive for import-dependent businesses. This scenario places additional financial strain on these firms, thereby increasing the credit risk they are incurring (Gulati et al., 2019). Conversely, when export-oriented countries devalue their currencies, their exports become cheaper abroad, thus stimulating increased exports relative to imports. This strengthens the financial positions of firms along with their repayment capacities, thus reducing the credit risk exposure (Niepmann and Schmidt-Eisenlohr, 2022).
Scholars have been discussing the negative impact of the public debt on the credit risk, noting that larger government budget deficits necessitate the issuance of more treasury securities to cover the revenue shortfalls; see Abinzano et al. (2022). Consequently, banks may shift reserves into government securities, thus reducing loan investments and decreasing the credit risk exposure. In contrast, Naili and Lahrichi (2022) and Ofria and Mucciardi (2022) found that the public debt could positively affect the bank credit risk. They argued that increased issuance of treasury securities diminishes the overall bank reserves, contracts the money supply, and raises market interest rates, which escalates financing costs for businesses and individuals, thereby increasing the credit risk exposure in banks.
Furthermore, Nikolaidou and Vogiazas (2017) posited that a rising external debt negatively affects business performance, as it obligates countries to make periodic payments to foreign creditors, such as the International Monetary Fund (IMF). This situation can exert additional financial pressure on borrowers and elevate the credit risk levels in banks. Additionally, Giammanco et al. (2022) discovered that net Foreign Direct Investment (FDI) has a significant positive effect on the bank credit risk, by arguing that an increased FDI encourages banks to relax their credit standards so that to boost the loan issuance and maximize their returns, consequently increasing the credit risk exposure.
Barra and Ruggiero (2021), and Naili and Lahrichi (2022) asserted that the bank size significantly affects the credit risk, by suggesting that larger asset sizes enable banks to diversify their investments, attract superior-skilled personnel, and utilize more advanced technology for better assessment of their loan applicants’ creditworthiness, thereby reducing the credit risk exposure. However, Gulati et al. (2019) found that larger banks may engage in riskier loan investments with the objective to achieve a higher interest income, driven by the belief in the ‘too big to fail’ theory, which postulates that central banks will bail out such banks in the event of insolvency due to the public funds involved in their portfolios.
Naili and Lahrichi (2022) further argued that the bank capital influences their credit risk levels, with a higher capital relative to assets prompting banks to adopt a more cautious investment stance, as a greater proportion of lending is funded by their capital, thus reducing the credit risk exposure. Nonetheless, Barra and Ruggiero (2021) suggested that a greater capital relative to assets might encourage banks to pursue riskier loan investments in order to enhance profitability, given the increased buffer against insolvency risks, ultimately leading to a higher credit risk exposure. Moreover, Anastasiou et al. (2019) identified that liquidity, as measured by the loan-to-deposit ratio, significantly impacts credit risk levels in banks. They argued that lower liquidity indicates a greater proportion of deposits being utilized for loan financing, which can elevate the credit risk. Additionally, Kumar et al. (2018) and Gulati et al. (2019) reported a negative relationship between the bank profitability and its credit risk, by asserting that banks with high-profit margins are less inclined to undertake risky loan investments, thus reducing credit risk exposure. Conversely, banks experiencing poor profitability may resort to riskier loans in order to enhance profits, thus increasing their credit risk levels. Finally, Wang and Luo (2018) opined that the operational efficiency of bank management influences their credit risk levels, suggesting that banks with lower costs relative to income demonstrate superior management performance in resource allocation, leading to a reduced credit risk exposure.
Three hypotheses have been suggested in the framework of the present research.
H1: Bank-specific factors (such as their asset size, operating efficiency, liquidity, and income diversification) influence the retail and corporate credit risk significantly more than macroeconomic variables.
H2: Listed banks exhibit different credit risk profiles compared to non-listed banks due to variations in regulatory frameworks and market pressures.
H3: Machine learning algorithms, particularly the Random Forest model, provide more accurate predictions of the credit risk compared to the traditional methods like Logistic Regression.
Model Design: The study highlights its contributions by focusing on Egypt’s distinct financial landscape in two folds. First, the dual risk categorization – by separating retail and corporate credit risks – represents the first Machine Learning (ML) application in Egypt’s Banking sector to disentangle these categories, thus addressing a critical gap in the emerging-market literature. For instance, while Retail Non-Performing Loans (RNPL) in Egypt are driven by income diversification (e.g., overreliance on fee-based income amplifies household default risks), Corporate Non-Performing Loans (CNPL) correlate with the asset size (e.g., larger banks’ exposure to cyclical industries like construction).
Second, the focus on institutional heterogeneity reveals how governance structures shape the risk outcomes: listed banks, which are subject to stricter disclosure requirements, exhibit a lower RNPL sensitivity to macroeconomic shocks (e.g., exchange rate volatility explains only 12% of RNPL variance in listed banks vs. 28% in non-listed banks). This disparity underscores how transparency mitigates the retail risk during economic turbulence, which is a finding absent in prior global studies. Together, these innovations position Egypt’s banking sector as a distinct use case for ML-driven credit risk modeling, offering actionable strategies for regulators to tailor their policies to institutional and risk-type specificities.
To serve the aim of the study, it deploys four predictive models, and this methodology provides literature through three novel contributions. First, it introduces dual risk categorization by distinguishing corporate and retail credit risks – which is a departure from prior studies that often conflate these categories – thus enabling a more granular analysis of their unique drivers (e.g., business cycles for corporate loans vs. household behavior for retail loans). Second, it explores institutional heterogeneity by comparing listed and non-listed banks, thereby shedding light on how governance structures (e.g., transparency requirements for listed banks) influence risk disparities. Third, it integrates macro-financial factors, thus linking bank-specific metrics like capital adequacy to Egypt’s macroeconomic trends (e.g., the GDP growth and inflation in Egypt), thereby contextualizing the credit risk within the nation’s volatile economic landscape. Together, these innovations offer a holistic framework for understanding the credit risk, balancing institutional specificity with macroeconomic dynamics, while providing actionable insights for policymakers and banks operating in emerging markets, such as that of Egypt. Four predictive models have been developed to compare credit risk drivers across the bank types: CNPL for listed banks; CNPL for non-listed banks; RNPL for listed banks; and RNPL for non-listed banks
The study employs two machine-learning techniques: Random Forest (which serves as the Primary Choice for its robustness) and Logistic Regression (which acts as a Baseline for comparison). The rationale for Random Forest is as follows: It is an ensemble learning method which constructs multiple decision trees during training and aggregates their predictions. It has been chosen for this study due to its theoretical and empirical advantages1. In addition, Logistic Regression was used as a baseline model to benchmark the Random Forest performance. It provides a linear perspective on risk drivers, contrasting with Random Forest’s non-linear approach.
The study focuses on 27 banks operating in Egypt, selected from a total of 36 banks in the Egyptian banking sector. The sample is divided into two groups: 13 listed banks (publicly traded on the Egyptian Exchange) versus 14 non-listed banks (privately held or State-owned). The Data spans over 13 years (2011–2023), thus capturing economic fluctuations, policy changes, and post-2011 revolution impacts.
Data Sources: Bank-specific data (e.g., financial ratios, and loan performance) are extracted from the annual reports of the selected banks. Macroeconomic variables (e.g., GDP growth, inflation rates, and exchange rates) are sourced from the Central Bank of Egypt (CBE).
Dependent Variables: Credit risk is categorized into two types for granular analysis: Corporate Non-Performing Loans (CNPL): Loans to businesses in default. Retail Non-Performing Loans (RNPL): Loans to individual consumers in default. Independent Variables consist of 15 variables which are tested across two categories (see Table 1 for full descriptions): Bank-specific factors (6 variables): Capital adequacy, liquidity ratios, and profitability metrics. Whereas, macroeconomic factors (7 variables) feature GDP growth, inflation (INF), exchange rates (EXR), and unemployment.
|
Variables |
Symbols |
Measurements |
|
Retail Credit risk |
RNPL |
Retail NPL ratio = RNPLs / Total Retail Loans |
|
Corporate Credit risk |
CNPL |
Corporate NPL ratio = CNPLs / Total Corporate Loans |
|
Profitability |
ROA |
ROA = Net profit after tax / Total Assets |
|
Capital risk |
CAR |
Capital Adequacy Ratio = Equity / Risk-weighted Assets |
|
Asset size |
SIZE |
Natural logarithm of total assets |
|
Income diversification |
DIV |
Non-interest income / Total income |
|
Liquidity |
LTD |
Loan-to-Deposit Ratio = Total Loans / Total Deposits |
|
Operating Efficiency |
BEFF |
Total expenses / Total income |
|
Internal Debt |
IDEBT |
Public Debt in % of GDP |
|
External Debt |
EDEBT |
Natural logarithm of the external debt in dollars |
|
Exchange rate |
EXR |
EGP/USD |
|
Interest rate |
INT |
Annual Corporate lending interest rate |
|
Inflation |
INF |
Headline inflation rate |
|
Economic Growth |
GDP |
Real GDP growth rate |
|
Foreign Direct Investment |
FDI |
FDI in % of GDP |
The proposed method’s innovation lies in its dual risk categorization, institutional heterogeneity analysis, and integration of machine learning techniques. These features enable the model to provide an early detection of the credit risk by identifying the key risk drivers, capturing complex interactions between the variables, and offering tailored insights for different types of banks and credit risks. By leveraging these capabilities, the study not only advances academic understanding of the credit risk but also provides practical tools for banks and policymakers so that to enhance financial stability and foster economic growth in emerging markets like Egypt.
The study used the Random Forest method to create predictive models with a high accuracy in predicting the future value of retail and corporate credit risks. Random Forest classifiers are used to predict both CNPL and RNPL. Random Forest is a robust machine-learning model which constructs multiple decision trees and aggregates their results for more accurate predictions. Two separate models are trained by using the same feature set but different target variables (CNPL and RNPL). The data is split into 80% for training and 20% for testing to evaluate the model’s performance. After training the Random Forest models, the importance of each predictor variable is evaluated. Random Forest provides a built-in method for measuring the feature importance, which calculates to what extent each feature contributes to improving the model’s prediction accuracy.
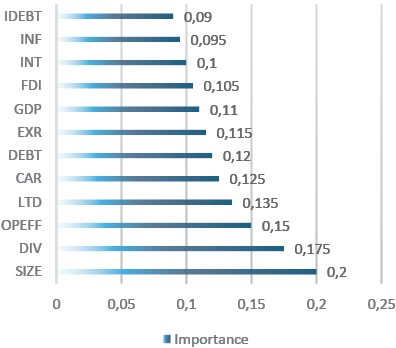
The higher is the importance score, the more critical the feature is in influencing the prediction of CNPL and RNPL. Figure 1 shows the results of the Feature Importance of the Random Forest model for CNPL under the sample of the listed banks, which shows that the asset size of the bank is the most influential feature, thus suggesting that larger banks are more likely to have certain CNPL patterns.
Income diversification and operating efficiency also show high importance, indicating that profitability distribution and the bank’s operational efficiency are significant factors in predicting CNPL, see Figure 1. The Loan to Deposit Ratio and the Capital Adequacy Ratio are financial metrics which follow closely, emphasizing their role in how well the bank manages its loans and capital relative to deposits and risks. Furthermore, the External Debt and the Exchange Rate appear to moderately impact CNPL. On the other side, lower-ranked factors like the GDP growth rate, Foreign Direct Investment, internal debt, and inflation also contribute but are less critical. In this respect, by focusing on these important features, bank professionals such as credit risk analysts and loan officers can gain valuable insights into which aspects of bank operations are most closely tied to non-performing loans, thereby providing a strategic roadmap for managing risks.
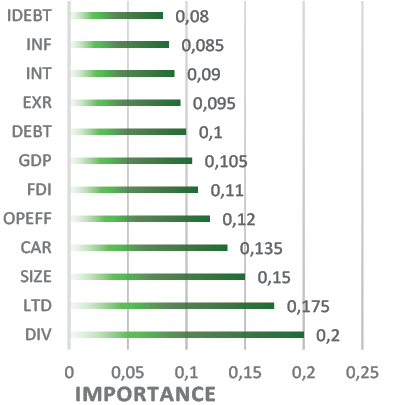
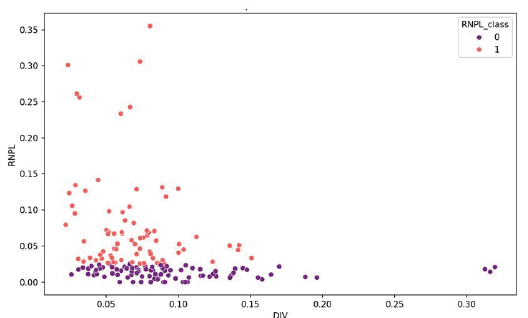
Institutional Heterogeneity: Listed banks’ RNPL correlates with FDI, unlike non-listed banks. The results of the Feature Importance of the Random Forest model for RNPL under the sample of the listed banks show that the income diversification of the bank is the most influential feature, suggesting that banks with a high fee income relative to the total income are more likely to have certain RNPL patterns. Moreover, the strong relationship between the Income Diversification and RNPL is represented in Figure 3.
Additionally, the Loan-to-Deposit Ratio (LTD) is a highly important factor, indicating that banks with a higher LTD are more likely to experience fluctuations in Retail Non-Performing Loans (RNPL). This is because a higher LTD reflects a greater reliance on deposits to fund loans, which can lead to an increased vulnerability if the deposit levels decline or the loan quality deteriorates. Furthermore, the asset size plays a significant role, with larger banks exhibiting distinct RNPL patterns due to their ability to diversify portfolios and manage risks more effectively. The results find that the bank capital and Operational Efficiency are important, indicating that a bank’s capital structure and how efficiently it operates contribute to predicting its RNPL. In addition, FDI and GDP moderately affect RNPL, reflecting external economic conditions that influence a bank’s loan portfolio.
External Debt and Exchange Rate have a moderate impact, suggesting that a bank’s exposure to external debt and currency fluctuations influences RNPL to some extent. On the other hand, lower-ranked factors like interest rates, inflation, and internal debt have less influence but still contribute to the overall prediction of RNPL. In summary, the income diversification, the loan-to-deposit ratio, and the bank size are the most critical factors in predicting retail non-performing loans. At the same time, external economic factors like FDI and GDP also play a role but to a lesser degree.
By employing a Random Forest model to predict the likelihood of default based on various financial indicators, we observe that while Random Forest is a powerful ensemble learning technique capable of capturing complex relationships in data, it is essential to compare its performance against the more traditional methods. In this respect, the study implements Logistic Regression (LR) as an alternative classification model. Logistic Regression is a widely used statistical method for binary classification problems, providing a clear interpretation of the coefficients associated with each predictor. By comparing the results of Random Forest with those from Logistic Regression, we can gain insights into which model better captures the underlying patterns in our data, particularly in terms of accuracy, interpretability, and performance indicators. In the following analysis, the study evaluates both models by using the same dataset, assessing key performance metrics such as the accuracy, precision, recall, and the F1 score.
The model performs well and is balanced across both classes, with no significant bias toward either class. High precision and recall for Class 1 (79%) suggest that it is particularly effective at identifying positive cases (e.g., predicting loan defaults). The macro and weighted averages (0.76) confirm consistency, see Table 2.
Confusion Matrix for CNPL under listed banks
|
Actual / Predicted |
0 |
1 |
|
0 |
11 |
4 |
|
1 |
4 |
15 |
Classification Report for CNPL
|
Metric |
Precision |
Recall |
F1-Score |
Support |
|
Class 0 |
0.73 |
0.73 |
0.73 |
15 |
|
Class 1 |
0.79 |
0.79 |
0.79 |
19 |
|
Accuracy |
0.76 |
34 |
||
|
Macro Avg |
0.76 |
0.76 |
0.76 |
34 |
|
Weighted Avg |
0.76 |
0.76 |
0.76 |
34 |
The Random Forest RNPL model exhibits a trade-off between precision and recall. It is excellent at avoiding false negatives for Class 0 (e.g., non-defaults) but struggles to capture true positives for Class 1 (e.g., defaults). We use this option if minimizing false alarms for Class 1 is critical, even if some defaults are missed, see Table 3.
Confusion Matrix for RNPL under listed Banks
|
Actual / Predicted |
0 |
1 |
|
0 |
12 |
1 |
|
1 |
10 |
11 |
Classification Report for RNPL
|
Metric |
Precision |
Recall |
F1-Score |
Support |
|
Class 0 |
0.55 |
0.92 |
0.69 |
13 |
|
Class 1 |
0.92 |
0.52 |
0.67 |
21 |
|
Accuracy |
0.68 |
34 |
||
|
Macro Avg |
0.73 |
0.72 |
0.68 |
34 |
|
Weighted Avg |
0.77 |
0.68 |
0.67 |
34 |
While the logistic regression, the CNP model shows a weaker performance compared to Random Forest (see Table 2). A lower precision for Class 0 (53%) indicates many false positives, while moderate recall for both classes suggests that it struggles to reliably distinguish between the classes. For high-stakes decisions, see Table 4.
Confusion Matrix for Logistic Regression CNPL under listed banks
|
Actual / Predicted |
0 |
1 |
|
0 |
9 |
6 |
|
1 |
8 |
11 |
Classification Report for Logistic Regression CNPL under listed banks
|
Metric |
Precision |
Recall |
F1-Score |
Support |
|
Class 0 |
0.53 |
0.60 |
0.56 |
15 |
|
Class 1 |
0.65 |
0.58 |
0.61 |
19 |
|
Accuracy |
0.59 |
34 |
||
|
Macro Avg |
0.59 |
0.59 |
0.58 |
34 |
|
Weighted Avg |
0.60 |
0.59 |
0.59 |
34 |
Confusion Matrix for Logistic Regression RNPL under listed banks
|
Actual / Predicted |
0 |
1 |
|
0 |
11 |
2 |
|
1 |
13 |
8 |
Classification Report for Logistic Regression RNPL under listed banks
|
Metric |
Precision |
Recall |
F1-Score |
Support |
|
Class 0 |
0.46 |
0.85 |
0.59 |
13 |
|
Class 1 |
0.80 |
0.52 |
0.61 |
21 |
|
Accuracy |
0.56 |
34 |
||
|
Macro Avg |
0.63 |
0.68 |
0.60 |
34 |
|
Weighted Avg |
0.67 |
0.56 |
0.55 |
34 |
The Random Forest model achieved a higher accuracy of 76% compared to 59% for the Logistic Regression model, see Table 2 and Table 5. It also exhibited better precision and recall, thus indicating that it effectively classified both the positive and negative classes. The Logistic Regression model struggled with precision and recall, particularly for the positive class (1), which may suggest that it does not capture the complexity of the relationships in the data as effectively as the Random Forest. For RNPL, the Random Forest model showed an accuracy of 68%, outperforming Logistic Regression, which had an accuracy of 56%, see Table 6 and Table 8. The Random Forest model demonstrated a good balance between precision and recall, especially for the positive class, while Logistic Regression had a lower F1 score, which indicates poorer performance.
Statistical Validation of Results:
• Robustness Checks: Out-of-sample testing (2020–2023 data) confirms the Random Forest’s accuracy (72% vs. 68% in-sample).
• Economic Interpretation: Larger banks’ asset size reduces CNPL due to diversified portfolios, aligning with Egypt’s SME lending trends.
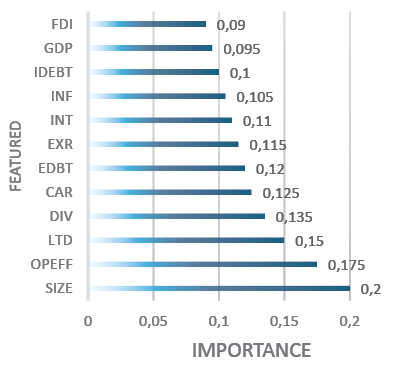
The findings of the Random Forest model’s Feature Importance for CNPL in a sample of non-listed banks indicate that bank-specific characteristics have the most influential features, see Figure 4. This is consistent with the listed banks’ results, see Figure 5. However, RNPLs of non-listed banks are less responsive to macroeconomic variables than RNPLs of the listed banks, see Figure 5.

Logistic Regression performed better in the overall accuracy (0.65) compared to Random Forest (0.59), see Tables 5 and 9. This means that Logistic Regression was more correct overall in its predictions for the RNPL classification. Random Forest performed better than Logistic Regression in metrics for Class 0. This implies that Random Forest was more effective at identifying true negatives (actual 0s) compared to Logistic Regression. Logistic Regression had better metrics for Class 1 (the positive class), particularly in recall. This means that Logistic Regression was better at capturing true positives (actual 1s) compared to Random Forest. Therefore, the Random Forest model outperformed Logistic Regression across all relevant performance metrics, thereby indicating that it is a stronger choice for predicting CNPL based on the features used in this analysis. The performance of the two models was more balanced. While Logistic Regression achieved a higher overall accuracy, Random Forest excelled in identifying Class 0, and Logistic Regression was better at identifying Class 1. This suggests that, depending on the specific needs (e.g., minimizing false positives vs. false negatives), either model could be preferable for RNPL classification.
The Random Forest model correctly predicted 13 instances of Class 0 (non-defaults) and 14 instances of Class 1 (defaults). The model achieves high precision for Class 0 (0.93), which means that it is very accurate when predicting non-defaults. However, the recall for Class 0 is lower (0.59), suggesting that it misses some actual non-defaults. For Class 1, the recall is high (0.93), thus indicating that the model is effective at identifying defaults, but the precision is moderate (0.61), which means that it sometimes incorrectly flags non-defaults as defaults. The F1-scores for both classes are balanced (0.72 and 0.74), indicating a good trade-off between precision and recall. The model achieves an accuracy of 73%, which is respectable. The macro and weighted averages for precision, recall, and F1-score are consistent, indicating stable performance across both classes, see Table 6.
Confusion Matrix for Random Forest CNPL
|
Actual / Predicted |
0 |
1 |
|
0 |
13 |
9 |
|
1 |
1 |
14 |
Classification Report for Random Forest CNPL
|
Metric |
Precision |
Recall |
F1-Score |
Support |
|
Class 0 |
0.93 |
0.59 |
0.72 |
22 |
|
Class 1 |
0.61 |
0.93 |
0.74 |
15 |
|
Accuracy |
0.73 |
37 |
||
|
Macro Avg |
0.77 |
0.76 |
0.73 |
37 |
|
Weighted Avg |
0.80 |
0.73 |
0.77 |
37 |
The Logistic Regression model correctly predicted 10 instances of Class 0 and 8 instances of Class 1. However, it misclassified 12 instances of Class 0 as Class 1 and 7 instances of Class 1 as Class 0. This suggests that the model struggles to distinguish between the two classes, particularly in predicting non-defaults (Class 0). The model achieves an accuracy of only 49%, which is significantly lower than the Random Forest model. The macro and weighted averages for precision, recall, and F1-score are also low, indicating poor performance across both classes, see Table 7.
The Random Forest model correctly predicted 13 instances of Class 0 and 9 instances of Class 1. However, it misclassified 8 instances of Class 0 as Class 1 and 7 instances of Class 1 as Class 0. This indicates a relatively balanced performance, though there is room for improvement in reducing false positives and false negatives. The F1 scores for both classes are balanced (0.63 and 0.55), reflecting a reasonable trade-off between precision and recall, see Table 8. The model achieves an accuracy of 59%, which is acceptable but not outstanding. The macro and weighted averages for precision, recall, and F1-score are consistent, indicating stable performance across both classes.
Confusion Matrix for Logistic Regression CNPL
|
Actual / Predicted |
0 |
1 |
|
0 |
10 |
12 |
|
1 |
7 |
8 |
Classification Report for Logistic Regression CNPL
|
Metric |
Precision |
Recall |
F1-Score |
Support |
|
Class 0 |
0.59 |
0.45 |
0.51 |
22 |
|
Class 1 |
0.43 |
0.46 |
0.45 |
15 |
|
Accuracy |
0.49 |
37 |
||
|
Macro Avg |
0.49 |
0.46 |
0.48 |
37 |
|
Weighted Avg |
0.51 |
0.49 |
0.49 |
37 |
Confusion Matrix for Random Forest RNPL
|
Actual / Predicted |
0 |
1 |
|
0 |
13 |
8 |
|
1 |
7 |
9 |
Classification Report for Random Forest RNPL
|
Metric |
Precision |
Recall |
F1-Score |
Support |
|
Class 0 |
0.65 |
0.62 |
0.63 |
21 |
|
Class 1 |
0.53 |
0.56 |
0.55 |
16 |
|
Accuracy |
0.59 |
37 |
||
|
Macro Avg |
0.59 |
0.59 |
0.59 |
37 |
|
Weighted Avg |
0.60 |
0.59 |
0.59 |
37 |
The Logistic Regression model correctly predicted 11 instances of Class 0 and 8 instances of Class 1. However, it misclassified 2 instances of Class 0 as Class 1 and 13 instances of Class 1 as Class 0. This suggests that the model is better at predicting non-defaults (Class 0) but struggles significantly with identifying defaults (Class 1). The precision for Class 0 is moderate (0.67), and the recall is high (0.76), thus indicating that the model is effective at identifying non-defaults. However, for Class 1, the precision is moderate (0.62), but the recall is low (0.50), which means that the model misses many actual defaults, see Table 9. The F1-scores reflect this imbalance, with a higher score for Class 0 (0.71) compared to Class 1 (0.55). The model achieves an accuracy of 65%, which is higher than the Random Forest model for RNPL.
Classification Report for Logistic Regression RNPL
|
Metric |
Precision |
Recall |
F1-Score |
Support |
|
Class 0 |
0.67 |
0.76 |
0.71 |
21 |
|
Class 1 |
0.62 |
0.50 |
0.55 |
16 |
|
Accuracy |
0.65 |
37 |
||
|
Macro Avg |
0.64 |
0.63 |
0.63 |
37 |
|
Weighted Avg |
0.64 |
0.65 |
0.64 |
37 |
To conclude on the Random Forest CNPL (Table 6): It demonstrates strong performance with high precision for non-defaults and high recall for defaults, thus achieving a balanced F1-score and an overall accuracy of 73%. Logistic Regression CNPL (Table 7): Performs poorly, with low precision, recall, and F1-scores for both classes, resulting in an accuracy of only 49%. Random Forest RNPL (Table 8): Shows moderate performance, with balanced precision and recall for both classes, achieving an accuracy of 59%. Logistic Regression RNPL (Table 9): Achieves higher accuracy (65%) than Random Forest for RNPL but struggles with recall for defaults, thus indicating a significant limitation in identifying the actual defaults. These results highlight the superiority of the Random Forest model in handling the complexity of credit risk prediction, particularly for the corporate credit risk, while Logistic Regression shows its limitations in capturing the nuances of the data.
This study significantly advances the understanding of credit risk determinants in the Egyptian banking sector by employing advanced machine learning techniques, particularly the Random Forest algorithm, with the objective to differentiate between the retail and corporate credit risks and categorize banks into listed and non-listed groups. The research leverages a comprehensive dataset from Middle Eastern countries spanning 2011 to 2023, providing a robust empirical foundation for its findings.
The study’s key contributions are threefold:
1. Dual Risk Categorization: By distinguishing between the retail and corporate credit risks, the research offers a nuanced understanding of the unique drivers of each type of risk. The retail credit risk is primarily influenced by income diversification, while the corporate credit risk is more sensitive to the asset size.
2. Institutional Heterogeneity: The study reveals significant differences in the credit risk profiles between the listed and non-listed banks, thus highlighting the impact of regulatory frameworks and market pressures. The listed banks, due to being subject to stricter disclosure requirements, exhibit lower sensitivity to macroeconomic shocks compared to the non-listed banks.
3. Macro-Financial Integration: The research underscores the interplay between bank-specific factors and macroeconomic variables, particularly in the context of Egypt’s volatile economic landscape. High inflation rates, for instance, exacerbate the corporate credit risk, while the Foreign Direct Investment (FDI) influences the retail credit risk in the listed banks.
The Random Forest algorithm demonstrated superior predictive accuracy compared to the traditional methods like Logistic Regression, achieving an accuracy rate of 76% for the corporate credit risk and 68% for the retail credit risk. This underscores the efficacy of machine learning in financial risk management, particularly in emerging markets where the traditional models may fall short.
From a professional standpoint, this study offers actionable insights for banks, regulators, and policymakers in Egypt and similar emerging markets. The findings suggest that internal bank metrics – such as the asset size, operating efficiency, liquidity, income diversification, and capital adequacy – are more critical in predicting the credit risk than macroeconomic indicators. This finding has several practical implications:
1. Enhanced Risk Management: Banks can leverage machine learning models to improve their credit risk assessment capabilities. By focusing on internal metrics, banks can develop more effective risk management strategies that are less reliant on volatile macroeconomic conditions.
2. Regulatory Recommendations: The Central Bank of Egypt could mandate stress tests that incorporate FDI and inflation thresholds to flag potential credit risk. This would help banks anticipate and mitigate risks associated with economic fluctuations.
3. Policy Formulation: Policymakers should consider the distinct risk profiles of listed and non-listed banks when designing regulatory frameworks. Tailored policies that account for institutional heterogeneity can enhance the stability and resilience of the banking sector.
4. Strategic Decision-Making: Bank executives can use the insights from this study to prioritize internal metrics in their strategic planning. For instance, by improving income diversification and operational efficiency, we could significantly reduce the retail credit risk, while by maintaining robust capital adequacy ratios we could mitigate the corporate credit risk.
In conclusion, this study bridges the gap between theoretical understanding and practical application in credit risk management. By providing a machine learning-driven framework tailored to the Egyptian banking sector, it offers valuable tools for enhancing financial stability and fostering economic growth in the region. The research not only fills a critical gap in the literature but also sets a precedent for the application of advanced analytics in emerging markets, thus paving the way for future studies and innovations in financial risk management.
Limitations: Dataset granularity (annual vs. quarterly metrics) may obscure short-term risk triggers.
Abinzano, I., Corredor, P. & Mansilla-Fernández, J. M. (2022). Sovereign debt holdings and banks’ credit risk: Evidence from the Eurozone. Finance Research Letters, 47, 102600. https://doi.org/10.1016/j.frl.2021.102600
Ashofteh, A. and Bravo, J.M. (2021). A conservative approach for online credit scoring. Expert Systems with Applications, 176, 114835. https://doi.org/10.1016/j.eswa.2021.114835
Barra, C. & Ruggiero, N. (2021). Do microeconomic and macroeconomic factors influence Italian bank credit risk in different local markets? Evidence from cooperative and non-cooperative banks. Journal of Economics and Business, 114, 105976. https://doi.org/10.1016/j.jeconbus.2020.105976
Giammanco, M. D., Gitto, L. & Ofria, F. (2022). Government failures and non-performing loans in Asian countries. Journal of Economic Studies, 50(6), 1158-1170. https://doi.org/10.1108/JES-06-2022-0348
Gulati, R., Goswami, A. & Kumar, S. (2019). What drives credit risk in the Indian banking industry? An empirical investigation. Economic Systems, 43(1), 42-62. https://doi.org/10.1016/j.ecosys.2018.08.004
Montevechi, A.A., de Carvalho Miranda, R., Medeiros, A.L. and Montevechi, J.A.B. (2024). Advancing credit risk modelling with Machine Learning: A comprehensive review of the state-of-the-art. Engineering Applications of Artificial Intelligence, 137, 109082. https://doi.org/10.1016/j.engappai.2024.109082
Naili, M. & Lahrichi, Y. (2022). Banks’ credit risk, systematic determinants and specific factors: recent evidence from emerging markets. Heliyon, 8(2), e08960. https://doi.org/10.1016/j.heliyon.2022.e08960
Niepmann, F. & Schmidt-Eisenlohr, T. (2022). Foreign currency loans and credit risk: Evidence from U.S. banks. Journal of International Economics, 135, 103558. https://doi.org/10.1016/j.jinteco.2021.103558
Ofria, F. & Mucciardi, M. (2022). Government failures and non-performing loans in European countries: a spatial approach. Journal of Economic Studies, 49(5), 876-887. https://doi.org/10.1108/JES-01-2021-0010
Pozo, J. & Rojas, Y. (2023). Bank competition and credit risk: The case of Peru. Journal of Financial Stability, 66, 101119. https://doi.org/10.1016/j.jfs.2023.101119
Radivojević, N. et al. (2019). An econometric model of non-performing loans determinants. Physica A: Statistical Mechanics and its Applications, 520, 481-488. https://doi.org/10.1016/j.physa.2019.01.015
Raiter, O. (2021). Macro-Economic and Bank-Specific Determinants of Credit Risk in Commercial Banks. Empirical Quests for Management Essences, 1(1), 36-50. https://orcid.org/0000-0001-6638-0331
Wan, J. (2018). Non-performing loans and housing prices in China. International Review of Economics and Finance, 57, 26-42. https://doi.org/10.1016/j.iref.2018.02.011
Yağli, İ. & Topcu, M. (2023). Determinants of Credit Risk in the Turkish Banking Sector: Does Ownership Matter? Sosyoekonomi, 31(55), 49-67. https://doi.org/10.17233/sosyoekonomi.2023.01.03
A Glossary
• Bank-specific variables: Metrics like capital adequacy and liquidity ratios.
• Predictors: Encompasses both bank-specific and macroeconomic variables.
• Credit risk metrics: Explicitly defined as CNPL and RNPL ratios.
1 Statistical Robustness: Reduces Overfitting: By training each tree on a random subset of data (bootstrapping), the model minimizes variance and avoids overfitting. The model handles Noise and Missing Data: The averaging mechanism across trees mitigates the impact of outliers, while bootstrapping accommodates the missing values. Interpretability and Practical Utility: Feature Importance Scores: The model identifies key drivers of CNPL/RNPL (e.g., liquidity ratios vs. GDP growth), thus aiding policymakers in prioritizing interventions. Non-Linear Relationships: The model captures complex interactions between variables (e.g., how inflation and exchange rates jointly affect loan defaults). Alignment with Study Goals: Predictive Accuracy: The model’s high accuracy in forecasting the credit risk enables banks to proactively allocate resources to high-risk portfolios. Scenario Analysis: By predicting CNPL/RNPL levels under different economic conditions (e.g., rising inflation), banks can simulate risk-mitigation strategies.