 (1)
(1)Ekonomika ISSN 1392-1258 eISSN 2424-6166
2025, vol. 104(3), pp. 23–43 DOI: https://doi.org/10.15388/Ekon.2025.104.3.2
Wisam H. Ali Al-Anezi*
College of Administration and Economics, University of Anbar, Iraq
Email: wisamali@uoanbar.edu.iq
ORCID: https://orcid.org/0000-0002-3729-2460
Ali Y. Abdullah Al-Joaani
Al-nisour University, Faculty of Administration and Economics, Iraq
Email: aliyousifabd@nuc.edu.iq
ORCID: https://orcid.org/0009-0002-7026-2770
abdulrazaq shabeeb
College of Administration and Economics, University of Anbar, Iraq
Email: abdulrazaq.shabeeb@uoanbar.edu.iq
ORCID: https://orcid.org/0009-0000-9509-59863
Faisal Ghazi Faisal
Al-Idrisi University College, Iraq
Email: faisal.ghazi@idrisi.edu.iq
ORCID: https://orcid.org/0000-0002-4698-5816
Abstract. The research aims to use the Dynamic Equality Condition Correlation (DECO-GARCH) model to test the general movements and conditional relationships regarding the return on investment in a financial market. This is distinguished from other models, particularly from the DCC model, as it is based on calculating the pairwise correlations of assets (joint return volatilities) at one time for all assets, while relying on the history of those assets. This study focused on the returns of US stock market indices, the Chinese stock market index, and financial markets in some Middle Eastern countries, (S&P 500, DJI, NASDAQ Composite, Shanghai Composite, Saudi General, Dubai General, Bahrain General, Amman General, Iraq Stock Exchange). We conduct this research on the grounds of understanding the impact of financial crises on asset returns in these markets, the interconnections that govern them, and the extent to which investors can hedge their investments in these markets. The results have revealed significant and varying correlations between these indices, with increased equal relationships observed in 2015–2016 and 2020–2021, which corresponding to the dates of the European debt crisis, the collapse of the Chinese stock market, and the COVID-19 pandemic. Overall, there was noticeable fluctuation in the conditional dynamic equality among the studied indices during the study period, thus supporting the hypothesis of contagion effects and emphasizing the importance of considering the evolving nature of relationships between these indices when making asset allocation decisions.
Keywords: DECO-GARC, financial contagion, dynamic correlations, financial markets, common movement.
________
* Correspondent author.
Received: 30/11/2024. Revised: 26/05/2025. Accepted: 26/05/2025
Copyright © 2025 Wisam H. Ali Al-Anezi, Ali Y. Abdullah Al-Joaani, abdulrazaq shabeeb, Faisal Ghazi Faisal. Published by Vilnius University Press. This is an Open Access article distributed under the terms of the Creative Commons Attribution License, which permits unrestricted use, distribution, and reproduction in any medium, provided the original author and source are credited.
Financial markets play an important role in national economies as they are extremely useful in directing and diversifying domestic savings, converting foreign capital into productive investment, and sustaining economic growth and development. Fluctuations in the market values of financial instruments represent a major challenge for lawmakers because prevalent fluctuations between investment markets not only have significant effects on production costs, corporate benefits, and the rate of employment growth, but also lead to variations from macroeconomic strategies which encourage development and social welfare, in addition to helping to avoid and predict future economic downturns. In recent years, financial markets have witnessed significant fluctuations in correlations between different asset classes. Understanding the dynamic links (relationships) between numerous financial assets is critical for investors, portfolio managers, and policymakers, since they have a direct impact on the diversification of portfolios, asset allocation techniques, and risk management (Hung, 2021b).
Investors, and even portfolio managers, often monitor reference indicators of financial markets because they give a general idea of the movement of the public market and thus guide them in their investment decisions (Yilmaz, 2010). Furthermore, the openness and financial liberalization processes which led to the abolition of financial restrictions were in turn followed by an upward trend in trade interactions between economies. This leads to the transfer of bubbles between global financial markets before and during financial crises (Zeren & Yilanci, 2019), and the behavior of these bubbles has caused significant fluctuations in financial markets, particularly in asset markets (Ozdemir, 2022), and especially in the financial crises that resulted from the Asian financial crisis in 1997, the worldwide economic meltdown of 2008, as well as the European debt crisis of 2015–2016, and also the difficulties associated with the coronavirus pandemic (COVID-19) of 2020–2021, which made the development of world stock markets increasingly important. Given that the torrent of shocks felt by financial markets largely emanated from the US markets for stocks, the investigation of financial infection consequently became highly relevant when financial crises were having worldwide consequences (Cai et al., 2016).
The motivation behind our study is that the study focuses on exploring contagion effects in financial markets and uses the DECO-GARCH model to capture evolving correlations during crises. This model is characterized by its ability to capture the shared dynamic movements over time for all assets simultaneously.
This study attempts to conduct a simulation between some developed countries and some developing countries in order to achieve an understanding of the equal dynamic movements of the markets of these countries under the conditions of financial globalization. The following section discusses the literature review, followed by the methodology, the extraction of results, and their discussion. Finally, the conclusions, recommendations, and future studies are presented at the end of this paper.
Understanding the dynamic relationships between different financial assets is critical for investors in order for them to make the appropriate decisions and for portfolio managers so that they manage their portfolios effectively. Dynamic correlations directly affect portfolio diversification, risk management, and asset allocation strategies. Previous scholarly studies have shown that correlations between various financial market assets can change over time and are often influenced by macroeconomic factors, market conditions, and investor sentiment.
Several studies employed different co-integration techniques to emphasize the extent of a connection between stock markets in the BRICS nations and the European Union, notably, the DECO-GARCH model (Aboura & Chevallier, 2014) This strategy was used to study an equal connection of variance throughout marketplaces (stocks, securities, foreign exchange rates, or commodities).
It was discovered (e.g., by Kang et al., 2019) by using the DECO-GARCH model that the spillovers shifted from international financial markets to the Southeast Asian region (ASEAN-5) are greater than those observed in the markets from ASEAN stocks in the Southeast Asian region (ASEAN-5) to international financial markets. Also, we used the DECO-GARCH model in order to investigate the common actions and conditioned connections between the earnings of the financial markets under study, while using daily data from March 20, 2014 to March 12, 2024, in order to identify the relationships in financial markets in both developed and developing nations (Diebold & Yilmaz, 2012). In a study by (Bouri et al., 2021) the DECO-GARCH model was used to analyze market integration amongst 12 main cryptocurrencies, who ended up finding that it is capable of handling a wide variety of variables, unlike the previous GARCH models.
A study by (Xiao, 2017) used both the Dynamic Conditional Correlation (DCC-GARCH) model and the Dynamic Equally Weighted Conditional Correlation (DECO-GARCH) model, concluding that there was a significant increase in conditional correlations (contagion) and equal correlations during the global financial crisis between the US stock markets and the stock markets of the eight East Asian countries. When comparing the DECO-GARCH model and the DCC-GARCH model, it is assumed that all paired correlations are equal at all periods, which is a requirement for calculating the matrix of equal paired correlations, contrary to the DCC-GARCH model, and the estimates of the DECO-GARCH model for US stock return data indicated that equicorrelated models are more suitable for these data than the DCC-GARCH model, as the DECO-GARCH model shows an improved portfolio selection compared to the unconstrained dynamic correlation model. This was established to reduce the noise in estimating correlations (Engle & Kelly, 2012).
A study by (Kregždė & Kišonaitė, 2018) discussed the common movements between the Lithuanian stock markets and the European markets. The study used a wave model to measure the risk of stock market returns and to understand the common movements during the period from 2000 to 2018. The study found that the common movements with Poland, the Czech Republic, and Hungary were slightly lower after the European Commission announced the introduction of the Euro in Lithuania. For Lithuanian investors, diversification with Central European markets is not beneficial in the long term due to the high common movements between their returns.
Many studies have employed the Dynamic Condition Connectivity Model (DCC-GARCH) to enhance foreign investment portfolios and discover improved (adjusted) returns that are dependent on risk rather than standard techniques (Alshenawy & Abdo, 2023). The study by (Creti et al., 2013) used the Dynamic Conditional Correlation (DCC-GARCH) model to measure the links between stock and commodity markets’ volatility; their study found that the correlations between commodities and stock returns evolve over time, and they were highly volatile during the financial crisis of 2008. The results showed that some commodities are characterized by speculative behavior, particularly oil, coffee, and cocoa, with their correlations increased with the growth of S&P 500 returns during times of rising stock prices and diminished during downturns.
Previous studies have not addressed the interconnectedness of financial markets in high-income developed countries such as the United States and China with the financial markets of developing countries denoted by medium and low incomes when using modern models such as the DECO-GARCH model. Therefore, the present study was conducted to examine the equal dynamic movements between the financial markets in the United States and China, which are considered high-income advanced countries, and some countries in the Middle East, which are regarded as developing countries with medium to low income.
We utilize daily data for 10 financial markets of industrialized and developing nations (US stock market, the Chinese stock market index (Shanghai), and financial market indices in Saudi Arabia, the United Arab Emirates, Bahrain, Jordan, and Iraq) by relying on data for the period from March 20, 2014, to March 12, 2024, as all-time series of indicators are converted into logarithmic returns, resulting in 1346 daily views of each indicator, while taking into account the corresponding trading days for all markets, the indicators used were as follows (Investing, n.d.):
1) Standard & Poor’s 500 Index;
2) Dow Jones Industrial Average (DJI);
3) NASDAQ Composites Index (IXIC);
4) The Shanghai Composite Index (CSI1000I);
5) The Saudi General Index (TASI) Saudi Stock Exchange (Tadawul) All Share Index;
6) Dubai Financial Market General Index (DFMGI);
7) FTSE Abu Dhabi General Index (FTFADGI);
8) Bahrain General Index;
9) Amman Stock Exchange General Index;
10) Iraq Stock Exchange (ISX) Index 60.
The DCC-GARCH model was developed by (Engle, 2002). It provides the flexibility to model multivariate conditional fluctuations at the same time for stock returns, their varying correlations, and their temporal expectations. Despite its versatility, its estimation requires computing the associations of many pairs twice, thus making the understanding of correlation data complicated (Kang et al., 2019).
To address these constraints, we propose the DECO-GARCH models (Engle & Kelly, 2012) estimating the equal constants of the average of all asset pairs. In other words, in this paradigm, the average conditioned correlation is equivalent to the sum of all marital connections. Hence, according to (Hung, 2021b), temporal shifts in correlation between all important markets are observed over the timeframe from March 20, 2014 to March 12, 2024. Unlike the usual DCC-GARCH paradigm that we offer, DECO-GARCH is an alternate model rather than one that overlaps with DCC-GARCH )Engle, 2002; Engle & Kelly, 2012).
The use of the DECO-GARCH model to measure market return volatility is considered more advanced than other models, particularly the DCC-GARCH model, as it is an improvement over the DCC-GARCH model on the grounds of calculating double correlations in a more flexible and dynamic manner, especially in cases where the change in asset returns is unstable. This makes its results more accurate and efficient than the results of the DCC-GARCH model (Engle & Kelly, 2012).
The DECO-GARCH model is characterized by its ability to compute dynamic correlations between each pair of asset returns compared to the DCC-GARCH model, which reduces the estimation error; the DECO-GARCH model is also distinguished by its capability to handle large-scale correlation matrices compared to the DCC-GARCH model (Hung, 2021a).
Indeed, DECO-GARCH has some subtle but important features lacking in DCC-GARCH. One example is that the DECO-GARCH correlation between asset pairs i and j depends on the return history of all asset pairs. For the simulated DCC-GARCH specification (i.e., when using the same number of parameters), the i, j correlation depends only on the history of i and j. In this sense, DECO-GARCH economically exploits a broader information set to formulate the per-pair correlation process. To the extent that the true correlation is affected by the realizations of all assets, the failure of DCC-GARCH to capture the information aggregation aspects of DECO-GARCH may disadvantage DCC-GARCH as a descriptor of the data-generating process (Engle & Kelly, 2012).
The DECO-GARCH model is based on the premise that any two sets of stock returns are uniformly linked on a particular day; however, this correlation varies over time, simplifying the computation of the logarithmic likelihood of high-dimensional return systems. The DECO-GARCH model generates correlations between pairs of returns (𝑟1,𝑡, 𝑟2,𝑡, … , 𝑟𝑛,𝑡). The (DECO-GARCH) model calculates the correlations between any pair of returns (𝑟𝑖,𝑡) and (𝑟𝑗,𝑡) based on past information for all pairs (n) of returns. To obtain similar specifications for the (DCC-GARCH) model (with an equal number of parameters), the correlation between (𝑟𝑖,𝑡) and (𝑟𝑗,𝑡) is calculated by using only the past information set for (𝑟𝑖,𝑡) and (𝑟𝑗,𝑡). Thus, the (DECO-GARCH) model uses more information to calculate the dynamic correlations between each pair of returns compared to the (DCC-GARCH) model, which reduces estimation errors for the correlations. Additionally, the (DECO-GARCH) model remains stable even when the returns are not equally correlated (Engle & Kelly, 2012). The DECO-GARCH model is compatible with the most accurate daily data of the US returns on stocks (DCC-GARCH) model. Furthermore, the DECO-GARCH model outperforms the sample model (DCC-GARCH) in portfolio selection (Kang et al., 2019).
We assume that the process of generating data on returns can be described as an automatic regression model of the first degree (AR (1)). The patterns of the present return of shares are understood by their postponed returns as the framework (AR (1)) is characterized as follows (see Hung et al., 2022; Al-Anezi et al., 2021):
(1)
here, μ is a static vector, whereas εt = (εt–1, t,…, εn) is an array of residues, and (DCC-GARCH) is used for dynamic conditional correlation (Engle, 2002) This magnitude is used to represent the time-dependent dynamical action of conditional variation. The variance conditional matrix (Ht) has been established to be the following (see Ali Al-Anezi et al., 2025):
 (2)
(2)
where the standard deviation (Dt) matrix represents the diagonal conditional on the structure (Ali Al-Anezi et al., 2025):
 (3)
(3)
The Rt matrix represents conditional correlations.
The GARCH (1,1) description for each conditioned variation is as follows (Hung, 2021a):
 (4)
(4)
 (5)
(5)
where C is a matrix (n * 1), and ai or bi are orthogonal matrices (n * n). Equation (2) may be circulated by using standardized return, as follows, where  :
:
 (6)
(6)
It proposes (Engle, 2002) intermediate conditional conditions with the following GARCH (1,1) specifications:
 (7)
(7)
 (8)
(8)
where qij,t represents the conditioned relationship among ei,t–1 and ej,t–1. The corresponding variables (α) and (β) have to meet the following requirements:

When (α+β) approaches one, conditional deviation is highly continuous. In the matrix format (cf. Bauwens & Xu, 2019):
 (9)
(9)
where  is the unconditional covariance for standardized errors, Q, which may be calculated as follows:
 (10)
(10)
Rt is then obtained by (Bauwens & Xu, 2023):
 (11)
(11)
where 
However, Aielli (2013) claims that, when calculating the matrix of covariance, Qt is inconsistent since E{Rt} ≠ E{Qt}. The next consistent model demonstrates the correlation routing method.
 (12)
(12)
here,  represents the unrestricted covariance matrix for
  .
.
It has been proposed by (Engle & Kelly, 2012) to use the model (ρt). The correlation routing procedure is used to create the conditioned matrix of correlation, Qt, then select the average of its-Qatari components, as specified by DECO-GARCH, to decrease the estimate time, and the corresponding correlation may be stated as follows (Aboura & Chevallier, 2017):
 (13)
(13)
where:
 (14)
(14)
where K is a vector of units (qij,t) of elements (i,j) of a matrix (Qt) After the model (DCC-GARCH), we use ( ) to record a conditional correlation matrix:
 (15)
(15)
where In is the unit matrix of dimensions n. Thus, DECO-GARCH modeling is less demanding and simpler to estimate computationally, while also demonstrating the link between multiple groups and a single DCC-GARCH coefficient. This involves calculating the pairwise correlations of assets (joint return volatilities) at one time for all assets, while relying on the history of those assets (Cai et al., 2016).
Here, we first examine the descriptive data of the return of the financial sectors under consideration in order to get an idea of the salient facts of the time series of returns, as we note through Table 1 that there is a significant fluctuation of the market returns. This indicates the relative instability of these markets, as we note that the average market returns were positive except for the returns from RDFMGI, Ramman, and RISX60, where the Saudi financial market (TASI) achieved the highest average return at a rate of 9.8146, while the Amman Stock Exchange (Aman) achieved the lowest average return at a rate of -7.8923,while the standard deviations of the unconditional fluctuations of the time series studied yielded a difference ranging from 0.003472% for the returns of RBAX to 0.010642% for the returns of RCSI1000I, whereas the distortion coefficients (skewedness) suggest that the time series of returns are not normally distributed. We also note the problem of the thickness of the tails, where the Kurtosis statistics were greater than the three involved in the normal distribution, as the distribution gathers more around the average, which means that the chains of market returns deviate from the normal distribution. This is further confirmed by the Jarque-Bera statistics test, which rejects the zero hypotheses of the normal situation. This means an increase in the volatility of financial market returns, as shown in Table 1.
|
RS&P500 |
RDJI |
RIXIC |
RCSI1000I |
RTASI |
RDFMGI |
RFTFADGI |
RBAX |
RAMMAN |
.RISX60 |
|
|
Mean |
0.000328 |
0.000280 |
0.000427 |
4.3743 |
9.8146 |
-3.8298 |
0.000211 |
0.000123 |
-7.8923 |
-2.8828 |
|
Median |
0.000447 |
0.000355 |
0.000650 |
0.000367 |
0.000409 |
9.6879 |
0.000140 |
3.4415 |
0.00000 |
-0.00028 |
|
Max |
0.080206 |
0.070829 |
0.11523 |
0.058348 |
0.04984 |
0.050796 |
0.066392 |
0.018529 |
0.036562 |
0.081402 |
|
Min |
-0.043405 |
-0.04570 |
-0.04430 |
-0.0682 |
-0.07276 |
-0.073193 |
-0.06047 |
-0.05174 |
-0.02183 |
-0.08241 |
|
Std. Dev. |
0.006243 |
0.005867 |
0.007925 |
0.010642 |
0.006837 |
0.007750 |
0.006036 |
0.003472 |
0.003788 |
0.007116 |
|
Skewness |
0.70884 |
0.42144 |
1.6068 |
-0.79103 |
-1.1897 |
-0.67576 |
0.11605 |
-3.5061 |
1.1078 |
0.91421 |
|
Kurtosis |
25.574 |
22.108 |
35.603 |
5.8154 |
17.391 |
12.774 |
23.066 |
53.715 |
11.988 |
38.408 |
|
J-B |
36794.0 *** |
27452.0 *** |
71668.0 *** |
2037.0 *** |
17280.0 *** |
9253.3 *** |
29842.0 *** |
1.6458 *** |
8334.5 *** |
82921.0 *** |
|
Probability |
0.0000 |
0.0000 |
0.0000 |
0.0000 |
0.0000 |
0.0000 |
0.0000 |
0.0000 |
0.0000 |
0.0000 |
|
Observations |
1346 |
1346 |
1346 |
1346 |
1346 |
1346 |
1346 |
1346 |
1346 |
1346 |
|
Q2(10) |
248.134 ** |
453.306 ** |
66.6409 ** |
390.239 ** |
167.734 ** |
243.371 ** |
421.365 ** |
245.548 ** |
177.922 ** |
201.147 ** |
|
ARCH (10) |
19.036 ** |
31.617 ** |
5.3885 ** |
19.416 ** |
14.246 ** |
18.209 ** |
44.194 ** |
36.682 ** |
13.310 ** |
28.515 ** |
|
ADF |
-21.78 ** |
-21.77 ** |
-21.94 ** |
-19.75 ** |
-19.88 ** |
-20.63 ** |
-21.89 ** |
-18.75 ** |
-18.82 ** |
-21.50 ** |
We also investigate, through Table 1, the returns of the studied markets more deeply in terms of whether they are appropriate for volatility modelling; more specifically, we investigate whether there is a subjective connection in quadratic returns, as well as the (arch) impacts of differentiated time series. We see the Significant results of the Ljung-Box test performed on the square yield up to 10 delays (Q210), so that to reject the zero hypothesis for the absence of serial correlation, which provides evidence of a large subjective correlation between the markets, while the arch Lagrangian Factor (LM) tests refute the zero hypothesis, which indicates the existence of large (arch) effects. In addition, we verified the stability of the studied market returns according to the Enhanced Dickie Fuller (ADF) root unit tests. It was found that the dynamic correlation model (DECO-GARC) is suitable for the analysis of correlations to the returns of the financial markets in the study sample. The Jarque-Bera tests also demonstrate the use of the multidimensional (DECO-GARCH). They were used to assess the distinctions and dependent relationships (correlations) between markets, where there is a strong correlation between most of the returns of the studied markets. Meanwhile, the average distribution of financial market returns provides an initial picture of the spread of these returns, allowing for subsequent tests to determine the correlations between these returns, as shown in Figure 1.
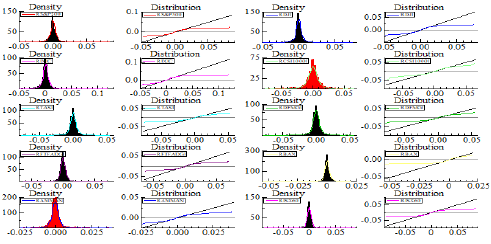
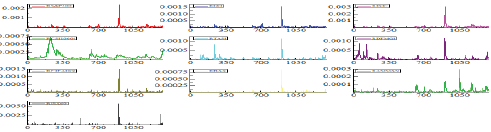
Figure 1 depicts the outcomes of the examination of the average distribution series of returns for the markets analyzed, indicating that they are somewhat unstable. This result is confirmed by Figure 2, which illustrates the daily returns of financial markets necessitating the use of an advanced model, particularly the DECO-GARCH model.
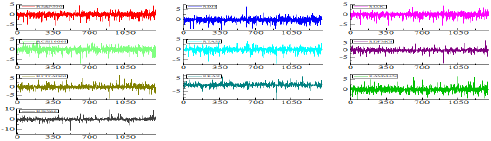
The daily movements of the financial market return in the study sample can be examined in depth, revealing that they somewhat harmonize with each other’s fluctuations. This indicates the existence of correlations between the returns of these markets, as illustrated in Figure 2. The application of natural logarithms to the indicators and calculation of their daily returns helps us to adjust the potential and lost outliers and achieve stability of variance, as these conversions allow us to focus on changes in the indicators instead of their absolute levels. Figure 3 shows the graphs of the returns for the markets under study.
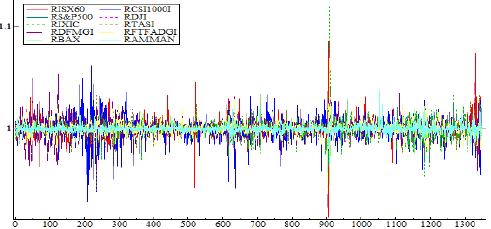
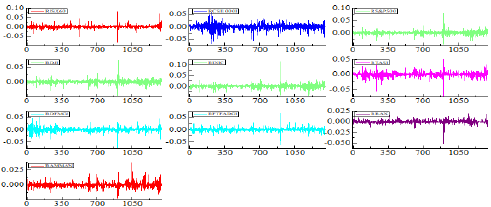
By considering Figure 3, we find that the visual impression indicates that there are varying degrees of volatility and distinct periods of prominent price movements. It is apparent that huge returns are likely to be accompanied by large returns in the other markets, whereas small returns typically result in near low returns in the other markets. Statistically, the combination of fluctuations indicates a strong subjective correlation in the quadratic return.
Here, we record the time-varying connections between the analyzed markets, utilizing a multidimensional ARMA-GARCH model within a DECO-GARCH framework, which was estimated by using the Student distribution for a lack of normal distribution for market returns. In Table 2, the intervals were established based on the lowest possible values of information criteria (AIC) and Schwartz (sic), resulting in ARMA (1,0)-GARCH (1,1) models suited for all analyzed market data series. The first column (A) of Table 2 demonstrates that both the (arch) or (GARCH) indices for all examined marketplaces are of statistical significance at the 1% level. All series are near to one and statistically significant, thereby demonstrating that the conditional associations of fluctuation continue to exist across time. The DECO-GARCH model results are reported in section B of Table 2.
|
RISX60 |
RAMMAN |
RBAX |
RFTFADGI |
RDFMGI |
RTASI |
RCSI1000I |
RIXIC |
RDJI |
RS&P500 |
|
|
Panel A: Estimates for the univariate ARMA(1, 0)-GARCH(1, 1) model |
||||||||||
|
0.000024 (0.9054) |
-0.000147 (0.0902) |
0.000268 (0.0623) |
0.000478 (0.0049) |
0.000370 (0.1280) |
0.000435 (0.0184) |
0.000060 (0.7914) |
0.000555 (0.0002) |
0.000407 (0.0006) |
0.000479 (0.0002) |
Const (M) |
|
-0.001990 (0.9747) |
0.062822 (0.1121) |
0.124448 (0.0205) |
0.083441 (0.0245) |
0.079373 (0.1080) |
0.099395 (0.0523) |
0.011257 (0.7051) |
-0.026102 (0.4518) |
0.013362 (0.6809) |
-0.031203 (0.3647) |
AR(1) |
|
6.716037 (0.0051) |
0.813161 (0.0034) |
1.581938 (0.1000) |
7.596296 (0.0000) |
2.956957 (0.0124) |
2.357216 (0.0009) |
0.018664 (0.0328) |
2.211117 (0.0125) |
2.095103 (0.0356) |
1.753690 (0.0282) |
Const(V) |
|
0.564346 (0.0342) |
0.204093 (0.0006) |
0.289668 (0.2117) |
0.227563 (0.0069) |
0.204946 (0.0098) |
0.194068 (0.0004) |
0.058975 (0.0000) |
0.193116 (0.0003) |
0.210102 (0.0042) |
0.291399 (0.0136) |
ARCH |
|
0.490820 (0.0001) |
0.755639 (0.0000) |
0.629151 (0.0008) |
0.562382 (0.0000) |
0.778171 (0.0000) |
0.786210 (0.0000) |
0.924739 (0.0000) |
0.788031 (0.0000) |
0.735528 (0.0000) |
0.710708 (0.0000) |
GARCH |
|
Panel B: Estimates from the DECO-GARCH model |
||||||||||
|
0.143664 (0.0000) |
Average _ij |
|||||||||
|
0.011236 (0.0276) |
a DECO-GARCH |
|||||||||
|
0.947634 (0.0000) |
b DECO-GARCH |
|||||||||
|
Panel C: Diagnostic tests |
||||||||||
|
2.06946 [0.995] |
4.46374 [0.924] |
27.3996 [0.002] |
6.84467 [0.740] |
5.94312 [0.820] |
12.1012 [0.278] |
7.06285 [0.719] |
6.39950 [0.780] |
8.71097 [0.559] |
7.97157 [0.631] |
Q2(10) |
|
24354.٠ [0.00000] |
1382.2 [7.1900] |
11545.٠ [0.00000] |
3095.7 [0.00000] |
5826.3 [0.00000] |
1607.9 [0.00000] |
1008.0 [1.3072] |
1191.6 [1.7490] |
1257.5 [8.7743] |
1523.6 [0.00000] |
Jarque-Bera |
|
2699.52 [0.0000000] |
Hosking2(20) |
|||||||||
|
2696.91 [0.0000000] |
McLeod- Li2(20) |
|||||||||
Source: Prepared by the researchers based on the Ox-Metrics software The dynamic coefficient of correlation is statistically highly meaningful (0.143664), thus indicating a modest degree of market integration. In a nutshell, the coefficient of variation (a DECO-GARCH) is positive and substantial, indicating the relevance of cross-market innovations. Likewise, the coefficient (b DECO-GARCH) shows statistical significance in all cases, which indicates high correlation and the impossibility of the stability of fluctuations between markets. In other words, equal relations depend greatly on previous relations for the financial markets of the study sample. In addition, the total estimations of (a DECO-GARCH) or (b DECO-GARCH) are approximately equal to one, indicating that there is an ongoing equilibrium between each of the financial markets indicator for the study sample; in other words, it becomes clear that the changes in the first variable quickly follow the changes in the second variable and vice versa, and so the system becomes balanced and stable as financial markets indicators are equally affected by the indicate changes of the other financial market. This, therefore, indicates that the dynamic correlation is strong between these indicators; moreover, the significance of the two variables emphasizes the suitability of the DECO-GARCH model, and thus we can confirm that the DECO-GARCH variables lie within the range of the normal standard estimates derived from the models used in GARCH (1,1). This suggests that the comparable position (correlations) throughout the market segments (variables) considered will be constant. These findings are in accord with the research conducted by Aboura and Chevallier (2014), Kang et al. (2019) and Li et al. (2020).
The diagnostic tests, as well as the Ljung-Box test results for the normalized square residues, are presented in Table 2 section C. These tests fail to dismiss the idea of a null hypothesis (H0) since there is no serial tracking for every scenario, which implies that the residuals do not reflect any sequential tracking. In addition, we performed the ARCH-LM univariate testing on the remainders to determine if the arch effect continued to exist in the model. During the research period, we observed that the arch effect caused no issues for any of the couples. The findings of the Hosking, McLeod, and Li tests likewise support the null hypothesis (H0), as there are no consecutive connections in the conditioned variations calculated by using the DECO-GARCH model.
Figure 4 describes the dynamic equal correlation between the volatility of the studied market returns. The line graph indicates a change over time, with a maximum association level of 5% to 35%. It is also clear that the volatility of the daily index returns experienced significant changes over time between highs and lows, which further emphasizes the need for a dynamic approach to managing international investment portfolios, because variations in the yield correlation can have a major influence on portfolio risk evaluation and the possibility of risk reduction through diversification. More importantly, we note a sharp rise in equal relations (correlations) during times of financial crisis and turmoil, such as the European economic crisis and the fall of the Shanghai Composite (Chinese stock market) in 2015–2016, and the Corona epidemic catastrophe (COVID-19) in 2020–2021.
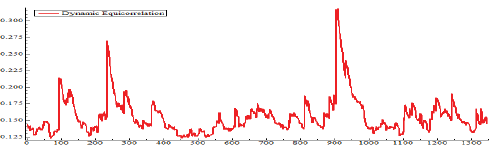
This means that the transmission of infection between financial markets, and the reason for this, is that, during major crises, investors increase their interaction with financial markets, which results in a rapid exchange of information and increased international trading, and that the political and economic decisions taken by central banks and governments during crises can affect all financial markets simultaneously; therefore, the interdependence between them increases significantly. In addition, it is the increasing movement of investors in times of crisis towards assets that are considered safe or resistant to risks, such as gold and government bonds, which results in a simultaneous motion in the stock market, and a reform, which, in turn, leads to a rise in the dynamically equal conditional relationship between the earnings of financial economies. Overall, the fluid conditioned equality between the investigated markets fluctuated substantially during the time frame of study, These findings lend credence to the notion of the influence of infection, which has been defined as a considerable rise in the connection between the stock markets in different nations during times of crisis and economic instability (Hung, 2020); (Kang et al., 2019). Figure 5 confirms the high common volatility of the yields of the studied indicators.
Looking at Figure 5, we can understand the reasons for the presence of dynamic equal conditioned correlation between indicators of Arab finance markets, which is the closeness of their responses to regional and international situations. Arab financial markets are linked to each other by increasing trade exchange among them, as well as to Arab political, economic, and financial decisions potentially having an impact on the performance of their financial markets, such as through interest policies, monetary measures, and economic measures. Similarly, the increase of dynamic equal conditional correlations over time between the indicators of developed countries is due to the similarity of their responses to regional and international conditions.
As for the correlations between yield fluctuations and the common movement apparent between certain Arab financial market indices, US stock market indices and the Chinese Shanghai index were affected by global political and economic events, such as the worldwide financial crisis, or changes in commodities, such as oil prices, which have a significant impact on financial market performance. In addition, developments in the financial technology (financial globalization) and the increasing integration of global financial markets have increased the speed of the transfer of financial information. This, in turn, influences capital flows, and hence the performance of the global stock market as a whole, because the economic and financial events that occur today in one country will quickly affect financial markets in other countries.
To highlight the uniform (equally dynamic) conditional and residual differences between the returns of the studied markets, we present the following figures:
Here, we estimate the dynamic equilibrium correlation matrix with the objective to examine whether fluctuations arising from a change in the return of one market can cause fluctuations in the returns of other markets. This is achieved by imposing a positive determination of the main diagonal elements in the correlation matrix; Table 3 illustrates this as follows:
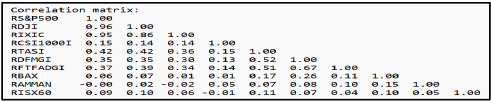
Table 3 shows that the majority of the connections between the studied markets’ returns were positive, with the exception of the connections between the earnings of the Amman, Jordan Stock Exchange’s public market (RAMMAN), and the returns of the US market for stocks (RS&P500) or the US technological stock market (RIXIC). Regarding the relationship between the earnings of the Iraq exchanges (RISX60) and the results of the Chinese market for stocks (Shanghai) (RCSI1000I), the positive correlations shown in Table (3) between the markets can be explained by the sensitivity of the returns of these markets to the changes that occur between them dynamically over time. In other words, economic changes in the index of any market affect the exchange of the rest of those markets in the identical guidance, as this empathy reached 96% of the earnings of the RDJI marketplace and the returns of the RS&P500 markets, 95% between the returns of the RIX marketplace and the RSP500, or 86% between the returns of the RIX market or the RDJI. This indicates the high level of alignment and strong correlation, as well as the parallel movement among the American financial markets with each other.
The results showed that the equal common dynamic correlations are positive between the returns of advanced global financial markets (the United States and China) and the returns of financial markets in Middle Eastern countries, and that fluctuations in the returns of American and Chinese financial markets are similarly reflected in the movements of returns in the financial markets of Middle Eastern countries. This result is consistent with such studies as Engle and Kelly (2012) and Diebold and Yilmaz (2012).
The equally dynamic conditional correlations over time between these markets can be explained by the similarity of their responses to regional and international conditions. The apparent positive correlations between the returns of Arab financial markets can also be explained by the similarity of their responses to regional and international conditions such as fluctuations in oil prices, fluctuations in global economic growth rates, as well as their implementation of extensive liberalization processes, which expanded the horizon for Arab investors to invest in financial instruments traded in the financial markets in the region, not to mention their economic openness, which exposes them to external shocks and the contagion of financial crises. Therefore, these processes lead them to taking a role in the joint movement in the market return fluctuations.
We also note that there are positive correlations of 42% between the returns of the Saudi Stock Exchange Index (RTASI) and the returns of the RS&P500 and DJI indices. Similarly, the correlations between the returns of financial market indices in the UAE and those of the US stock market indices were high and positive This result is consistent with a previous study (Aboura & Chevallier, 2014). The reason for this increase could be the significant impact of international capital flows between these countries (international investment effects). Global liquidity is also an essential factor in the linkages between financial markets. When there is a large flow of liquidity that positively affects financial markets, in addition, the role of technology and the media increases the possibility of investors following news and developments at the same time, and, therefore, this leads to the spread of effects on financial markets faster.
The negative correlation between the markets apparent in Table 3, which indicates that the returns of each of the two markets, including a negative correlation, tend to move in opposite directions and to different degrees. This link may allow investors to expand their portfolios while reducing the total risk. The difficulties experienced by the Arab nations in keeping up with changes in financial globalization are the causes of the poor positive correlations between their indicators and those of industrialized countries.
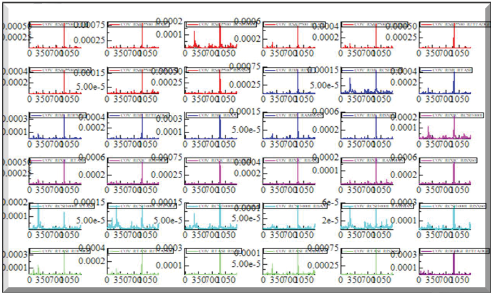
The projections of the DECO-GARCH model provide us with the expected dynamic equal conditional correlations over a period of 365 days, with the first and last matrices of the expected correlation being presented herein, as shown in the following tables:
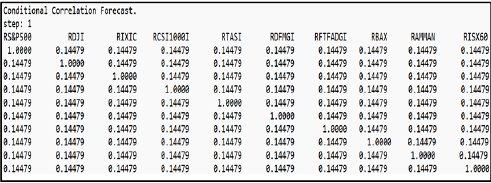
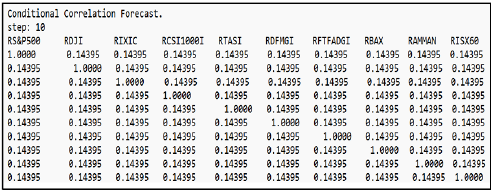
We note from Tables 4 and 5, which show us the expected correlation matrices for the expected changes in the relations (correlations) between the studied markets over the next 365 days, that the correlations in the first forecast are very similar to those in the second forecast that follows. However, the correlations in the last forecast have changed slightly, and therefore investors can use these expectations to predict the possible changes in the relations (correlations) between the study sample markets, while adjusting their portfolios accordingly, in order to achieve optimal diversification and risk management. It should be noted that these expectations are subject to a degree of uncertainty, and that actual correlations may differ from the expected values.
Based on the results we have obtained, financial investors in international financial markets can benefit from these findings in building their investment portfolios and avoiding the risks of fluctuations in these markets, as it has been shown that all international financial markets are positively correlated, which makes the transmission of crises between them significant and balanced. Therefore, no investor can make any of these markets a safe haven for their investment in other markets.
This study utilized the Dynamical Equivalent Connectivity (DECO-GARCH) model to confirm the combined movement (correlations) between the earnings of the stock market. It differs from previous models, especially from the DCC model, in the sense that it uses the historical data on assets to compute the pairwise correlations of assets (joint return volatilities) for all assets at once as represented by the returns of US stock markets (RS&P500, RDJI, RIXIC), the Chinese market for shares (Shanghai) (RCS1000I), and the volatility of the Saudi market (RTASI), with the returns of the financial markets in the United Arab Emirates represented by the those of the Dubai market (RDFMGI) and the FTSE for the Abu Dhabi market (RFTFADGI), as well as the returns of the markets of Bahrain, Jordan, and Iraq (RBAX, RAMMAN, RISX60), respectively, and based on daily data recorded during the period from 20 March 2014 to 12 March 2024.
The results showed that, at 96%, the returns of Market RDJI and Market RS&P500 had the strongest association, whilst the returns of Market RIXIC and Market RS&P500 had a 95% correlation. Eighty-six percent of the returns of Market RDJI and Market RIXIC were correlated. The returns of the RS&P 500 and DJI indices and the returns of the Saudi Stock Exchange Index (RTASI) have a 42% positive association. and it demonstrates that low positive connections between the Arab indices and those of industrialized countries are a result of the Arab countries’ struggles to keep up with changes in financial globalization. Likewise, there were strong and positive correlations between the results of the US stock market indices and those of the UAE financial market indices. This outcome is in line with a previous study (Aboura & Chevallier, 2014), as the results demonstrated that there are considerable time-varying associations between these markets. We detected a rise in equal relationships (correlations) between the 2015–2016 and 2019–2020 timeframes, which are the dates coinciding with the European financial crisis, the demise of the Chinese stock market, and the COVID-19 pandemic problem.
Generally, the state of conditional equivalency between the analyzed marketplaces changed substantially over the research period. These findings corroborate the notion of the impact of infection, which highlights the importance of considering the evolving nature of correlations between these markets when making asset allocation decisions. By using the future conditional correlation matrix, investors can modify their investment portfolios based on the kinds of assets they have in their portfolios and the changes in the returns of the worldwide financial markets over a period of 365 days. Therefore, investors in international financial markets and global financial decision-makers should consider the movements of asset returns in these markets and their impact on the global financial economy, as well as make their investment decisions and choose the financial assets through which the optimal investment portfolio is formed. Thus, it is necessary to hedge against future crises by investing in other markets whose asset returns are inversely related to the returns of assets in these markets.
Our results provide a basis for future research, which would aim to deepen our understanding of the factors and reasons that lead to increased correlations between asset classes and their effects on international portfolio management, by incorporating structural change tests that can lead to an improved accuracy of estimated correlations and forecasting performance. Incorporation of these statistical recommendations into future research could contribute to a more robust analysis of correlations between different asset classes (financial and commodity), thus developing clearer and more effective strategies for asset allocation in the ever-changing financial markets. Future studies can be conducted to be applied to financial and commodity markets in countries that share unified economic policies, especially in the European Union countries, ASEAN countries, MENA countries, and BRICS countries by using the DECO-GARCH model.
Further study could investigate the influence of macroeconomic variables and commodities market indicators on equivalent dynamic correlations, as well as the applicability of the DECO-GARCH models to additional asset classes, and the creation of innovative methods for improving the foreign investment portfolios based on time-varying correlations. Furthermore, the inclusion of other markets – particularly commodity markets like those for gold and oil – as well as real estate markets in addition to financial markets is intended to give investors a better picture so they can build their investment portfolios in a way that maximizes returns and minimizes risks.
Wisam H. Ali Al-Anezi: formal analysis.
Ali Y. Abdullah Al-Joaani: methodology.
Abdulrazaq Shabeeb: writing – original draft.
Faisal Ghazi Faisal: writing – review and editing.
Aboura, S., & Chevallier, J. (2014). Volatility equicorrelation: A cross-market perspective. Economics Letters, 122(2), 289–295. https://doi.org/10.1016/j.econlet.2013.12.008
Aboura, S., & Chevallier, J. (2017). A new weighting-scheme for equity indexes. International Review of Financial Analysis, 54, 159–175. https://doi.org/https://doi.org/10.1016/j.irfa.2016.11.004
Aielli, G. P. (2013). Dynamic Conditional Correlation: On Properties and Estimation. Journal of Business & Economic Statistics, 31(3), 282–299. https://doi.org/10.1080/07350015.2013.771027
Al-Anezi, W. H. A., Mohammed, M. T., & Asaad, B. (2021). The Impact of Financial Liberalization on the Value of the Bank: An Applied Study on Private Iraqi Banks for the Period 2011-2017. Webology, 18(Special Issue 3), 462–476. https://doi.org/10.14704/WEB/V18SI03/WEB18108
Al-Anezi, W. H., Ali Y. Abdullah Al-Joaani, Shabeeb, A., Srayyih, F. H., & Faisal, F. G. (2025). The Relationship between the Wheat Market and the Financial Market in Malaysia Using a Dynamic Conditional Correlation Model (DCC-GARCH). Research on World Agricultural Economy, 6(1), 367–380. https://doi.org/10.36956/rwae.v6i1.1480
Al-Anezi, W. H. A., Al-Joaani, A. Y. A., Faisal Ghazi Faisal, Bha Aldan Abdulsattar Faraj, & Shabeeb, A. (2025). Measuring the Correlations between Stock Market Returns and Commodity Returns in the United States Using GARCH-M Models. Research on World Agricultural Economy, 6(2), 410–421. https://doi.org/10.36956/rwae.v6i2.1638
Alshenawy, F., & Abdo, D. A. (2023). Using Multivariate Dynamic Conditional Correlation GARCH model to analysis financial market data. Journal Of Business Research, 45(4), 34–64. https://doi.org/10.21608/zcom.2023.213791.1258
Bauwens, L., & Xu, Y. (2019). DCC-HEAVY: A multivariate GARCH model based on realized variances and correlations. Université Catholique de Louvain.
Bauwens, L., & Xu, Y. (2023). DCC- and DECO-HEAVY: Multivariate GARCH models based on realized variances and correlations. International Journal of Forecasting, 39(2), 938–955. https://doi.org/10.1016/j.ijforecast.2022.03.005
Cai, X. J., Tian, S., & Hamori, S. (2016). Dynamic correlation and equicorrelation analysis of global financial turmoil: evidence from emerging East Asian stock markets. Applied Economics, 48(40), 3789–3803. https://doi.org/10.1080/00036846.2016.1145349
Creti, A., Joëts, M., & Mignon, V. (2013). On the links between stock and commodity markets’ volatility. Energy Economics, 37, 16–28. https://doi.org/10.1016/j.eneco.2013.01.005
Diebold, F. X., & Yilmaz, K. (2012). Better to give than to receive: Predictive directional measurement of volatility spillovers. International Journal of Forecasting, 28(1), 57–66. https://doi.org/10.1016/j.ijforecast.2011.02.006
Engle, R. (2002). Dynamic conditional correlation: A simple class of multivariate generalized autoregressive conditional heteroskedasticity models. Journal of Business and Economic Statistics, 20(3), 339–350. https://doi.org/10.1198/073500102288618487
Engle, R., & Kelly, B. (2012). Dynamic Equicorrelation. Journal of Business & Economic Statistics, 30(2), 212–228. https://doi.org/10.1080/07350015.2011.652048
Hung, N. T. (2020). An analysis of CEE equity market integration and their volatility spillover effects. European Journal of Management and Business Economics, 29(1), 23–40. https://doi.org/10.1108/EJMBE-01-2019-0007
Hung, N. T. (2021a). Bitcoin and CEE stock markets: fresh evidence from using the DECO-GARCH model and quantile on quantile regression. European Journal of Management and Business Economics, 30(2), 261–280. https://doi.org/10.1108/EJMBE-06-2020-0169
Hung, N. T. (2021b). Directional Spillover Effects Between BRICS Stock Markets and Economic Policy Uncertainty. Asia-Pacific Financial Markets, 28(3), 429–448. https://doi.org/10.1007/s10690-020-09328-y
Hung, N. T., Nguyen, L. T. M., & Vo, X. V. (2022). Exchange rate volatility connectedness during Covid-19 outbreak: DECO-GARCH and Transfer Entropy approaches. Journal of International Financial Markets, Institutions and Money, 81(October 2021), 101628. https://doi.org/10.1016/j.intfin.2022.101628
Investing. (n.d.). https://sa.investing.com/markets
Kang, S. H., Uddin, G. S., Troster, V., & Yoon, S. M. (2019). Directional spillover effects between ASEAN and world stock markets. Journal of Multinational Financial Management, 52–53, 100592. https://doi.org/10.1016/j.mulfin.2019.100592
Kregždė, A., & Kišonaitė, K. (2018). Co-Movements of Lithuanian and Central European Stock Markets Across Different Time Horizons: a Wavelet Approach. Ekonomika, 97(2), 55–69. https://doi.org/10.15388/ekon.2018.1.11786
Li, R., Li, S., Yuan, D., & Yu, K. (2020). Does economic policy uncertainty in the U.S. influence stock markets in China and India? Time-frequency evidence. Applied Economics, 52(39), 4300–4316. https://doi.org/10.1080/00036846.2020.1734182
Ozdemir, O. (2022). Foreign Exchange Volatility and the Bubble Formation in Financial Markets: Evidence From The COVID-19 Pandemic. Ekonomika 101(1), 142–161. https://doi.org/10.15388/Ekon.2022.101.1.8
Xiao, J. (2017). Dynamic correlation among East Asian stock markets and time-varying interdependence between East Asian stock markets and the prices of oil and gold. Kobe University Repository.
Yilmaz, T. (2010). Improving Portfolio Optimization by DCC And DECO GARCH : Evidence from Istanbul Stock Exchange. Munich Personal RePEc Archive.
Zeren, F., & Yilanci, V. (2019). Are there Multiple Bubbles in the Stock Markets? Further Evidence from Selected Countries. Ekonomika,0 98(1), 81–95. https://doi.org/10.15388/Ekon.2019.1.5