 (3.1)
(3.1)Ekonomika ISSN 1392-1258 eISSN 2424-6166
2025, vol. 104(3), pp. 44–61 DOI: https://doi.org/10.15388/Ekon.2025.104.3.3
Mustafa Kevser
Bandırma Onyedi Eylül University, Manyas Vocational School, Balıkesir/Turkey
Email: mkevser@bandirma.edu.tr
ORCID: https://orcid.org/0000-0003-0586-1662
Merve Altaylar
Koc University Data Science, Istanbul, Turkiye
Email: mervealtaylar37@gmail.com
ORCID:.https://orcid.org/0000-0001-5413-5048
Ufuk Bingöl*
Bandırma Onyedi Eylül University, Manyas Vocational School, Balıkesir/Turkey
Email: ubingol@bandirma.edu.tr,
ORCID: https://orcid.org/0000-0003-1834-842X
Zaim Reha Yaşar
Kırıkkale University, Faculty of Economics and Administrative Sciences,
Department of Economics, Kırıkkale-Türkiye
Email: reha@kku.edu.tr
ORCID: https://orcid.org/0000-0001-7466-6137
Abstract. This paper delves into the fundamental reasons behind the non-stationary behavior of Housing Prices (HP) in different regions of Türkiye, which have witnessed an intensified surge fueled by recent aggressive fluctuations. The primary objective is to ascertain whether the driving force behind the escalating HP stems from a housing bubble, or if it can be predominantly attributed to the unprecedented levels of inflation that Türkiye has been experiencing in recent times. This study adopted a comprehensive approach by employing advanced panel PANICCA and GSADF cointegration test techniques to identify the presence of common factors between HPI and inflation from January 2010 to January 2023 to resolve this dilemma. The outcomes strongly suggest that the observed stationarity in HPI predominantly originates from the influence of common factors. More importantly, it has been revealed that disregard of the relevant common variables in the standard factor model may lead to misleading conclusions, such as the misidentification of housing bubbles. This underscores the significance of accurately accounting for the impact of common factors in order to avoid potential distortions in assessing market dynamics and potential risks.
Keywords: Price bubbles, house prices, inflation, panel GSADF, PANICCA.
________
* Correspondent author.
Received: 23/12/2024. Revised: 26/05/2025. Accepted: 26/05/2025
Copyright © 2025 Mustafa Kevser, Merve Altaylar, Ufuk Bi̇ngöl, Zaim Reha Yaşa. Published by Vilnius University Press. This is an Open Access article distributed under the terms of the Creative Commons Attribution License, which permits unrestricted use, distribution, and reproduction in any medium, provided the original author and source are credited.
Fluctuations in asset prices have systematically been a critical subject in economics. Researchers consider extraordinary price rises to be speculative asset bubbles, characterized by irrational optimism and market overvaluation (Hommes et al., 2008; Gürkaynak, 2008). Economists have analyzed the mechanisms underlying such bubbles, while questioning the rationality of market participants and assessing the causes and consequences of sudden price surges. Beyond speculative phenomena, modern economies are facing numerous macroeconomic challenges, with inflation is as one of the most critical aspects. Most countries have adopted stringent monetary policies to combat inflation, often involving interest rate hikes to curtail consumption and dampen demand. In contrast, Türkiye represents an exceptional case, prioritizing economic growth through low-interest policies despite enduring chronic inflationary pressures.
A higher inflation disrupts economies by eroding purchasing power and exacerbating uncertainty. Its adverse effects are particularly acute in essential sectors such as food and housing, where price bubbles and imbalances can jeopardize basic human needs. Persistent inflation challenges societal stability, as individuals struggle with diminished access to affordable housing and face significant uncertainty in the market. This issue demands urgent attention, as price imbalances in the Housing Market (HM) often result from structural economic problems and can become long-term constraints on welfare.
This paper aims to identify the dominant forces shaping Türkiye’s HPs and to evaluate whether inflationary pressures or speculative bubbles are the primary drivers. Unlike previous studies, this research integrates the PANICCA and GSADF tests to analyze the intricate relationship between HP and inflation in Türkiye. While these techniques are widely used, their application to a market characterized by extreme volatility offers unique insights, thereby distinguishing this study from the already existing literature by testing two hypotheses: (1) Inflation predominantly drives HP increases, (2) mitigation of inflation can stabilize the HM. Türkiye provides a compelling case study due to its sustained high inflation rates, reaching 85% in 2022, which is relatively higher than that of the U.S. and Eurozone. This chronic issue necessitates an in-depth analysis of the Turkish HM in order to determine whether the observed price increases are cyclical or permanent. The findings reveal that price increases in the Turkish HM are a direct consequence of inflation rather than speculative bubbles.
This study consists of five sections. Following the introduction, the second section examines the existing literature. The third section presents the data and methodology employed, and shares the findings. Section four discusses the results of this research. Finally, the conclusion presents an evaluation of the findings and avenues for future research.
There is an extensive research on asset and HP bubbles, encompassing various markets and employing diverse methodologies (Gürkaynak, 2008; Ren et al., 2012; Dreger & Kholodilin, 2013; Scherbina & Schlusche, 2014; Bourassa et al., 2019). These studies highlight the characteristics of bubbles. For instance, Ren et al. (2012) applied rational expectations hypothesis to the Chinese HM but found no evidence of a bubble, while Jang et al. (2018) demonstrated that speculative investments and rental price spillovers drive housing bubbles in South Korea. Vogiazas and Alexiou (2017) revealed that credit-driven economies trigger the propagation of real estate bubbles in OECD economies.
Macroeconomic variables play a critical role in shaping HP dynamics. Factors such as inflation, interest rates, credit availability, and economic growth often interact to influence prices (Case & Shiller, 2003; Tsatsaronis & Zhu, 2004). Malmendier and Wellsjo (2023) found that inflation expectations significantly drive HP, with homeowners viewing real estate as a hedge against inflation. Similarly, Balli et al. (2019) reported a positive correlation between inflation and house price increases, noting that larger regions are more sensitive to shocks.
Some researchers argue that inflation may not always lead to HP increases. Katrakilidis and Trachanas (2012) suggest that rising inflation can deter real estate investments by increasing nominal costs, while Oikarinen (2009) contends that low inflation can encourage housing demand due to money illusion and tilt effects. Cohen and Karpavičiūtė (2017) even assert that inflation is not causally linked to HPs, thus emphasizing the multifaceted nature of these relationships.
In the Turkish context, Coskun and Jadevicius (2017) and Coskun et al. (2020) found no evidence of bubbles in Türkiye’s HM, by attributing price increases to lax credit regulations and macroeconomic conditions. Kırca and Canbay (2022) and Akça (2023) identified inflation, exchange rates, and housing loans as key drivers of HP, while Korkmaz (2020) highlighted bidirectional causality between HP and inflation; likewise, Muddasir and Dondaş (2023) revealed significant correlations between HP and factors such as the GDP growth, interest rates, and inflation, providing insights into the economic determinants of HM dynamics in Türkiye. Yıldırım and Ivrendi (2021) demonstrated that monetary policy and housing demand shocks significantly influence prices. Similarly, Akpolat (2024) revealed that real effective exchange rates symmetrically affect housing prices.
Beyond Türkiye, researchers have explored the role of speculative bubbles and credit expansion in driving price increases. Jordà et al. (2020) emphasized how loose lending standards and credit availability encourage speculative behavior, leading to unsustainable HP growth. Hoffman and Schnabl (2011) linked credit expansion to price bubbles, while Glaeser and Nathanson (2017) demonstrated a strong correlation between credit easing and HP appreciation in the U.S.
There is a growing body of research in recent years on HPs for emerging markets. For instance, Chenguang (2025) investigates the presence of housing bubbles across six cities in China. The study concludes that price bubbles are observed only in the smaller cities, based on a classification of the cities according to their level of economic development. In addition to inflation, factors such as the housing demand, economic growth outlook, exchange rate volatility, stock market fluctuations, credit expansion, and depreciation of local currencies have also been identified as key triggers of HP bubbles in emerging markets (Mahmoudinia et al., 2022; Chee Yin et al., 2024; Doruk, 2024).
Collectively, these studies underscore the complex and multifaceted nature of HP dynamics, shaped by macroeconomic factors, speculative behavior, and policy interventions. This study contributes to the literature by focusing on the interplay between inflation and HPs in Türkiye, offering insights into how inflationary pressures shape market dynamics and drive price imbalances.
The Data Generation Process (DGP) for the interest variable yi,t is supposed to follow a Common Factor (CF hereafter) model shown as (Reese and Westerlund, 2016):
(3.1)
where Dt,p is a polynomial trend structure; λi is the corresponding vector of factors; Fi is an rx1 dimensional vector of CFs, and ei,t is an İdiosyncratic Error (IE hereafter). The Dt,p element involves that constant where p = 0, whereas the other element is a constant and trend where p = 1. With the rising findings of co-movements among HPI and major macroeconomic variables such as the inflation rate, exchange rate (e.g., Katrakilidis and Trachanas, 2012; Christou et al., 2019; Xu and Zhang, 2023), this approach seems emphatically acceptable then to allow for additional variables (in other words, covariate), as proposed by Reese and Westerlund (2016). Hence, a vector of covariates demonstrated as xi,t is described with the following DGP:
 (3.2)
(3.2)
where xi,t is an m×1 dimensional vector of covariates; ui,t is an m×1 dimensional vector of IE. Eventually, xi,t is supposed to share the CFs of yi,t, and then the DGP for the mixed variables demonstrates:
 (3.3)
(3.3)
Here, Вi = (ai βi); φt,p = (λi δi) following the rx(m+1) matrix dimension and, νi,t = (ei,t; ui,t)′. Reese and Westerlund (2016) suggest that, since the first differenced interest variable, which removes any uncertainty concerning its order of integration, is employed in the estimation procedure, then, any proposed method for CF models can be applied to estimate Eq. (3.3). Reese and Westerlund (2016) also estimated  and
and  with the null hypothesis of ρ1 = ρ2 = ... = ρk = 1. Three test statistics are suggested by the unit root test of
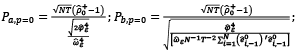
  each for p = 0, and p = 1 are demonstrated as Pa,p, Pb,p, and PMSBp (Panel Modified Sargan–Bhargava) tests. When p = 0 (in Equations 3.4 and 3.5):
 (3.4)
(3.4)
 (3.5)
(3.5)
and, when p = 1 (in Equations 3.6 and 3.7):
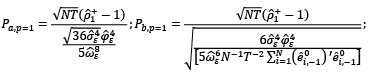 (3.6)
(3.6)
 (3.7)
(3.7)
where,  and
and  are AR(1) coefficients, respectively, computed as
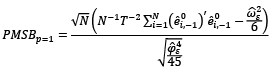
 and
and  . The null hypothesis, which posits the presence of a unit root in the idiosyncratic components across all panels, is tested by using the Pa,p, Pb,p, and PMSBp test statistics.
Pesaran (2007) developed a new approach to cope with the issue of cross-section dependence (CSD) and considered a one-factor structure with heterogeneous loading factors for residual series. On the other hand, the test extends the classic Augmented Dickey-Fuller (ADF) regression with the CSD mean of lagged levels, and first-differences of the series (Dickey & Fuller, 1979). If residual series are not serially correlated, the model used for the i.th cross-section is described as follows:
 (3.8)
(3.8)
where  , and
, and  . ti (N,T) statistics are calculated through ρi in Equation (3.8). Pesaran (2007) unit root test is based on the individual cross-sectionally ADF statistics (CADF). CADF statistic (let us remark that there is also truncated version of this statistic, denoted by CADF*) works as follows:
 (3.9)
(3.9)
Pesaran (2007) proposed simulated critical values of CIPS for various sample sizes.
To catch price bubbles, we employ the GSADF procedure proposed by Phillips et al. (2015) since GSADF was a more effective process in an attempt to identify multiple bubbles (Li et al., 2020; Su et al., 2020). The Supremum ADF (SADF) and standard ADF unit root test contributed to the development of GSADF. As emphasized by Khan et al. (2021); El Montasser et al. (2018); Bettendorf & Chen (2013), the GSADF test does not lose power when the time series analyzed is long, even in the case of multiple bubble scenarios. This is critical in the long period adopted in this study. The GSADF test (time series format) procedure is defined as follows (Phillips et al., 2015; Caspi, 2017; Hu & Oxley, 2018):
 (3.10)
In Eq. (3.10), r0 is the min. length of the Test Window (TW); r1 is the start point of TW; r2 is the end point of TW, and ADF is the standard ADF test statistic value. The test statistic’s value takes into account not only the change at the test’s endpoint but also various starting points for TW (Su et al., 2020; Potrykus, 2023). Price bubbles arise in cases when the GSADF statistic crosses the critical values obtained by Bootstrap methods or MC simulations. If the GSADF test statistic falls below the obtained critical value, there is no significant evidence for rejecting the null hypothesis of the absence of bubbles. In case bubbles are detected within the analyzed feature, the next step involves utilizing the backward SADF (BSADF) test to pinpoint the date when these bubbles emerged. This process is also explained in (Phillips et al., 2015), and the calculation way for the presently mentioned test is as outlined in Eq. 3.11 (Caspi, 2017; Hu and Oxley, 2018):
 (3.11)
What regards the part of this research which is related to prices bubbles, the investigation of the individual 26 HPI series for the analyzed aspects, the bubble analysis was also conducted for the panel data format, and the technique for detecting and date-stamping bubbles was employed. The value of the panel BSADF (abbreviated as PBSADF hereafter) test statistic and the value of the panel GSADF test (PGSADF hereafter) statistic, employed to identify the temporal occurrence of price bubbles, for N individual series were defined as follows, respectively (Vasilopoulos et al., 2020):
 (3.12)
 (3.13)
The following method is suggested to calculate the r0 value in (3.10), (3.11), (3.12), and (3.13) (Phillips et al., 2015; Caspi, 2017; Vasilopoulos et al., 2022):
 (3.14)
where T is the time dimensional (number of observations).
Pedroni (1999, 2004) developed a residual-based cointegration test for the null hypothesis of cointegration relationship for dynamic panels with multiple features in which the long-run coefficients and the short-run dynamics are permitted to be non-homogenous across groups (individuals). This cointegration test allows for individual heterogeneous Fixed Effects (FEs) and trend (deterministic), while no exogeneity restrictions are imposed on the features of the cointegrating equations. This test requires residual estimation from the cointegrating long-run relation for yit (Pedroni, 1999, 2004; Barbieri, 2009):
 ;
;
i = 1,…,N; t = 1,…,T and k = 1,…,K (3.15)
where T is the time dimensional, N is the number of individuals, and K is the number of independent variables yit, whereas xkit is assumed to be first-degree integrated for each individual of the panel, and under the null hypothesis of no cointegration. Also, in the equation, ai and δi are FEs and individuals-based linear deterministic trend, respectively, and βki parameters are the slopes. In this test, Pedroni (1999, 2004) employs seven statistics. Four of these are based on within-dimension (panel) statistics: the panel t-statistic (nonparametric), the panel t-statistic (parametric), the panel ρ-statistic, and the panel v-statistic. The remaining three statistics are based on between-dimension (group) statistics: the group t-statistic (nonparametric), the group t-statistic (parametric), and the group ρ-statistic.
This study evaluates the behavior of HPIs in Türkiye with the monthly data from January 2010 to January 2023. The HPIs data were collected from the Turkish Central Bank (CBRT) Electronic Data Delivery System (EVDS) (Table 1).
The HPI value (2010=100), as provided by EVDS, is divided into hedonic and non-hedonic HPI. The non-hedonic HPI is available for all 26 regions in Türkiye (please see the metadata).
The hedonic HPI is divided into two subcategories: new dwellings and existing dwellings. It is available only for the three larger cities in Türkiye, namely Istanbul, Ankara, and Izmir. The general HPI covering 26 regions and the hedonic new HPI covering three provinces and the hedonic non-new HPI were adjusted for inflation. In this process, adjustment techniques similar to those employed in Glaeser and Nathanson (2017)’s study1 were used.
|
Variables |
Number of Regions |
Abbreviation |
Transformation |
Data Sources |
|
Housing Prices Index |
26 |
HPI |
Raw (Non-inflation adjustment) |
EVDS |
|
Real Housing Prices Index |
26 |
RHPI |
Inflation Adjustment |
EVDS |
|
Real Hedonic New Housing Prices Index |
3 |
RHNHPI |
Inflation Adjustment |
By authors |
|
Real Hedonic Non-new Housing Prices Index |
3 |
RHNNHPI |
Inflation Adjustment |
By authors |
|
Hedonic New Housing Prices Index |
3 |
HNHPI |
Raw (Non-inflation adjustment) |
EVDS |
|
Hedonic Non-New Housing Prices Index |
3 |
HNNHPI |
Raw (Non-inflation adjustment) |
EVDS |
|
Consumer Prices Index |
Non-regional |
CPI |
Raw |
EVDS |
Table 2 illustrates a summary of the variables. The peaks of HPIs and inflation coincide with the latter stages of the current period without exception. Furthermore, the HPIs and the max. and min. points of inflation in Türkiye changed significantly.
|
Variables |
Observation (NxT) |
Mean |
Median |
St. Deviation |
Maximum |
Minimum |
|
HPI |
4.082 (26x157) |
127.6137 |
92.4000 |
120.7135 |
1072 |
36 |
|
RHPI |
4.082 (26x157) |
61.8202 |
52.9161 |
64.4403 |
756.2908 |
-271.562 |
|
CPI |
157 (1x157) |
364.8669 |
261.76 |
220.8546 |
1203.48 |
174.07 |
|
RHNNHPI |
471 (3x157) |
57.9476 |
50.3116 |
59.5608 |
603.2897 |
-258.964 |
|
RHNHPI |
471 (3x157) |
60.2455 |
51.2691 |
62.0965 |
573.5661 |
-253.511 |
|
HNHPI |
471 (3x157) |
129.4932 |
90.30 |
140.4061 |
854.10 |
35.9 |
|
HNNHPI |
471 (3x157) |
121.1724 |
90.50 |
119.4296 |
717.60 |
35.9 |
Before proceeding with the panel right tailed test (panel GSADF test for explosive behaviors), we investigate the stationarity of variables, and the CIPS and PANICCA for exploring unit roots are utilized. The core superiority of the second generation tests is that they are able to allow for CSD. CSD between series can lead these tests to overreject the null hypothesis of a unit root (O’Connell, 1998), and we examine the significance of CSD by utilizing the Breusch and Pagan (1980)’s LM test before employing panel unit root tests.
|
Variables |
LM Test Statistics |
p-value |
|
HPI |
50728.76*** |
0.0000 |
|
RHPI |
49226.52*** |
0.0000 |
|
RHNNHPI |
457.6091*** |
0.0000 |
|
RHNHPI |
465.6886*** |
0.0000 |
|
HNHPI |
468.5942*** |
0.0000 |
|
HNNHPI |
468.8020*** |
0.0000 |
LM test results provide compelling evidence of a significant CSD in HPI across regions in Türkiye in Table 3. The results imply that HPs across all 26 regions are interconnected, thus suggesting that price fluctuations in one region influence those in others. CSD demonstrates the absence of independence between regions and highlights the potential for price movements to propagate across the HM. CSD emerges as a result of shared economic factors, regional linkages, or the transmission of macroeconomic shocks nationwide. The LM test result demonstrates a strong interdependence among the HPI of the regions, reflecting the interconnected nature of the HM. Therefore, second generation panel unit root tests should be employed in the rest of the analysis in order to avoid the tendency to overreject the unit root hypotheses.
We first apply a conventional second generation panel unit root test (i.e., CIPS) for the HPIs, as presented in Table 4. The CIPS test is employed to evaluate the stationarity process of both inflation-adjusted and non-inflation-adjusted HP indices, aiming to identify their mean reverting behaviors or deviations from the mean over time. Such behaviors are critical, as non-mean reverting movements may correspond to the unit root process, but they can also imply an explosive root behavior associated with speculative price bubbles. Rejection of the null hypothesis indicates a stationary process, where bubble dynamics are not significant. However, failure to reject the null hypothesis suggests that the process may either exhibit unit root characteristics, or potentially include explosive root behaviors.
|
Variables |
CIPS Statistics (Level) |
CIPS Statistics (I. Difference) |
||
|
Intercept |
Intercept & Trend |
Intercept |
Intercept & Trend |
|
|
HPI |
-1.216 |
-1.386 |
-5.714*** |
-5.893*** |
|
RHPI |
-5.342*** |
-5.940*** |
- |
- |
|
RHNNHPI |
-5.967*** |
-6.420*** |
- |
- |
|
RHNHPI |
-5.443*** |
-5.699*** |
- |
- |
|
HNHPI |
-1.050 |
-0.253 |
-6.190*** |
-6.420*** |
|
HNNHPI |
-0.918 |
-1.865 |
-6.189*** |
-6.355*** |
The findings based on the CIPS test demonstrate that the RHPI, RHNNHPI, and RHNHPI, which represent the HPI adjusted for inflation, are stationary, while the variables HPI, HNHPI, and HNNHPI, which are not adjusted for inflation, are non-stationary (I(1)). This finding is extremely critical because all inflation-adjusted HPIs move under a stationary process, and it clearly reveals that inflation significantly directs the uncertainty level of HPIs.
|
Variables |
t Statistics |
Sieve Bootstrap CV 90 |
Sieve Bootstrap CV 95 |
Sieve Bootstrap CV 99 |
Ongoing |
|
HPI |
24.9810*** |
0.4828 |
0.5354 |
0.6330 |
Yes |
|
RHPI |
-0.1500 |
0.0476 |
0.0573 |
0.0936 |
- |
|
RHNNHPI |
0.1588 |
0.3438 |
0.4589 |
0.7574 |
- |
|
RHNHPI |
0.5216 |
0.5522 |
0.6951 |
0.9617 |
- |
|
HNHPI |
6.2284** |
5.0735 |
5.9653 |
9.6983 |
Yes |
|
HNNHPI |
5.1207** |
3.8683 |
4.4891 |
6.3443 |
Yes |
The panel GSADF test is a recently developed method to identify explosive behaviors and price bubbles in the panel data operating under the null hypothesis of no speculative bubbles. A main advantage of the panel GSADF test is its ability to detect multiple bubbles over time while accounting for dependency between regions, which makes it particularly appropriate for interconnected markets, such as Türkiye’s 26 regions where interdependence has been detected. Moreover, the test effectively captures both the emergence and persistence of speculative price behaviors, providing findings into Türkiye’s HM.
The results of the panel GSADF test for HPIs provide strong evidence that there is no presence of any rational price bubble in inflation-adjusted HPIs, while, in non-inflation-adjusted indices, they indicate the existence of an ongoing price bubble. The findings are parallel to expectations since the ongoing inflation problem in Türkiye is also reflected in the HPIs through the market.
Table 6 demonstrates the findings of the Pedroni2 panel cointegration analysis. It is clearly observed from both the panel and the group statistics that there is cointegration between non-inflation-adjusted indices and inflation. Therefore, HPIs and inflation possess common factors. To robustly check out the findings and make the analysis as detailed as possible, we employ tests based on common factors and idiosyncratics.
|
HPI-CPI |
HNHPI-CPI |
HNNHPI-CPI |
|||||||||
|
Panel Statistics |
Statistics |
Group Statistics |
Statistics |
Panel Statistics |
Statistics |
Group Statistics |
Statistics |
Panel Statistics |
Statistics |
Group Statistics |
Statistics |
|
v |
-3.054*** |
ρ (rho) |
5.780*** |
v |
1.856 |
ρ (rho) |
3.096*** |
v |
-1.128 |
ρ (rho) |
3.829*** |
|
ρ (rho) |
4.623*** |
t |
8.393*** |
ρ (rho) |
2.766** |
t |
6.122*** |
ρ (rho) |
2.729** |
t |
8.816*** |
|
t |
6.610*** |
ADF |
6.553*** |
t |
4.501*** |
ADF |
5.842*** |
t |
6.071*** |
ADF |
6.335*** |
|
ADF |
5.049*** |
ADF |
4.441*** |
ADF |
4.010*** |
||||||
|
Panel A. Without Covariate |
|||||||||||
|
HNHPI |
HPI |
HNNHPI |
|||||||||
|
Common Factors |
Statistics |
Idiosyncratic Components |
Statistics |
Common Factors |
Statistics |
Idiosyncratic Components |
Statistics |
Common Factors |
Statistics |
Idiosyncratic Components |
Statistics |
|
ADF |
12.2752 |
P_a |
-0.879 |
ADF |
11.4378 |
P_a |
-1.933** |
ADF |
10.9003 |
P_a |
0.343 |
|
P_b |
-0.943 |
P_b |
-1.427 |
P_b |
0.556 |
||||||
|
PMSB |
0.224 |
PMSB |
-0.592 |
PMSB |
2.316 |
||||||
|
Panel B. Inflation as Covariate |
|||||||||||
|
HNHPI |
HPI |
HNNHPI |
|||||||||
|
Common Factors |
Statistics |
Idiosyncratic Components |
Statistics |
Common Factors |
Statistics |
Idiosyncratic Components |
Statistics |
Common Factors |
Statistics |
Idiosyncratic Components |
Statistics |
|
MQ_c |
-18.713*** |
P_a |
-1.836** |
MQ_c |
8.722*** |
P_a |
-8.023** |
MQ_c |
-19.594*** |
P_a |
-1.484* |
|
MQ_f |
-4.887*** |
P_b |
-1.665** |
MQ_f |
-4.661*** |
P_b |
-2.718** |
MQ_f |
-8.408*** |
P_b |
-1.141 |
|
PMSB |
-0.614 |
PMSB |
-1.051 |
PMSB |
-0.502 |
||||||
Once we have established that inflation and HPIs share common factors (see Table 6), we proceed to apply the PANICCA test by Reese and Westerlund (2016). This test allows us to conduct separate stationary analyses of the CFs and ICs.
Table 7 Panel A presents the findings of the PANICCA test for non-inflation-adjusted HPI. Notably, the test procedure refrains from including a common factor. The findings robustly indicate that the null hypothesis, which posits the presence of a unit root, remains unassailable for both hedonic HPI and the HPI.
Table 7 Panel B demonstrates the findings of the PANICCA test for non-inflation-adjusted HPI. However, a notable distinction is made this time by incorporating inflation, which has been proofed as a common factor through the Pedroni Panel Cointegration Test (PPCT) into the test procedure. The findings unequivocally reject the null hypothesis, positing the presence of the unit root for both hedonic HPI and the HPI (both for common factors and idiosyncratic components). These results foreground the stationarity of HPIs. Hence, the significant finding of stationarity resulting from the inclusion of inflation as a common factor demonstrates that the predictability of HPI can be possible by taking inflation into account. This underscores the importance of considering inflationary factors when analyzing and forecasting HM dynamics.
The findings of the LM cross-section dependence test, the CIPS panel unit root test, the panel GSADF explosive behavior test, PPCT, and the PANICCA unit root test provide six critical insights, as follows.
Firstly, the LM statistics present strong evidence, indicating the presence of CSD in HPIs, irrespective of whether they are adjusted for inflation or not. Therefore, it is imperative to acknowledge and into take account this identified dependence among Türkiye’s regions when conducting tests for stationarity and investigating price bubbles. Such considerations can only be effectively addressed through the application of advanced panel data analysis techniques. This research distinguishes itself by employing the panel GSADF test, which does not ignore this CSD issue, particularly in its exploration of the presence of price bubbles.
Secondly, in the examination of HPIs behavior, the study initially employed the CIPS panel unit root test, revealing strong evidence that inflation-adjusted HPIs are stationary, while non-adjusted indexes are non-stationary. This observation highlights the influence of inflation on occurring uncertainty into HPIs. Regarding the important question of whether housing bubbles do actually exist, the study turned to the panel GSADF test, which, under the assumption of CSD (with the sieve bootstrap), can detect multiple bubble formations. The panel GSADF statistics demonstrate the persistent presence of multiple bubble formations in non-adjusted HPI. However, when the inflation effect is removed from the HPI, the GSADF statistics fail to provide any substantiation of bubble formation throughout the examined period. This finding stands as a significant contribution of this study, as it highlights that inflation not only adds uncertainty but also creates the illusion of an explosive behavior with its pronounced and aggressive surges.
Thirdly, the findings obtained thus far have demonstrated the need to scrutinize inflation. Thus, in the subsequent phase, we investigated the presence of a common component between inflation and HPI (non-adjusted indexes) through the employment of the PPCT (it was used to determine the variable to be assigned as a covariate in the PANICCA test). Both the group and panel statistics of the test yielded mutually reinforcing outcomes, indicating the existence of shared factors between inflation and all non-adjusted HPI.
Fourthly, where there are not any covariates, the findings demonstrate that nonstationarity behavior in non-inflation adjustment HPIs of Türkiye’s regions is due to both the common factors (ADF and its probability) and idiosyncratic components as all the statistics (P_a, P_b, and PMSB) are not statistically significant.
Fifthly, the addition of common factors alters the findings of the test for all data samples (according to regions). This result is a robustness check against alternative possibilities when evaluating the PANICCA test. These new pieces of evidence provided from the inclusion of common factors demonstrate that the nonstationarity behavior of HPI is linked to common factors. Furthermore, these findings demonstrate a remarkable alignment with the results acquired from the comparatively less complex CIPS test (see Table 4, where adjusted HPI series were stationary).
While inflation is widely recognized as the primary driver of HP fluctuations, other macroeconomic factors, such as interest rates (Kuttner & Shim, 2016), credit availability (Favara & Imbs, 2015), and demographic shifts (Zavisca & Gerber, 2016), also exert significant influence. For example, access to affordable credit can stimulate the housing demand, whereas demographic changes might reshape the long-term patterns of HPs. Although these factors are beyond the immediate focus of this study, their potential interactions with inflationary dynamics highlight valuable avenues for exploration in future research.
As a conclusion based on these new pieces of evidence, an attempt at ignoring the covariate(s) (as a macroeconomic indicator of inflation) in the panel unit root examining processes of regional HPIs may lead to misleading inferences.
Economic and social transformations have led to diversification of the factors influencing HPs. However, particularly in the context of emerging economies, it remains a subject of debate whether the current trends in HPs reflect the formation of a speculative bubble or a consequence of the broader global inflationary environment. The reason behind the rationale of the argument that direct inflation is the primary driver of HPs in this research is that Türkiye has been facing chronic inflation since its establishment. Thus, demand in the Turkish HM is linked directly to inflation and is utilized as a hedging tool by people. Demand shifts caused by inflation trigger price anomalies in the market, leading to volatility. Our findings suggest the presence of ongoing price bubbles; however, these were largely attributed to the inflation effect. After purging the HP indices of inflation, no evidence of bubbles was found, either regionally or nationally. It shows that the observed price increases are driven by inflation rather than speculative behavior.
The findings align with studies such as Coskun et al. (2020) and Coskun and Jadevicius (2017), which also found no evidence of bubbles in Türkiye’s HM, instead attributing price increases to fundamental economic factors like credit regulations, demand, and construction costs. Similarly, Akça (2023) emphasizes inflation, exchange rates, and housing loans as key drivers of housing inflation in Türkiye. The study also corroborates results obtained in Yıldırım and Ivrendi (2021) and Akpolat (2024), which explore the role of monetary policy and macroeconomic asymmetries in shaping HPs. The assumption that inflation expectations directly determine or influence HPs is consistent with the findings of Malmendier and Wellsjo (2023). Similarly, recent research by Kırca and Canbay (2022) focusing on the Turkish context reached comparable conclusions. In this regard, the existing literature supports our argument that inflation stands out as a major determinant of HPs, particularly in developing countries, such as Türkiye. These comparisons strengthen the argument that Türkiye’s HM is influenced more by structural economic factors than by speculative bubbles. In contrast to the findings of Cohen and Karpavičiūtė (2017), differences might be explained by the level of socio-economic development between countries. Moreover, the paradigm shift like political and financial crises, uncertainties, population growth, changes in consumer behaviors, as discussed in Katrakilidis and Trachanas (2012) and Oikarinen (2009), provide a rationale for these observed differences. Distinctively, this research underscores the amplifying role of speculative behavior in inflation-driven price surges, resonating with findings from Abildgren et al. (2018) and Case and Shiller (2003). However, unlike studies that focus on broader macroeconomic factors or sector-specific impacts (e.g., tourism in Balli et al., 2019), this study prioritizes inflation as the central explanatory variable.
While our findings indicate the absence of speculative bubbles at the aggregate level, it is essential to acknowledge that this may lead to the possibility of micro-level speculative activities or short-term price fluctuations. Investigating these dynamics would necessitate access to high-frequency or transaction-level data, which were not available for this study. Future research could delve into these micro-level phenomena in order to offer a more detailed understanding of speculative behaviors in HMs.
The data for the study from the EVDS provides reliable and consistent macroeconomic indicators. Nevertheless, the dataset does not capture informal housing transactions or region-specific disparities, thereby potentially limiting the comprehensiveness of the findings. Future research could overcome these limitations by incorporating data from alternative and/or supplementary sources.
The analysis is restricted to Türkiye and the January 2010 to January 2023 period, thus limiting the generalizability of findings to other contexts or longer-term trends. Comparative cross-country analyses could yield valuable insights into whether these findings reflect universal trends or are specific to particular economic contexts.
The findings underscore the need for targeted inflation control strategies to stabilize the HM. Policymakers should focus on inflation mitigation by implementing monetary policies aimed at reducing inflation so that to address HM imbalances and price volatility. With this perspective, it is essential that CBRT should manage the money supply and credit volume through commercial banks, acting within the framework of their independence and their role as lenders of last resort. Implementation of higher interest rates on housing loans can suppress demand in the HM, thereby contributing to a decline in prices. However, it is equally vital for policymakers to consider broader macroeconomic balances and support the housing supply through complementary fiscal measures. In this context, the coordinated use of both monetary and fiscal policy instruments is crucial to ensure effective and sustainable market outcomes. Additionally, development of forecasting models by incorporating inflationary trends into predictive models contributes to improving HM forecasts and policy planning. Housing affordability can be achieved by introducing subsidies, tax incentives, and affordable housing programs to mitigate the adverse effects of inflation on low- and middle-income households. Zoning reforms, by enhancing the housing supply elasticity through streamlined zoning regulations and public-private partnerships with the objective to increase housing availability, may be of use.
This study opens the way for further research on HP dynamics. The relationship between house prices and inflation is most likely bidirectional. While this study is interested in the impact of inflation on house prices, it must be noted that rising house prices can also cause inflation through their impact on household wealth and consumption. Future research could use structural modelling to explore these dynamics further. Additionally, future studies could investigate the role of migration patterns, rental price increases, and the total factor productivity in HMs. They may apply the methodology used in this study to other countries or regions with varying macroeconomic and HM conditions. These future studies may also explore the long-term impacts of inflationary pressures on housing affordability and ownership trends in emerging and developed economies.
Mustafa KEVSER: conceptualization, investigation, writing – original draft, writing – review and editing.
Merve ALTAYLAR: methodology, formal analysis, writing – original draft, visualization.
Ufuk BİNGÖL: conceptualization, writing – original draft, writing – review and editing.
Zaim Reha YAŞAR: conceptualization, writing – original draft.
Abildgren, K., Hansen, N. L., & Kuchler, A. (2018). Overoptimism and house price bubbles. Journal of Macroeconomics, 56, 1-14. https://doi.org/10.1016/j.jmacro.2017.12.006
Akça, T. (2023). House price dynamics and relations with the macroeconomic indicators in Turkey. International Journal of Housing Markets and Analysis, 16(4), 812–827. https://doi.org/10.1108/IJHMA-04-2022-0059
Akpolat, A. G. (2024). The asymmetric effects of real variables on real housing prices: a nonlinear ARDL analysis for Turkey. International Journal of Housing Markets and Analysis, 17(3), 565–590. https://doi.org/10.1108/IJHMA-09-2022-0143
Balli, H. O., Balli, F., Flint-Hartle, S., & Yang, X. (2019). Towards understanding the volatility of housing prices and exploring the tourism demand impact. Tourism Analysis, 24(4), 453-465. https://doi.org/10.3727/108354219X15652651367460
Barbieri, L. (2008). Panel cointegration tests: a survey. Rivista internazionale di scienze sociali, 3-36. https://www.jstor.org/stable/41625199
Bettendorf, T., & Chen, W. (2013). Are there bubbles in the Sterling-dollar exchange rate? New evidence from sequential ADF tests. Economics Letters, 120(2), 350-353. https://doi.org/10.1016/j.econlet.2013.04.039
Breusch, T. S. & Pagan, A. R. (1980). The Lagrange Multiplier Test and Its Application to Model Specification in Econometrics. Review of Economic Studies, 47, 239-253.
Bourassa, S. C., Hoesli, M., & Oikarinen, E. (2019). Measuring house price bubbles. Real Estate Economics, 47(2), 534-563. https://doi.org/10.1111/1540-6229.12154
Case, K. E., & Shiller, R. J. (2003). Is there a bubble in the housing market?. Brookings papers on economic activity, 2003(2), 299-362.
Caspi, I. (2017). Rtadf: Testing for bubbles with EViews. Journal of Statistical Software, 81. https://doi.org/10.18637/jss.v081.c01
Chee Yin, Y., Senadjki, A., Hui Nee, A. Y., & Ogbeibu, S. (2024). Identifying the Housing Bubble Predictors in Asian Emerging Economy: Exploring a Novel Model Based on Opinions. SAGE Open, 14(4). https://doi.org/10.1177/21582440241266321
Chenguang, L. (2025). Housing Price Bubbles in China: An Investigation of Six Cities. Academic Journal of Business & Management, 6, 229–235. https://doi.org/10.25236/AJBM.2024.060328
Christou, C., Gupta, R., & Nyakabawo, W. (2019). Time-varying impact of uncertainty shocks on the US housing market. Economics Letters, 180, 15–20. https://doi.org/10.1016/J.ECONLET.2019.03.029
Cohen, V., & Karpavičiūtė, L. (2017). The analysis of the determinants of housing prices. Independent journal of management & production, 8(1), 049-063. https://doi.org/10.14807/ijmp.v8i1.521
Coskun, Y., & Jadevicius, A. (2017). Is there a housing bubble in Turkey? Real Estate Management and Valuation, 25(1), 48-73. https://doi.org/10.1515/remav-2017-0003
Coskun, Y., Seven, U., Ertugrul, H. M., & Alp, A. (2020). Housing price dynamics and bubble risk: the case of Turkey. Housing Studies, 35(1), 50-86. https://doi.org/10.1080/02673037.2017.1363378
Dickey, D. A., & Fuller, W. A. (1979). Distribution of the estimators for autoregressive time series with a unit root. Journal of the American Statistical Association, 74(366), 427–431.
Doruk, Ö. T. (2024). Exploring the determinants of housing price bubbles in the Turkish economy: a COVID-related framework. International Journal of Housing Markets and Analysis, https://doi.org/10.1108/IJHMA-05-2024-0073
Dreger, C., & Kholodilin, K. A. (2013). An early warning system to predict speculative house price bubbles. Economics, 7(1), 20130008.
El Montasser, G., Naoui, K., & Fry, J. (2018). Speculative bubbles or explosive fundamentals in stock prices? New evidence from SADF and GSADF tests. Journal of Statistics and Management Systems, 21(1), 93-106. https://doi.org/10.1080/09720510.2017.1401799
Favara, G., & Imbs, J. (2015). Credit Supply and the Price of Housing. American Economic Review, 105(3), 958–992. https://doi.org/10.1257/AER.20121416
Glaeser, E. L., & Nathanson, C. G. (2017). An extrapolative model of house price dynamics. Journal of Financial Economics, 126(1), 147-170. https://doi.org/10.1016/j.jfineco.2017.06.012
Gürkaynak, R. S. (2008). Econometric tests of asset price bubbles: taking stock. Journal of Economic surveys, 22(1), 166-186. https://doi.org/10.1111/j.1467-6419.2007.00530.x
Hoffmann, A., & Schnabl, G. (2011). A vicious cycle of manias, crises and asymmetric policy responses–an overinvestment view. The World Economy, 34(3), 382-403. https://doi.org/10.1111/j.1467-9701.2011.01334.x
Hommes, C., Sonnemans, J., Tuinstra, J., & Van de Velden, H. (2008). Expectations and bubbles in asset pricing experiments. Journal of Economic Behavior & Organization, 67(1), 116-133. https://doi.org/10.1016/j.jebo.2007.06.006
Hu, Y., & Oxley, L. (2018). Bubble contagion: Evidence from Japan’s asset price bubble of the 1980–90’s. Journal of the Japanese and International Economies, 50, 89–95. https://doi.org/10.1016/j.jjie.2018.09.002
Jang, H., Ahn, K., Kim, D., & Song, Y. (2018). Detection and prediction of house price bubbles: Evidence from a new city. In Computational Science–ICCS 2018: 18th International Conference, Wuxi, China, June 11–13, 2018 Proceedings, Part III 18 (pp. 782-795). Springer International Publishing.
Jordà, Ò., Schularick, M., & Taylor, A. M. (2020). The effects of quasi-random monetary experiments. Journal of Monetary Economics, 112, 22-40. https://doi.org/10.1016/j.jmoneco.2019.01.021
Katrakilidis, C., & Trachanas, E. (2012). What drives housing price dynamics in Greece: New evidence from asymmetric ARDL cointegration. Economic Modelling, 29(4), 1064-1069. https://doi.org/10.1016/j.econmod.2012.03.029
Khan, K., Su, C. W., & Rehman, A. U. (2021). Do multiple bubbles exist in coal price. Resources Policy, 73, Article 102232. https://doi.org/10.1016/j.resourpol.2021.102232
Kırca, M. and Canbay, Ş. (2022), Determinants of housing inflation in Turkey: a conditional frequency domain causality, International Journal of Housing Markets and Analysis, 15(2), 478-499. https://doi.org/10.1108/IJHMA-02-2021-0013
Korkmaz, Ö. (2020). The relationship between housing prices and inflation rate in Turkey: Evidence from panel Konya causality test. International Journal of Housing Markets and Analysis, 13(3), 427–452. https://doi.org/10.1108/IJHMA-05-2019-0051
Kuttner, K. N., & Shim, I. (2016). Can Non-Interest Rate Policies Stabilize Housing Markets? Evidence from a Panel of 57 Economies. Journal of Financial Stability, 26, 31–44. https://doi.org/10.1016/J.JFS.2016.07.014
Li, Y., Chevallier, J., Wei, Y., & Li, J. (2020). Identifying price bubbles in the US, European and Asian natural gas market: Evidence from a GSADF test approach. Energy Economics, 87, 104740. https://doi.org/10.1016/j.eneco.2020.104740
Mahmoudinia, D., & Mostolizadeh, S. M. (2023). (A)symmetric interaction between house prices, stock market and exchange rates using linear and nonlinear approach: the case of Iran. International Journal of Housing Markets and Analysis, 16(4), 648–671. https://doi.org/10.1108/IJHMA-01-2022-0008/FULL/PDF
Malmendier, U., & Wellsjo, A. S. (2023). Rent or Buy? Inflation Experiences and Homeownership Within and Across Countries. https://papers.ssrn.com/abstract=4394555
Muddasir, M., & Dondaş, U. (2023). A 10-Year Analysis of Housing Prices and The Influence of Economic Factors in Turkey. Financial Internet Quarterly, 19(3), 100–112. https://doi.org/10.2478/FIQF-2023-0022
O’Connell, P. G. (1998). The overvaluation of purchasing power parity. Journal of international economics, 44(1), 1-19.
Oikarinen, E. (2009). Household borrowing and metropolitan housing price dynamics–Empirical evidence from Helsinki. Journal of Housing Economics, 18(2), 126-139. https://doi.org/10.1016/j.jhe.2009.04.001
Pedroni, P. (1997) Panel Cointegration; Asymptotic and Finite Sample Properties of Pooled Time Series Tests, with an Application to the PPP Hypothesis: New Results. Working paper, Indiana University. https://www.jstor.org/stable/3533533
Pedroni, P. (1999). Critical values for cointegration tests in heterogeneous panels with multiple regressors. Oxford Bulletin of Economics and Statistics 61, 653–670.
Pedroni, P. (2004). Panel cointegration: asymptotic and finite sample properties of pooled time series tests with an application to the PPP hypothesis. Econometric theory, 20(3), 597-625.
Pesaran, M. H. (2007). A simple panel unit root test in the presence of cross‐section dependence. Journal of applied econometrics, 22(2), 265-312.
Phillips, P. C. B., Shi, S. & Yu, J. (2015). Testing for Multiple Bubbles: Historical Episodes of Exuberance and Collapse in the S&P 500. Int.Eco.Rev., 56(4), 1043-1077.
Potrykus, M. (2023). Price bubbles in commodity market–A single time series and panel data analysis. The Quarterly Review of Economics and Finance, 87, 110-117. https://doi.org/10.1016/j.qref.2022.12.002
Reese, S., & Westerlund, J. (2016). Panicca: Panic on cross‐section averages. Journal of Applied Econometrics, 31(6), 961-981. https://doi.org/10.1002/jae.2487
Ren, Y., Xiong, C., & Yuan, Y. (2012). House price bubbles in China. China Economic Review, 23(4), 786-800.
Scherbina, A., & Schlusche, B. (2014). Asset price bubbles: a survey. Quantitative Finance, 14(4), 589-604. https://doi.org/10.1080/14697688.2012.755266
Su, C. W., Wang, X. Q., Zhu, H., Tao, R., Moldovan, N. C., & Lobonţ, O. R. (2020). Testing for multiple bubbles in the copper price: Periodically collapsing behavior. Resources Policy, 65. https://doi.org/10.1016/j.resourpol.2020.101587
Tsatsaronis, K., & Zhu, H. (2004). What drives housing price dynamics: cross-country evidence. BIS Quarterly Review, March. https://ssrn.com/abstract=1968425
Vasilopoulos, K., Pavlidis, E., & Martínez-García, E. (2020). Exuber: Recursive righttailed unit root testing with R. Federal Reserve Bank of Dallas, Globalization Institute working papers, 2020(383). https://doi.org/10.24149/gwp383r1
Vasilopoulos, K., Pavlidis, E., & Martínez-García, E. (2022). Exuber: Recursive Right-Tailed Unit Root Testing with R. Journal of Statistical Software, 103, 1-26. https://doi.org/10.18637/jss.v103.i10
Vogiazas, S., & Alexiou, C. (2017). Determinants of housing prices and bubble detection: Evidence from seven advanced economies. Atlantic Economic Journal, 45(1), 119-131. https://doi.org/10.1007/s11293-017-9531-0
White, E. N. (1990). The stock market boom and crash of 1929 revisited. Journal of Economic perspectives, 4(2), 67-83.
Xu, X., & Zhang, Y. (2023). Network Analysis of Housing Price Comovements of A Hundred Chinese Cities. National Institute Economic Review, 264, 110–128. https://doi.org/10.1017/nie.2021.34
Yıldırım, M. O., & İvrendi, M. (2021). Turkish Housing Market Dynamics: An Estimated DSGE Model. Margin: The Journal of Applied Economic Research, 15(2), 238–267. https://doi.org/10.1177/0973801021990396
Zavisca, J. R., & Gerber, T. P. (2016). The Socioeconomic, Demographic, and Political Effects of Housing in Comparative Perspective. Annual Review of Sociology, 42(Volume 42, 2016), 347–367. https://doi.org/10.1146/ANNUREV-SOC-081715-074333