Ekonomika ISSN 1392-1258 eISSN 2424-6166
2025, vol. 104(3), pp. 84–102 DOI: https://doi.org/10.15388/Ekon.2025.104.3.5
Ali Çelik*
Institute of Social Sciences, Department of Econometrics, PhD Student, Istanbul University, Istanbul, Turkey
Email: alicelik6209@gmail.com
ORCID: https://orcid.org/0000-0003-3794-7786 .
Burak Güriş
Faculty of Economics, Department of Econometrics, Prof. Dr., Istanbul University, Istanbul, Turkey
Email: bguris@istanbul.edu.tr
ORCID: https://orcid.org/0000-0003-0562-4130 .
Abstract. It is clear that the climate crisis is having a profound impact on the entire ecosystem. In order to prevent it, it is essential to first identify and address its causes. This study investigates the effects of Gross Domestic Product (GDP), population, primary energy consumption and economic globalization on the Load Capacity Factor (LCF) in Türkiye over the period from 1965 to 2022 by using the Wavelet Coherence (WCO), Quantile on Quantile Regression (QQR) and Augmented Autoregressive Distributed Lag (AARDL) methods. The results of WCO showed a negative correlation between LCF and GDP, as well as primary energy consumption while a positive correlation was detected between LCF, population, and trade globalization. Moreover, QQR results indicate that GDP has a positive impact on LCF at the upper quantiles, while GDP leads to a decrease in LCF at the lower quantiles. Moreover, population and primary energy consumption have a negative impact at different quantiles, while trade globalization has a negative and positive impact on LCF at different quantiles. The AARDL test results prove that an increase in GDP worsens LCF in the long run. It has also been found that population growth increases LCF, while primary energy consumption decreases LCF in the short run. These findings highlight the complex interactions influencing LCF and underscore the need for targeted policies. Therefore, these findings are important for the roadmap that policy makers could follow in terms of the climate policy.
Keywords: load capacity factor, nonlinear approaches, wavelet coherence, quantile on quantile, AARDL.
___________
* Correspondent author.
Received: 02/01/2025. Revised: 26/05/2025. Accepted: 26/05/2025
Copyright © 2025 Ali Çelik, Burak Güriş. Published by Vilnius University Press. This is an Open Access article distributed under the terms of the Creative Commons Attribution License, which permits unrestricted use, distribution, and reproduction in any medium, provided the original author and source are credited.
Climate change and global warming is the greatest negative externality created by the economic system that is threatening the world today. Yet, we may wonder whether enough is being done about such a big problem. How close have we come to the goals set by the climate summits organized under the auspices of the United Nations (UN)? To what extent have governments and companies been able to change their understanding of production? Have radical changes in energy transitions been achieved? These questions, which remain serious, are still awaiting answers.
In this context, numerous studies have been conducted to analyze the potential factors affecting climate change and global warming. One of the most interesting of these is the perspective of degrowth. The economic degrowth approach has been put forward as a solution to the fact that profit-oriented production in capitalist economies causes high fossil fuel consumption and therefore increases environmental degradation (Latouche, 2007). Hence, in order to prevent environmental degradation, it is necessary to reduce or limit capitalist production. Another approach reveals that green industrial transformation, green technology innovation, and digital economy have been shown to increase economic growth while reducing PM2.5 emissions (Ding et al., 2021; Li et al., 2021). For instance, Fang (2023) reveals that green technology helps increase environmental sustainability for 32 provinces in China by using the generalized method of moments (GMM). Yuerong et al. (2024) states that green technological innovation has a potential to enhance environmental attitudes for BRICS by utilizing panel techniques for the period from 2000 to 2019. Moreover, energy productivity and urban pollution have a vital impact on environmental sustainability (Zhao et al., 2022; Bai et al., 2022). In this regard, Kirikaleli (2023) asserts that a rise in energy productivity leads to improving the quality of environmental action in Japan by using novel time series analysis methods, while Safi et al. (2023) reveal that as energy productivity rises, environmental sustainability is enhanced for BRICS when employing panel econometric techniques. Furthermore, some studies have found that energy productivity, material productivity and the total factor productivity in particular slow down environmental degradation (Alola et al., 2023; Çelik et al., 2024). However, some studies indicate that environmental taxes can also prevent environmental degradation (Xu and Chen, 2022; Değirmenci and Aydın, 2023; Bala and Khatoon, 2024). Information and communication technology (ICT) and globalization also have a key role in an attempt to improve environmental sustainability (Iqbal et al., 2023; Saleem et al., 2023; Ximei et al., 2025). One of the issues that has been understudied compared to other aspects is the relationship between labor conditions and environmental degradation. There are a few studies that examine the relationship between labor standards and environmental sustainability (Anderson, 1998; Knight, 2013; Çelik and Alola, 2023). From another perspective, some studies investigating the decisive role of political factors on environmental degradation have also been identified (Dryzek, 1995; Downey and Strife, 2010; Stein, 2022). Additionally, several studies examining the impact of demographic factors on environmental degradation have also been conducted (Haouas et al., 2023).
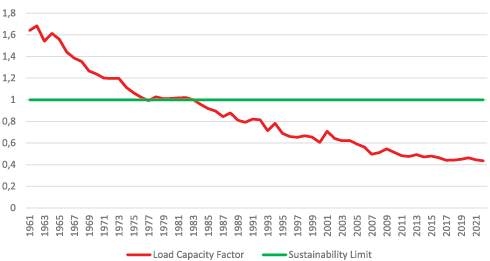
Within this framework, a whole range of indicators are widely adopted by countries to measure their ecological status or pollution levels. This study employs the Load Capacity Factor (LCF) as an environmental indicator. LCF can allow for a wide-ranging perspective on environmental quality by looking simultaneously at the supply and demand aspects of nature (Pata and Samour, 2022). Figure 1 demonstrates that LCF has fallen below its sustainable limit, especially with the increasing industrialization in Türkiye after the 1980s. This situation represents a risk for Türkiye and is of utmost importance in terms of the climate policy. For this reason, this study aims to unveil the effects of GDP, population growth, primary energy consumption, and trade globalization on LCF in Türkiye between 1965 and 2022 by using the WCO, quantile on quantile, and AARDL methods.
In addition, following the introduction, the study is structured as a Literature Review in section 2. Section 3 presents The Data and Methodology, while section 4 demonstrates Analysis Results and Discussion, and the final section features Conclusion and Policy Recommendation.
Among the factors that determine LCF, GDP can be stated to be the most commonly used variable. Therefore, Pata and Samour (2022) found that an increase in nuclear energy consumption can improve the environmental quality, while GDP leads to damage on LCF. Xu et al. (2022) prove that GDP, renewable and non-renewable energy consumption have a negative impact on LCF, but financial globalization was found to have a positive impact on LCF for Brazil. Furthermore, Güloğlu et al. (2023) assessed 16 OECD countries in the context of LCF over the period of 1980–2018 by applying the quantile common correlated effects mean group estimator. Human capital, resource rent, and renewable energy were found to improve environmental quality. Thus, it can be said that many studies have been found for different countries and methods that GDP is estimated to reduce LCF while GDP squares is observed to raise LCF. In this regard, several similar results are observed in academic studies, such as Yang et al. (2023) for BRICS countries which employed the method of moments quantile regression (MMQR); Çağlar et al. (2023) investigated 14 APEC economies by using the panel econometric method, whereas, Shang et al. (2022) researched ASEAN by employing the Cross-Section Augmented Autoregressive Distributed Lag (CS-ARDL) and Augmented Mean Group (AMG) estimators. Also, Raihan et al. (2023) explored Mexico by using fully modified least squares (FMOLS), the dynamic ordinary least squares (DOLS), and canonical cointegrating regression (CCR) estimators, while Bekun et al. (2024) focused on Türkiye by using the ARDL estimator, and Raihan et al. (2024) processed data on Poland by utilizing ARDL, DOLS, FMOLS and CCR estimators. After reviewing the relevant literature, the first hypothesis of this study is as follows.
H1: GDP has a negative impact on LCF.
When examining the factors affecting environmental sustainability, it can be stated that the most important demographic factor is the population variable. Therefore, studies examining the impact of population on environmental sustainability with respect to LCF have been assessed. In this regard, Dai et al. (2024) explored the impact of variables such as green energy, human capital, economic globalization, and population on environmental quality for ASEAN countries in the context of LCF by applying the CS-ARDL approach. Short- and long-term estimates have revealed that population density is detrimental to environmental quality. A similar result was obtained by Khan et al. (2024) by applying the CS-ARDL method for the top ten oil supplier countries. Interestingly, this study reveals that population (specifically, population density) increases LCF. Meanwhile, Jin et al. (2024) concluded that, among other variables, an increase in population density improves LCF. Değirmenci et al. (2024) emphasized that the urban population growth in China worsens LCF, while the urban population growth in Brazil improves LCF, which is a different finding from the country-specific AMG estimation results. Hasan et al. (2024) received a similar result for urban population by applying a novel PMG-ARDL approach in BRICS. In summary, an expanding urban population density contributes to a decline in LCF and threatens environmental sustainability. However, this paper focuses on whether or to what extent population has an impact on LCF. In this context, Dam et al. (2024) reached a different result for OECD countries by using the PMG-ARDL method. It was argued that population growth improves LCF in the long run, but has a negative impact on LCF in the short run. After reviewing the relevant literature, the second hypothesis of this study is outlined as follows.
H2: Population has a negative impact on LCF.
This study aims to measure the LCF effect of primary energy consumption. However, studies investigating the impact of different types of energy on LCF are presented in this subheading. Shang et al. (2022) adopted the CS-ARDL and AMG approaches for ASEAN countries and found that the consumption of renewable energy increased LCF, and, in parallel with this result, health expenditure also increased LCF. However, it was concluded that an increase in GDP decreased LCF. Hakkak et al. (2023) examined the EKC and LCC (load capacity curve) hypotheses together for Russia and measured the effectiveness of nuclear energy and renewable energy. The ARDL test result proved that renewable energy consumption positively affects LCF in the short as well as in the long term, whereas nuclear energy consumption improves LCF. Özcan et al. (2023) also found that nuclear energy consumption has a positive impact on LCF, while hydroelectric energy consumption was detected to threaten LCF. Akhayere et al. (2023) investigated the impact of energy consumption and trade openness on LCF by applying cointegration and causality analysis based on quantiles in Türkiye over the period of 1965–2018. After establishing cointegration relationships between the variables, the test results indicate that trade openness, primary energy consumption and financial development reduce LCF. In short, it has been found that the factors in question undermine the environmental quality in Türkiye. After reviewing the relevant literature, the third hypothesis of this study is worded as follows.
H3: Primary energy consumption has a negative impact on LCF.
Globalization, which is an eminent concept, especially after 1980, has various types. In this study, the effect of trade globalization is examined in LCF. Therefore, the focus is on the relevant literature. Generally, the measurement of trade globalization is in the form of trade globalization index and trade openness. In this regard, Abdulmagid et al. (2022) investigated the impact of trade globalization, GDP, renewable energy consumption, non-renewable energy consumption, and structural change on LCF by applying the cointegration and causality analysis based on quantiles in South Korea during the period of 1970–2018. The results demonstrate that all independent variables have an adverse impact on LCF. Awosusi et al. (2023) applied the dynamic ARDL (DARDL) method over the period of 1980–2017 for Japan. The empirical analysis demonstrated that trade globalization and renewable energy consumption positively affected LCF, while economic complexity, financial development, and GDP negatively affected LCF. Huilan et al. (2022) conducted a similar study focusing on Mexico for the period of 1970–2017. It was established that trade globalization contributed to the rise of LCF. At the same time, Kartal and Pata (2023) conducted a study using quantile-based analysis methods for China and observed that trade globalization boosted LCF. After reviewing the relevant literature, the fourth hypothesis of this study is defined as follows.
H4: Trade globalization has a negative impact on LCF.
This study investigates the impact of GDP, population growth, energy consumption and trade globalization on environmental sustainability in Türkiye between 1965 and 2022 in the context of the LCF hypothesis. Therefore, the biocapacity and ecological footprint per capita data required for the calculation of LCF (Y) (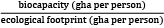 ) were compiled from the website (https://data.footprintnetwork.org/ ); additionally, GDP (constant 2015 US$) (X1) and population (total) (X2) data were collected from the World Bank website (https://data.worldbank.org/ ), while primary energy consumption (terawatt-hours) (X3) and trade globalization (share of exports and imports in GDP) (X4) data were collected from the website (https://ourworldindata.org/). The descriptive statistics results of the variables are summarized in Table 1.
|
|
Y |
X1 |
X2 |
X3 |
X4 |
|
Mean |
0.804059 |
3.22E+11 |
57655241 |
777.7818 |
33.41272 |
|
Median |
0.748422 |
1.64E+11 |
57803127 |
644.8647 |
30.39671 |
|
Maximum |
1.559312 |
9.58E+11 |
84979913 |
1972.118 |
81.17 |
|
Minimum |
0.435431 |
1.20E+10 |
31374536 |
91.43334 |
8.095723 |
|
Std. Dev. |
0.300264 |
3.31E+11 |
16149268 |
561.9979 |
19.09626 |
|
Skewness |
0.587886 |
0.773283 |
0.027655 |
0.650307 |
0.288468 |
|
Kurtosis |
2.384255 |
1.920138 |
1.767398 |
2.251199 |
2.072984 |
|
Jarque-Bera |
4.257154 |
8.598427 |
3.679055 |
5.443063 |
2.881183 |
|
Probability |
0.119007 |
0.013579 |
0.158892 |
0.065774 |
0.236788 |
|
Observations |
58 |
58 |
58 |
58 |
58 |
On the grounds of empirically exploring the role of economic growth, population, primary energy consumption, and trade globalization on Türkiye’s LCF, this paper relies on the model specifications employed in Pata and Lorente et al. (2022), Akhayere et al. (2023), Altıntaş et al. (2023), and Bekun et al. (2024). Hence, the model specification for this analysis is as follows:
lnYt = α0 + α1 lnX1t + α2 lnX2t + α3 lnX3t + α4 lnX4t + εt (1)
where ln represents the natural logarithm, Y stands for LCF, while X1 refers to GDP (as a proxy for economic growth), X2 denotes population, X3 captures the primary energy consumption, and X4 is trade globalization. The constant term is depicted by α0, the slope coefficients are portrayed by α1 to α4, and the error term is described by εt.
In time series analysis, in order to avoid the problem of spurious regression, unit root tests are performed to ascertain whether the series has a unit root. Many unit root tests have been developed for this purpose. In this study, first, Augmented Dickey Fuller (ADF) and Phillips Perron (PP) unit root tests were utilized, which are traditional unit root tests that do not consider the structural break and nonlinear structure. Then, the Sollis (2006) and Kruse (2011) unit root tests, which are non-linear unit root tests, were applied. Finally, the Fourier Kruse (2019) unit root test, which takes into account the structural break and nonlinear structure, was used. In the continuation of the empirical analysis, the WCO test, which examines the time and frequency dependent relationship between two time series, was used. Then, quantile-on-quantile regression analysis was applied to analyze the effect of the independent variable on certain quantiles and the dependent variable on certain quantile values. At last, the AARDL model was used to determine the short-run and long-run effects of the series at different levels of stationarity.
Table 2 illustrates ADF and PP unit root test findings, the conventional unit root test without structural breaks and linear values. The results of the ADF and PP unit root tests indicate that the primary energy consumption and population variables are stationary at the level, while the LCF, GDP and trade globalization variables are stationary in the I(1) case.
|
|
ADF |
PP |
||||||
|
Level |
∆ |
Level |
∆ |
|||||
|
Variable |
t-Statistic |
Prob. |
t-Statistic |
Prob. |
t-Statistic |
Prob. |
t-Statistic |
Prob. |
|
lnY |
-1.30 |
0.62 |
-7.70*** |
0.00 |
-0.45 |
0.89 |
-5.76*** |
0.00 |
|
lnX1 |
-1.58 |
0.48 |
-7.11*** |
0.00 |
-1.57 |
0.48 |
-7.13*** |
0.00 |
|
lnX2 |
-3.37** |
0.01 |
- |
- |
-13.36*** |
0.00 |
- |
- |
|
lnX3 |
-3.27* |
0.02 |
- |
- |
-3.78* |
0.00 |
- |
- |
|
lnX4 |
-0.35 |
0.90 |
-5.82*** |
0.00 |
-0.45 |
0.94 |
-5.76*** |
0.00 |
Having assessed the conventional unit root tests results, the research focuses on the nonlinear unit root test results. For nonlinear unit root tests, the first step is to analyze whether there is a non-linear structure in the series. For this purpose, the BDS linearity test was applied, and the test findings are reported in Table 3. The findings of the BDS test prove that the null hypothesis can be rejected for all variables. In short, the existence of a non-linear structure has been revealed for all variables.
|
Variable |
Dimension |
BDS Statistic |
Std. Error |
z-Statistic |
Prob. |
|
lnY |
2 |
0.18*** |
0.00 |
33.43 |
0.00 |
|
10 |
0.61*** |
0.00 |
93.94 |
0.00 |
|
|
lnX1 |
2 |
0.19*** |
0.00 |
33.91 |
0.00 |
|
10 |
0.60*** |
0.00 |
92.67 |
0.00 |
|
|
lnX2 |
2 |
0.18*** |
0.00 |
26.06 |
0.00 |
|
10 |
0.53*** |
0.00 |
63.98 |
0.00 |
|
|
lnX3 |
2 |
0.20*** |
0.00 |
32.28 |
0.00 |
|
6 |
0.67*** |
0.00 |
90.17 |
0.00 |
|
|
lnX4 |
2 |
0.18*** |
0.00 |
26.06 |
0.00 |
|
6 |
0.53*** |
0.00 |
63.98 |
0.00 |
After evidencing the existence of a nonlinear structure for the variables, the results of the Sollis (2009) and Kruse (2011) nonlinear unit root tests are reported in Table 4. Sollis (2009) and Kruse (2011) nonlinear unit root tests results indicate that LCF and trade globalization variables are stationary at the level for Case 3. In addition, the GDP, population and primary energy consumption variables have been found to be stationary at the level for Case 1, but the related variables are stationary after first differences for Case 2 and Case 3.
|
Variables |
Case |
Sollis (2009) |
Kruse (2011) |
Sollis (2009) |
Kruse (2011) |
|
At Level |
At first difference |
||||
|
lnY |
Case 1 |
0.28 [0] |
11.60 [1]** |
6.84 [2]*** |
- |
|
Case 2 |
2.62 [1] |
8.05 [1] |
8.67 [2]*** |
11.94[2]** |
|
|
Case 3 |
6.81 [1]** |
13.95 [0]** |
- |
- |
|
|
lnX1 |
Case 1 |
8.69 [0]*** |
17.33 [0]*** |
- |
- |
|
Case 2 |
2.43 [0] |
7.96 [0] |
31.07 [0]*** |
57.03 [0]*** |
|
|
Case 3 |
3.02 [0] |
5.04 [0] |
28.79 [0] *** |
53.57 [0]*** |
|
|
lnX2 |
Case 1 |
6.27 [1]** |
12.39 [1]** |
- |
- |
|
Case 2 |
0.13 [1] |
0.22 [1] |
4.36 [0]* |
6.77 [0] |
|
|
Case 3 |
0.51 [1] |
3.20 [1] |
21.78 [1]*** |
40.88 [1]*** |
|
|
lnX3 |
Case 1 |
35.51 [0]*** |
78.89 [1]*** |
- |
- |
|
Case 2 |
2.02 [2] |
6.27 [2] |
3.86 [1] |
7.71 [1] |
|
|
Case 3 |
4.99 [0] |
9.32 [0] |
4.65 [0] |
7.29 [1] |
|
|
lnX4 |
Case 1 |
1.22 [1] |
2.71 [1] |
12.46 [0]** |
8.11 [0]* |
|
Case 2 |
3.35 [1] |
3.59 [1] |
14.47 [0]*** |
15.09 [0]*** |
|
|
Case 3 |
10.53 [1]*** |
23.68 [1]*** |
- |
14.76 [0]** |
|
Following the previous unit root tests, the results of the Guris (2019) nonlinear unit root test with smooth structural breaks are reported in Table 5. Guris (2019) unit root test results indicate that the LCF variable is stationary in the level and trend, while the trade globalization variable is stationary in trend.
|
Variable |
Level |
Trend |
||||||
|
taustat |
F_j |
optimallag |
k |
taustat |
F_j |
optimallag |
k |
|
|
lnY |
18.96** |
44.12 |
0 |
1 |
26.94*** |
7.69 |
0 |
3 |
|
lnX1 |
7.24 |
44.22 |
1 |
1 |
11.31 |
12.49 |
0 |
2 |
|
lnX2 |
0.36 |
42.96 |
1 |
1 |
9.34 |
757.20 |
0 |
1 |
|
lnX3 |
4.35 |
36.17 |
1 |
1 |
8.99 |
74.76 |
0 |
1 |
|
lnX4 |
5.40 |
54.39 |
1 |
1 |
21.12* |
15.59 |
1 |
1 |
In the next phase of the analysis, wavelet analysis, a time- and frequency-based technique, was applied. Figure 1 (a) illustrates the coherence between LCF and GDP. It can be observed that the relationship between LCF and GDP is quite strong at a high frequency (8–16 frequency bands) and over a period of almost 50 years. Accordingly, it can be stated that a negative correlation has been found between LCF and GDP. However, it can be claimed that it is not a completely clear relationship between variables for causality. In spite of this condition, it can be stated that a unidirectional causality link was detected from LCF to GDP, especially for the early years, while a unidirectional causality link was relatively found from GDP to LCF for the most recent years. Figure 1 (b) illustrates the coherence between LCF and population. It can be indicated that the link between LCF and population is strong at a high frequency and over a period of almost 50 years. In this context, it is concluded that there is a positive correlation between LCF and population. In addition, while a unidirectional causal relationship from population to LCF was detected until the 2000s, a unidirectional causal relationship from LCF to population was relatively detected in the following years. Figure 1 (c) illustrates the coherence between LCF and energy consumption. Accordingly, there is a strong negative correlation between LCF and energy consumption. However, causality relationships between relevant variables could not obviously be detected. In addition, Figure 1 (d) illustrates coherence between LCF and trade globalization. In this framework, it can be indicated that LCF has a positive correlation with trade globalization, and that a unidirectional causality relationship from trade globalization to LCF was detected.

a) LCF and GDP b) LCF and Population
c) LCF and Energy Consumption d) LCF and Trade Globalization
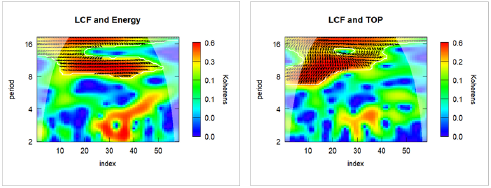
Having examined the relationships between variables by using the wavelet approach, Figures 1 and 2 provide the results of QQR with heatmaps. First, Figure 2 (a) illustrates the QQR results between GDP and LCF. Accordingly, the test results suggest that GDP has a positive impact on LCF at the upper quantiles, while GDP leads to a decrease in LCF at the lower quantiles. In addition, Figure 2 (b) presents the QQR results between LCF and population. The test results indicate that a negative relationship has been found between population and LCF. In other words, as expected, population has a negative effect on LCF. Figure 2 (c) illustrates the QQR results between energy consumption and LCF. A negative association between energy consumption and LCF has been found. In short, it has been determined that energy consumption has an adverse impact on LCF. Figure 2 (d) also illustrates the QQR results between LCF and trade globalization. The test results reveal that trade globalization has a negative impact on LCF in general. This finding can be interpreted as a result of an increase in production and trade activities that cause pollution with trade globalization. However, trade globalization has a slightly positive impact on LCF in the lower quantiles. In fact, this result is not consistent with our expected results. As trade globalization accelerates, LCF may increase if export and product diversity, compatible with natural balance, rises.
Following the preliminary tests, the fact that the unit root test results are compatible with the mixed integration structure has shown that the augmented ARDL cointegration test is a suitable method for determining the short-run and long-run coefficients. In this direction, the results of the F-Bounds test, the t-Bounds test and the exogenous F-Bounds test are presented in order to test the validity of the model. The ARDL bounds test results in Table 6 reveal that the test statistics of F bounds, t-bounds, and exogenous F-bounds tests are greater than the critical values of the respective tests at the 5% significant level. This result indicates that the null hypothesis can be rejected for all three tests. All in all, it can be said that there is a long-run cointegration relationship between the variables.
|
Test statistics |
Value |
k |
H0 |
H1 |
Decision |
||||
|
Overall F-Bounds Test |
4.12 |
4 |
No levels relationship |
Levels relationship exists |
Long-run cointegration |
||||
|
t-Bounds Test |
-3.85 |
No levels relationship |
Levels relationship exists |
||||||
|
Exogenous F-Bounds Test |
-5.63 |
4 |
No exo. levels relationship |
Exo. levels relationship exists |
|||||
|
Significance level |
F-statistics |
t-statistics |
Exo. F-statistics |
||||||
|
I(0) |
I(1) |
I(0) |
I(1) |
I(0) |
I(1) |
||||
|
10% |
2.45 |
3.52 |
-1.62 |
-3.49 |
1.96 |
3.58 |
|||
|
5% |
2.86 |
4.01 |
-1.95 |
-3.83 |
2.39 |
4.18 |
|||
|
2.5% |
3.25 |
4.49 |
-2.24 |
-4.12 |
2.79 |
4.73 |
|||
|
1% |
3.74 |
5.06 |
-2.58 |
-4.44 |
3.33 |
5.47 |
|
||
Now that the long-term relationship has been determined, short-run and long-run coefficient estimates can be made; they are reported in Table7. Therefore, a 1% increase in lnGDP reduces lnLCF by 0.166% in the long-run, ceteris paribus. It is observed that the studies of Yang et al. (2023), Çağlar et al. (2023), Shang et al. (2022), Raihan et al. (2023), Bekun et al. (2024), Raihan et al. (2024) have obtained similar findings. In particular, as it has been determined in most of the studies, it is concluded that dirty growth has a significant negative impact on LCF. The short-run analysis result revealed that lagged values of LCF decrease LCF, ceteris paribus. It is also concluded that a 1% increase in lnGDP reduces lnLCF by 0.06, while a 1% increase in a lagged lnGDP is associated with a 0.10% increase in lnLCF, ceteris paribus. Another finding demonstrates that a 1% increase in population raises LCF by 8.459%, ceteris paribus. Indeed, this finding is confirmed by Khan et al. (2024). It can be argued that population growth may only increase LCF as a result of carbon-neutral economic development. Moreover, if there is a climate-conscious population, this situation may have a positive impact on LCF in the short term. However, the analysis findings revealed that the population has a negative impact on LCF in the long term, even if it is not as statistically significant as expected. Finally, it is observed that a 1% increase in energy consumption in the short term reduces LCF by 0.469%. It is also revealed that a 1% increase in energy consumption with lag 1 reduces LCF by 0.346%, whereas a 1% increase in energy consumption with lag 2 reduces LCF by 0.438%, and a 1% increase in energy consumption with lag 3 reduces the LCF by 0.371%. Also, it is indicated that these results are in line with Akhayere et al. (2023).
|
|
∆lnLCF |
Coefficient |
Std. Error |
t-Statistic |
Prob. |
|
Long-Run |
|||||
|
lnX1 |
-0.16** |
0.05 |
-3.26 |
0.00 |
|
|
lnX2 |
-0.38 |
0.76 |
-0.50 |
0.61 |
|
|
lnX3 |
0.05 |
0.21 |
0.25 |
0.79 |
|
|
lnX4 |
-0.06 |
0.08 |
-0.78 |
0.43 |
|
|
Short-Run |
|||||
|
ECT |
-0.53*** |
0.10 |
-5.14 |
0.00 |
|
|
∆lnYt-1 |
-0.27** |
0.12 |
-2.17 |
0.03 |
|
|
∆lnYt-2 |
-0.40*** |
0.11 |
-3.42 |
0.00 |
|
|
∆lnYt-3 |
-0.22** |
0.10 |
-2.13 |
0.03 |
|
|
∆lnX1 |
-0.06* |
0.03 |
-1.95 |
0.05 |
|
|
∆lnX1t-1 |
0.10*** |
0.03 |
2.77 |
0.00 |
|
|
∆lnX2 |
8.45*** |
1.62 |
5.22 |
0.00 |
|
|
∆lnX3 |
-0.46*** |
0.10 |
-4.68 |
0.00 |
|
|
∆lnX3t-1 |
-0.34*** |
0.12 |
-2.89 |
0.00 |
|
|
∆lnX3t-2 |
-0.43*** |
0.12 |
-3.49 |
0.00 |
|
|
∆lnX3t-3 |
-0.37*** |
0.11 |
-3.30 |
0.00 |
|
|
ARDL |
(4, 4, 2, 1, 0) |
||||
|
R2 0.99 Adj. R2 0.99 |
|||||
Table 8 illustrates the results of the diagnostic statistical tests. Therefore, the Breusch-Godfrey LM test reveals that there is no serial correlation in the residuals; in other words, the autocorrelation problem cannot be detected in the estimated model. The results of White’s test for heteroskedasticity in Table 8 display that the residuals maintain homoskedasticity. The results of the Jarque-Bera normality test for skewness and kurtosis show that there is no significant skewness or kurtosis in the residuals, thereby indicating that the residuals have a normal distribution. Furthermore, the results of the Ramsey Reset test indicate that there is no model specification error. Finally, the CUSUM and CUSUM of Squares plot of the OLS residuals in Figure 4 illustrates that the specified model has a stability property.
|
Test |
Chi-square statistic |
p-value |
Decision |
|
χ2 Breusch Godfrey LM: |
9.44 |
0.05 |
No serial correlation |
|
χ2 Breusch Pagan Godfrey: |
19.00 |
0.39 |
No heteroskedasticity |
|
χ2 Jarque Bera Normality: |
2.44 |
0.29 |
Normally distributed |
|
χ2 Ramsey Reset: |
1.32 |
0.19 |
No model specification error |
|
Cusum |
Stable |
||
|
CusumSQ |
Stable |

This study examines the determinants of LCF in Türkiye over the period between 1965 and 2022 by applying the WCO, QQR, and AARDL methods. Within this framework, WCO test results demonstrate that a negative correlation has been found between LCF and GDP, while a positive correlation has been detected between LCF and population. A negative correlation has also been found between the LCF and energy consumption, while a positive correlation has been established between LCF and trade globalization. However, the QQR results reveal that population has a negative impact on LCF at the lower quantiles, whereas LCF has a positive impact on population at all quantiles. Primary energy consumption is shown to have a negative impact on LCF at the lower quantiles, while LCF has a positive impact on primary energy consumption at the upper quantiles. Although trade globalization has a negative impact on LCF, LCF has a positive impact on trade globalization.
Finally, the AARDL test results prove that an increase in GDP worsens LCF in the long run. As a rather interesting short-term result, it has been observed that population growth increases LCF, while primary energy consumption decreases LCF. However, there exists no statistically significant result between trade globalization and LCF. In general, the results obtained showed that the second hypothesis has been rejected, whereas the three other hypotheses have been confirmed.
According to scientific data, Türkiye is well below the sustainability threshold in terms of LCF. In this respect, an urgent action plan and some structural changes are needed to ensure environmental sustainability and achieve the zero emissions target. This requires the decarbonization of industry, ensuring energy transitions, increasing the role of environmental technologies, activating environmental taxes to prevent pollution and creating a nature-friendly planned economic structure. Specifically, energy-related emissions account for the largest share of total greenhouse gas emissions in terms of CO2 equivalent, at 70 percent, followed by agricultural and industrial processes and product use, and the waste sector in 2023 (TUIK, 2025). In particular, the significant volume of energy-related emissions has created the need for stricter implementation of regulations in this sector. Finally, agriculture and industry have been identified as the sectors where measures should be strengthened. Steps to decarbonize these sectors are crucial for environmental sustainability.
The purpose of this study was to investigate the factors that affect the environmental sustainability of Türkiye, while focusing on the period from 1965 to 2022. In this context, one of the limitations of the study is the time period. A longer time period and the lack of current values limited the research. The dataset can be enlarged by adding the relevant values from another study. In addition, aggregated values were used to calculate pollution or sustainability for Türkiye. This could be another limitation of the study. Therefore, the scope of the study can be broadened by examining different sectors and sub-sectors. Finally, new variables can be added, or new models constructed to increase the depth of the research.
Abdulmagid Basheer Agila, T., Khalifa, W. M., Saint Akadiri, S., Adebayo, T. S., & Altuntaş, M. (2022). Determinants of load capacity factor in South Korea: does structural change matter?. Environmental Science and Pollution Research, 29(46), 69932-69948. https://doi.org/10.1007/s11356-022-20676-2
Akhayere, E., Kartal, M. T., Adebayo, T. S., & Kavaz, D. (2023). Role of energy consumption and trade openness towards environmental sustainability in Turkey. Environmental Science and Pollution Research, 30(8), 21156-21168. https://doi.org/10.1007/s11356-022-23639-9
Alola, A. A., Celik, A., Obekpa, H. O., Usman, O., & Echebiri, C. (2023). The making-or-breaking of material and resource efficiency in the Nordics. Cleaner and Responsible Consumption, 11, 100151. https://doi.org/10.1016/j.clrc.2023.100151
Altıntaş, N., Açıkgöz, F., & Yeniyurt, M. (2023). Investigating the LCC hypothesis in the middle East, North Africa, and Turkey (Menat): evidence from second-generation panel techniques. Environment, Development and Sustainability, 1-20. https://doi.org/10.1007/s10668-023-04216-7
Anderson, K. (1998). Environmental and labor standards: what role for the wto. The WTO as an international organization, 231, 245-52.
Awosusi, A. A., Adebayo, T. S., Kirikkaleli, D., Rjoub, H., & Altuntaş, M. (2024, August). Evaluating the determinants of load capacity factor in Japan: The impact of economic complexity and trade globalization. Natural resources forum (Vol. 48, No. 3, pp. 743-762). Oxford, UK: Blackwell Publishing Ltd. https://doi.org/10.1111/1477-8947.12334
Bai, F., Huang, Y., Shang, M., & Ahmad, M. (2022). Modeling the impact of digital economy on urban environmental pollution: Empirical evidence from 277 prefecture-level cities in China. Frontiers in Environmental Science, 10. https://doi.org/10.3389/fenvs.2022.991022.
Bala, H., & Khatoon, G. (2024). Effect of green taxation on renewable energy technologies: an analysis of commonwealth and non-commonwealth countries in Sub-Saharan Africa. Environmental Science and Pollution Research, 1-17. https://doi.org/10.1007/s11356-024-31879-0
Bekun, F. V., Yadav, A., Onwe, J. C., Fumey, M. P., & Ökmen, M. (2024). Assessment into the nexus between load capacity factor, population, government policy in form of environmental tax: accessing evidence from Turkey. International Journal of Energy Sector Management. https://doi.org/10.1108/IJESM-08-2024-0032
Broock, W. A., Scheinkman, J. A., Dechert, W. D., & LeBaron, B. (1996). A test for independence based on the correlation dimension. Econometric reviews, 15(3), 197-235. https://doi.org/10.1080/07474939608800353
Caglar, A. E., Pata, U. K., Ulug, M., & Zafar, M. W. (2023). Examining the impact of clean environmental regulations on load capacity factor to achieve sustainability: Evidence from APEC economies. Journal of Cleaner Production, 429, 139563. https://doi.org/10.1016/j.jclepro.2023.139563
Celik, A., & Alola, A. A. (2023). Examining the roles of labour standards, economic complexity, and globalization in the biocapacity deficiency of the ASEAN countries. International Journal of Sustainable Development & World Ecology, 30(5), 591-604. https://doi.org/10.1080/13504509.2023.2172475
Celik, A., Kostekci, A., & Alola, A. A. (2024). Carbon neutrality implication of material productivity, total factor productivity and renewable energy uptake in the Nordics. Ecological Indicators, 160, 111813. https://doi.org/10.1016/j.ecolind.2024.111813
Dai, J., Ahmed, Z., Alvarado, R., & Ahmad, M. (2024). Assessing the nexus between human capital, green energy, and load capacity factor: policymaking for achieving sustainable development goals. Gondwana Research, 129, 452-464. https://doi.org/10.1016/j.gr.2023.04.009
Dam, M. M., Durmaz, A., Bekun, F. V., & Tiwari, A. K. (2024). The role of green growth and institutional quality on environmental sustainability: A comparison of CO2 emissions, ecological footprint and inverted load capacity factor for OECD countries. Journal of Environmental Management, 365, 121551. https://doi.org/10.1016/j.jenvman.2024.121551
Degirmenci, T., & Aydin, M. (2023). The effects of environmental taxes on environmental pollution and unemployment: A panel co‐integration analysis on the validity of double dividend hypothesis for selected African countries. International Journal of Finance & Economics, 28(3), 2231-2238. https://doi.org/10.1002/ijfe.2505
Degirmenci, T., Erdem, A., & Aydin, M. (2024). The nexus of industrial employment, financial development, urbanization, and human capital in promoting environmental sustainability in E7 economies. International Journal of Sustainable Development & World Ecology, 1-17. https://doi.org/10.1080/13504509.2024.2426184
Dickey D. A., Fuller W. A. (1979). Distribution of the Estimators for Autoregressive Time 15 Series with a Unit Root. Journal of the American Statistical Association, 74(16), 427–431. https://doi.org/10.1080/01621459.1979.10482531
Ding, C., Liu, C., Chui-yong, Z., & Li, F. (2021). Digital economy, technological innovation and high-quality economic development: Based on spatial effect and mediation effect. Sustainability, 14(1), 216. https://doi.org/10.3390/su14010216
Downey, L., & Strife, S. (2010). Inequality, democracy, and the environment. Organization & Environment, 23(2), 155-188. https://doi.org/10.1177/1086026610368372
Dryzek, J. S. (1995). Democracy and environmental policy instruments. Markets, the state and the environment: Towards integration, 294-308.
Fang, Z. (2023). Assessing the impact of renewable energy investment, green technology innovation, and industrialization on sustainable development: A case study of China. Renewable Energy, 205, 772-782.
Guloglu, B., Caglar, A. E., & Pata, U. K. (2023). Analyzing the determinants of the load capacity factor in OECD countries: evidence from advanced quantile panel data methods. Gondwana Research, 118, 92-104. https://doi.org/10.1016/j.gr.2023.02.013
Güriş B. (2019). A new nonlinear unit root test with Fourier function. Communications in Statistics Simulation and Computation, 48(10), 3056–3062. https://doi.org/10.1080/03610918.2018.1473591
Hakkak, M., Altintaş, N., & Hakkak, S. (2023). Exploring the relationship between nuclear and renewable energy usage, ecological footprint, and load capacity factor: A study of the Russian Federation testing the EKC and LCC hypothesis. Renewable Energy Focus, 46, 356-366. https://doi.org/10.1016/j.ref.2023.07.005
Haouas, I., Haseeb, M., Azam, M., & Rehman, Z. U. (2023). Do demographic factors affect the environment? Empirical evidence from the Middle East and North African countries. Environmental Science and Pollution Research, 30(31), 77077-77095. https://doi.org/10.1007/s11356-023-27835-z
Hasan, M. A., Voumik, L. C., Mozumder, A. I., Esquivias, M. A., Verteramo-Chiu, L., & Das, M. K. (2025). Role of governance index, democracy, industrialization, and urbanization on environmental sustainability of BRICS countries: A novel PMG-ARDL approach. Social Sciences & Humanities Open, 11, 101242. https://doi.org/10.1016/j.ssaho.2024.101242
Huilan, W., Akadiri, S. S., Haouas, I., Awosusi, A. A., & Odu, A. T. (2024). Impact of trade liberalization and renewable energy on load capacity factor: Evidence from novel dual adjustment approach. Energy & Environment, 35(2), 795-814. https://doi.org/10.1177/0958305X221137559
Iqbal, K., Sarfraz, M., & Khurshid. (2023). Exploring the role of information communication technology, trade, and foreign direct investment to promote sustainable economic growth: Evidence from Belt and Road Initiative economies. Sustainable Development, 31(3), 1526-1535.
Jin, X., Ahmed, Z., Pata, U. K., Kartal, M. T., & Erdogan, S. (2024). Do investments in green energy, energy efficiency, and nuclear energy R&D improve the load capacity factor? An augmented ARDL approach. Geoscience Frontiers, 15(4), 101646. https://doi.org/10.1016/j.gsf.2023.101646
Kangallı Uyar, S. G. (2021). Uluslararası Döviz Piyasalarında Finansal Bulaşıcılık ve Karşılıklı Bağımlılık: Wavelet Uyum Analizi. Finans Politik ve Ekonomik Yorumlar Dergisi.
Kartal, M. T., & Pata, U. K. (2023). Impacts of renewable energy, trade globalization, and technological innovation on environmental development in China: Evidence from various environmental indicators and novel quantile methods. Environmental Development, 48, 100923. https://doi.org/10.1016/j.envdev.2023.100923
Khan, U., Khan, A. M., Khan, M. S., Ahmed, P., Haque, A., & Parvin, R. A. (2023). Are the impacts of renewable energy use on load capacity factors homogeneous for developed and developing nations? Evidence from the G7 and E7 nations. Environmental Science and Pollution Research, 30(9), 24629-24640. https://doi.org/10.1007/s11356-022-24002-8
Kirikkaleli, D. (2023). Resource efficiency, energy productivity, and environmental quality in Japan. Resources Policy, 85, 104006.
Knight, K. W., Rosa, E. A., & Schor, J. B. (2013). Could working less reduce pressures on the environment? A cross-national panel analysis of OECD countries, 1970–2007. Global Environmental Change, 23(4), 691-700. https://doi.org/10.1016/j.gloenvcha.2013.02.017
Kruse, R. (2011). A New Unit Root Test against ESTAR based on a Class of Modified Statistics. Statistical Papers, 52, 71–85. https://doi.org/10.1007/s00362-009-0204-1
Latouche Serge (2007). Degrowth: an electoral stake?, The International Journal of inclusive democracy, Vol. 3, No. 1 (January 2007).
Lee, D. T., & Yamamoto, A. (1994). Wavelet analysis: theory and applications. Hewlett Packard journal, 45, 44-44.
Li, Z., Li, N., Wen, H. (2021). Digital economy and environmental quality: Evidence from 217 cities in China. Sustainability, 13(14), 8058. https://doi.org/10.3390/su13148058
Ozcan, B., Depren, S. K., & Kartal, M. T. (2024). Impact of nuclear energy and hydro electricity consumption in achieving environmental quality: evidence from load capacity factor by quantile based non-linear approaches. Gondwana Research, 129, 412-424. https://doi.org/10.1016/j.gr.2023.05.014
Pal, D., ve Mitra, S.K. (2019). Oil price and automobile stock return co-movement: A wavelet coherence analysis. Economic Modelling 76:172-181. https://doi.org/10.1016/j.econmod.2018.07.028
Pata, U. K., & Balsalobre-Lorente, D. (2022). Exploring the impact of tourism and energy consumption on the load capacity factor in Turkey: a novel dynamic ARDL approach. Environmental Science and Pollution Research, 29(9), 13491-13503. https://doi.org/10.1007/s11356-021-16675-4
Pata, U. K., & Samour, A. (2022). Do renewable and nuclear energy enhance environmental quality in France? A new EKC approach with the load capacity factor. Progress in Nuclear Energy, 149, 104249. https://doi.org/10.1016/j.pnucene.2022.104249
Perron, P. (1989). The Great Crash, The Oil Price Shock, and The Unit Root Hypothesis. Econometrica, 57, 1361–1401.
Raihan, A., Rashid, M., Voumik, L. C., Akter, S., & Esquivias, M. A. (2023). The dynamic impacts of economic growth, financial globalization, fossil fuel, renewable energy, and urbanization on load capacity factor in Mexico. Sustainability, 15(18), 13462. https://doi.org/10.3390/su151813462
Raihan, A., Voumik, L. C., Zimon, G., Sadowska, B., Rashid, M., & Akter, S. (2024). Prioritising sustainability: how economic growth, energy use, forest area, and globalization impact on greenhouse gas emissions and load capacity in Poland?. International Journal of Sustainable Energy, 43(1), 2361410. https://doi.org/10.1080/14786451.2024.2361410
Safi, N., Rashid, M., Shakoor, U., Khurshid, N., Safi, A., & Munir, F. (2023). Understanding the role of energy productivity, eco-innovation and international trade in shaping consumption-based carbon emissions: a study of BRICS nations. Environmental Science and Pollution Research, 30(43), 98338-98350.
Saleem, H., Khan, M. B., & Mahdavian, S. M. (2023). The role of economic growth, information technologies, and globalization in achieving environmental quality: a novel framework for selected Asian countries. Environmental Science and Pollution Research, 30(14), 39907-39931.
Sam, C.Y., McNown, R., & Goh, S.K. (2019). An augmented autoregressive distributed lag bounds test for cointegration. Economic Modelling, 80, 130-141. https://doi.org/10.1016/j.econmod.2018.11.001
Shang, Y., Razzaq, A., Chupradit, S., An, N. B., & Abdul-Samad, Z. (2022). The role of renewable energy consumption and health expenditures in improving load capacity factor in ASEAN countries: exploring new paradigm using advance panel models. Renewable Energy, 191, 715-722. https://doi.org/10.1016/j.renene.2022.04.013
Sim, N., & Zhou, H. (2015). Oil prices, US stock return, and the dependence between their quantiles. Journal of Banking & Finance, 55, 1-8. https://doi.org/10.1016/j.jbankfin.2015.01.013
Sollis R. (2009). A Simple Unit Root Test against Asymmetric STAR Nonlinearity with an Application to Real Exchange Rates in Nordic Countries. Economic Modelling, 26(9), 118–125. https://doi.org/10.1016/j.econmod.2008.06.002
Stein, J. (2022). Democracy, autocracy, and everything in between: how domestic institutions affect environmental protection. British Journal of Political Science, 52(1), 339-357.
Torrence, C., & Compo, G. P. (1998). A practical guide to wavelet analysis. Bulletin of the American Meteorological society, 79(1), 61-78.
TUIK (2025). https://data.tuik.gov.tr/Bulten/Index?p=Sera-Gazi-Emisyon-Istatistikleri
Ximei, K., Javaid, M. Q., Shams, T., & Sibt‐e‐Ali, M. (2025). Information and communication technology, economic globalization, and environmental sustainability in APEC nations: Insights from LCC and EKC hypotheses testing. Sustainable Development, 33(1), 878-903.
Xu, D., Salem, S., Awosusi, A. A., Abdurakhmanova, G., Altuntaş, M., Oluwajana, D. & Ojekemi, O. (2022). Load capacity factor and financial globalization in Brazil: the role of renewable energy and urbanization. Frontiers in Environmental Science, 9, 823185. https://doi.org/10.3389/fenvs.2021.823185
Xu, Y., & Chen, P. (2022). Energy transition and regional heterogeneity of environmental taxation in China: From the perspective of emission reduction effects. Frontiers in Environmental Science, 10, 944131. https://doi.org/10.3389/fenvs.2022.944131
Yang, M., Magazzino, C., Awosusi, A. A., & Abdulloev, N. (2024). Determinants of load capacity factor in BRICS countries: A panel data analysis. Natural resources forum (Vol. 48, No. 2, pp. 525-548). Oxford, UK: Blackwell Publishing Ltd. https://doi.org/10.1111/1477-8947.12331
Yuerong, H., Javaid, M. Q., Ali, M. S. E., & Zada, M. (2024). Revisiting the nexus between digital trade, green technological innovation, and environmental sustainability in BRICS economies. Environmental Science and Pollution Research, 31(6), 8585-8607.
Zhao, S., Peng, D., Wen, H., Wu, Y. (2022). Nonlinear and spatial spillover effects of the digital economy on green total factor energy efficiency: Evidence from 281 cities in China. Environmental Science and Pollution Research, 30(34), 81896-81916. https://doi.org/10.1007/s11356-022-22694-6.