Ekonomika ISSN 1392-1258 eISSN 2424-6166
2026, vol. 105(1), pp. 75–91 DOI: https://doi.org/10.15388/Ekon.2026.105.1.5
Yossinomita Yossinomita*
Faculty of Management and Business Science, Universitas Dinamika Bangsa, Jambi, Indonesia
E-mail: yossinomita.saputra@gmail.com
ORCID: https://orcid.org/0000-0002-2190-8128
ROR ID: https://ror.org/04h9c4011
Rina Hartanti
Faculty of Economics and Business, Universitas Trisakti, Jakarta, Indonesia
E-mail: rinahartanti@trisakti.ac.id
ORCID: https://orcid.org/0009-0002-5828-3819
ROR ID: https://ror.org/019fnr381
Rista Zahra Saputri
Faculty of Economics and Business, Universitas Jambi, Jambi, Indonesia
E-mail: ristazahrasaputri@gmail.com
ORCID: https://orcid.org/0009-0007-9445-1783
ROR ID: https://ror.org/00g1w3j30
Abstract. This study analyzes tax reform and its determining factors affecting the tax ratio in Indonesia, Malaysia, India, and Singapore by using the Toda-Yamamoto causality approach. The findings reveal five significant causal relationships in Indonesia, including the impact of inflation (I) on the tax ratio (τ) at the 1% significance level (p = 0.0000), emphasizing the critical role of macroeconomic stability in optimizing tax revenue. In Malaysia, three significant causal relationships were identified, one of which is the effect of e-filing adoption (E) on the Corruption Perception Index (CPI) at a 10% significance level (p = 0.0670), suggesting that the digitalization of tax administration can enhance perceptions of governance and corruption. India exhibits five significant relationships, including the influence of the tax ratio (τ) on CPI at a 5% significance level (p = 0.0290), reinforcing the link between tax policy and public trust in government institutions. In Singapore, two significant relationships were found, one being the effect of CPI on internet penetration (IP) at a 5% significance level (p = 0.0553), highlighting the role of good governance in driving digital transformation. These findings underscore that tax reform is not solely influenced by fiscal policies but also by macroeconomic stability, governance effectiveness, and digitalization. Therefore, the integration of fiscal, regulatory, and technological strategies is crucial in developing a more efficient, equitable, and sustainable tax system. These dynamics have significant implications for tax ratio adjustments in each country, emphasizing the need for evidence-based policies to optimize tax revenue and strengthen economic resilience in the digital era.
Keywords: Tax reform, tax ratio, corruption perception index, internet penetration, inflation, e-filing, governance quality, Toda-Yamamoto causality.
_________
* Correspondent author.
Received: 20/12/2024. Accepted: 30/01/2026
Copyright © 2026 Yossinomita Yossinomita, Rina Hartanti, Rista Zahra Saputri. Published by Vilnius University Press
This is an Open Access article distributed under the terms of the Creative Commons Attribution License, which permits unrestricted use, distribution, and reproduction in any medium, provided the original author and source are credited.
Tax reform plays a pivotal role in shaping a country’s economic structure and revenue generation (Martinez-Vazquez, 2022). Kouam & Asongu (2022) emphasize that understanding the determinants of tax ratios is essential for formulating effective tax policies, particularly as nations strive for fiscal sustainability. A well-designed tax reform enhances efficiency, promotes compliance, and fosters economic growth, whereas a poorly structured one can lead to economic distortions and inefficiencies (Gale & Brown, 2013; Yossinomita et al., 2025). In this context, a comprehensive analysis of the key determinants of tax ratios provides valuable insights into the effectiveness of tax policies across different economies, aiding policymakers in designing more robust fiscal strategies.
Indonesia, Malaysia, India, and Singapore represent diverse economic structures and tax regimes, making them ideal for comparative analysis. While Indonesia and India have historically struggled with tax compliance and collection efficiency, Malaysia and Singapore have implemented advanced digital tax administration strategies. This variation in tax policies and governance mechanisms offers a unique opportunity to examine how different factors shape tax ratios in these countries.
Among the critical determinants of a country’s tax ratio, corruption perception, internet penetration, inflation, and e-filing policies play a pivotal role in shaping tax compliance and revenue generation (Ansong et al., 2024; Mohammed & Tangl, 2024; Rashid et al., 2022). Corruption perception directly influences taxpayer trust, as higher perceived corruption reduces voluntary tax payments and weakens institutional credibility (Bartha & Boda, 2024). Meanwhile, internet penetration facilitates digital tax administration by enhancing transparency, reducing compliance costs, and improving tax reporting efficiency (J. Li et al., 2020). Inflation, as a macroeconomic factor, affects real tax revenue by altering consumption and investment patterns, and ultimately influencing the tax base (Yossinomita, Haryadi, & Hodijah, 2024). Additionally, the adoption of e-filing policies streamlines tax collection, minimizes administrative burdens, and enhances enforcement capabilities. A comprehensive analysis of these variables is essential to understanding the complex interplay between tax reforms, governance quality, and economic performance.
Empirical data from Indonesia, Malaysia, India, and Singapore underscore significant disparities in key determinants of tax performance, highlighting their influence on tax revenue mobilization. In 2023, Singapore recorded the highest CPI score at 83, reflecting strong institutional integrity and high public trust in tax authorities. Malaysia followed with a score of 50, while India and Indonesia recorded lower scores of 39 and 34, respectively, suggesting higher perceived corruption levels that may hinder voluntary tax compliance1. Similarly, internet penetration rates emphasize the digital divide, with Malaysia achieving near-universal coverage at 98%, followed by Singapore at 94%. In contrast, Indonesia reported an internet penetration rate of 69%, and India stood at 56%, potentially limiting the effectiveness of digital tax administration2. Inflation rates also varied significantly across these economies, with India experiencing the highest inflation at 5.6%, followed by Singapore (4.8%), Indonesia (3.7%), and Malaysia (2.5%), affecting the real value of tax revenue3.
The adoption of e-filing systems occurred at different periods across various countries, shaping the modernization of tax administration and compliance mechanisms. Singapore was the earliest adopter, introducing e-filing for individual income tax returns in 1998 through the Inland Revenue Authority of Singapore (IRAS) (Teo & Wong, 2005). Indonesia implemented its e-filing system in 2005, later expanding it with the introduction of the e-Faktur system for electronic invoicing in 2014, which became fully effective in 2016 (Bassey et al., 2022; Lubis et al., 2022). Malaysia subsequently launched its e-filing system in 2006, enabling both Malaysian and non-Malaysian taxpayers to submit tax returns electronically (Santhanamery & Ramayah, 2015). Similarly, India launched e-filing for individual income tax returns in the same year and has since continuously expanded its scope and technological infrastructure to enhance tax compliance, reduce processing times, and modernize its tax administration (Matharu et al., 2017). The variations in the timing of e-filing adoption reflect differences in the digital infrastructure, regulatory frameworks, and policy priorities across these countries. These structural differences are reflected in each country’s tax-to-GDP ratio, where Malaysia reported the highest at 14.1%, followed by Singapore (13.5%), India (12.1%), and Indonesia (10.31%)4. The variation in tax performance across these nations underscores the significance of governance quality, technological infrastructure, and macroeconomic stability in shaping effective tax systems. Strengthening these factors is essential for optimizing revenue collection and ensuring sustainable economic growth.
To further explore the causal relationships between these variables and tax ratio outcomes, this study employs the Toda-Yamamoto causality approach, a robust econometric method that extends beyond conventional regression models. Unlike traditional methods that require strict stationarity conditions, this approach allows for the examination of long-term interactions without data differencing, thereby preserving the integrity of macroeconomic relationships (Jaber et al., 2022; M. M. Jaber et al., 2025). By leveraging this methodology, policymakers can quantify the extent to which improvements in governance, digitalization, and economic stability contribute to enhanced tax compliance and revenue mobilization. This evidence-based approach is instrumental in formulating targeted tax policies that strengthen institutional credibility, optimize administrative efficiency, and promote sustainable economic growth.
This study contributes to the literature by presenting empirical evidence on the determinants of tax ratios in Indonesia, Malaysia, India, and Singapore. While focused on four Asian countries, it uses a comparative framework to highlight policy implications and best practices that are transferable across different national contexts. By examining macroeconomic and institutional variables, such as inflation, governance perception, internet penetration, and e-filing adoption, the study identifies patterns with broader relevance beyond the regional scope. Understanding these dynamics is essential for countries aiming to strengthen tax policy and revenue mobilization in a digital era.
Tax reform is a vital tool for advancing economic stability and institutional development. This study provides actionable insights through a Toda-Yamamoto analysis of causal relationships between governance, technology, and tax outcomes. Although based on Asian data, the framework and findings are relevant for policymakers and researchers globally, including in developed regions such as Europe, who are seeking more efficient, transparent, and adaptive tax systems.
Tax reform is a fundamental policy instrument for enhancing revenue mobilization, reducing economic distortions, and improving taxpayer compliance (Dom et al., 2022; Gale & Brown, 2013). A key measure of its effectiveness is the tax ratio, the proportion of tax revenue to Gross Domestic Product (GDP), which reflects a country’s fiscal capacity and economic sustainability (Raouf, 2022; Yossinomita et al., 2025). Empirical studies indicate that comprehensive tax reforms – such as improved enforcement, simplified tax structures, and digitalized tax administration – correlate with higher tax ratios by increasing compliance and reducing revenue leakage (Dom et al., 2022; Martinez-Vazquez, 2022). However, institutional capacity, administrative efficiency, and economic conditions significantly influence reform outcomes.
In Southeast Asia, tax reform outcomes vary across countries due to differences in institutional frameworks and policy implementation (Kouam & Asongu, 2022). Singapore maintains a high tax-to-GDP ratio through streamlined policies and strong regulatory enforcement, while Indonesia and India face challenges related to administrative inefficiencies, a large informal economy, and low taxpayer compliance (Asian Development Bank, 2022; OECD, 2022). Despite Indonesia’s recent efforts to digitalize tax administration and expand the tax base, structural constraints such as weak inter-agency coordination and limited enforcement capacity persist (Badan Kebijakan Fiskal, 2022; Dom et al., 2022). Strengthening governance, enhancing transparency, and integrating technology-driven solutions is essential to ensuring that tax reforms lead to sustained improvements in revenue mobilization and long-term fiscal stability (Ansong et al., 2024).
A country’s tax ratio is influenced by various factors, including governance quality, digital infrastructure, and macroeconomic stability (Islam et al., 2020). Governance quality is often measured by using the CPI, where a higher CPI score indicates lower levels of perceived corruption and stronger tax compliance (Ojeka et al., 2019). Empirical studies suggest that countries with robust governance frameworks tend to exhibit higher tax ratios, as public trust in tax authorities fosters voluntary compliance (Dom et al., 2022; Musah et al., 2025). Furthermore, the effectiveness of law enforcement, transparency in tax policies, and institutional accountability play crucial roles in establishing a fair and efficient tax system.
In addition to governance, digitalization of tax administration significantly enhances tax collection efficiency. The implementation of e-filing systems has been shown to reduce administrative costs, improve taxpayer compliance, and minimize tax evasion (Bellon et al., 2022). Singapore pioneered e-filing in 1998, followed by Indonesia in 2005, and Malaysia and India in 2006. Countries with higher internet penetration and digital literacy tend to achieve greater e-filing adoption, increasing transparency and accuracy in tax reporting (Bassey et al., 2022; Hendricks & Mwapwele, 2024). Moreover, macroeconomic factors, such as inflation and economic growth, also influence tax revenue performance (Yossinomita, Haryadi, & Hodijah, 2024). High inflation can erode the real value of tax revenues, while strong economic growth expands the tax base and enhances a country’s fiscal capacity (Torregrosa-Hetland & Sabate, 2022). Therefore, a combination of effective governance, technological integration in tax administration, and stable economic policies is essential to improving tax ratios and ensuring long-term fiscal sustainability.
This study uses a quantitative approach with econometric methods to examine the impact of tax reforms on the tax ratio in Indonesia, Malaysia, India, and Singapore. A comparative framework assesses the role of economic variables and tax policies across countries. The Toda-Yamamoto Granger Causality model tests causality without differencing, preserving long-run structures and accommodating non-stationary data.
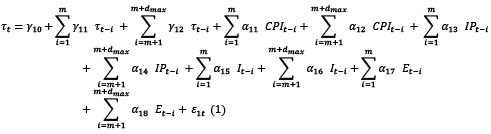
E-filing adoption varied: Singapore introduced it in 1998, Indonesia in 2005 (expanded in 2014), and Malaysia and India in 2006, with India improving automation over time. Secondary data from 1995–2023 are sourced from the World Bank, Transparency International, OECD, IMF, and national tax bodies. Key variables include the tax ratio (τ), Corruption Perception Index (CPI), internet penetration (IP), inflation (I), and e-filing (E, as a dummy). All are modeled as endogenous in a Vector Autoregression (VAR) framework to capture dynamic interrelations and causality.
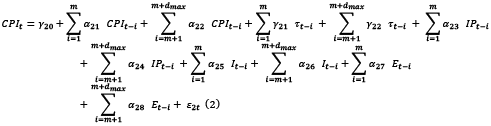
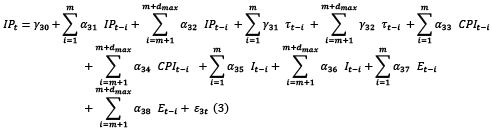

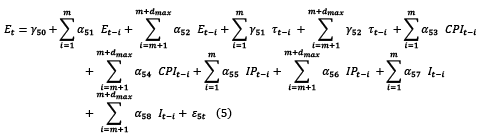
where γi and αi are the coefficients to be estimated, εt represents the unobserved determinant of the total output, and m and dmax denote the number of lags and the maximum degree of integration from the stationarity test, respectively, to identify the long-term relationship between the variables.
Before conducting the Granger Toda-Yamamoto causality analysis, the first step was to test the stationarity of the variables by using the Augmented Dickey-Fuller (ADF) and Phillips-Perron (PP) tests. As shown in Table 1, the results indicate that most economic variables in Indonesia, Malaysia, India, and Singapore were non-stationary at level but became stationary after first differencing (I(1)). However, there are exceptions, such as CPI in Malaysia and IP in Singapore, which were already stationary at level (I(0)). Additionally, IP in Indonesia and India required second differencing (I(2)), reflecting variations in integration levels across the variables.
|
Variable |
ADF test |
PP test |
Order of Integration |
||||
|
Level |
First difference |
Second difference |
Level |
First difference |
Second difference |
||
|
Indonesia: |
|||||||
|
τ |
-2.929291** |
-2.786629* |
-11.02985*** |
I(1) |
|||
|
(0.0546) |
(0.0730) |
(0.0000) |
|||||
|
CPI |
-3.778748*** |
-0.857785ns |
-5.948758*** |
I(1) |
|||
|
(0.0091) |
(0.7864) |
(0.0000) |
|||||
|
IP |
5.113867 ns |
-1.312617 ns |
-8.903903*** |
4.067079 ns |
-2.023031 ns |
-8.903903*** |
I(2) |
|
(1.0000) |
(0.6081) |
(0.0000) |
(1.0000) |
(0.2758) |
(0.0000) |
||
|
I |
-4.035649*** |
-4.044337*** |
I(0) |
||||
|
(0.0043) |
(0.0042) |
||||||
|
Malaysia: |
|||||||
|
τ |
-2.293665 ns |
-4.060268*** |
-2.408084 ns |
-3.787185*** |
I(1) |
||
|
(0.1808) |
(0.0042) |
(0.1487) |
(0.0081) |
||||
|
CPI |
-3.297297** |
-3.395650** |
I(0) |
||||
|
(0.0247) |
(0.0198) |
||||||
|
IP |
-0.989626 ns |
-4.688826*** |
-1.460993 ns |
-4.667092*** |
I(1) |
||
|
(0.7429) |
(0.0009) |
(0.5381) |
(0.0009) |
||||
|
I |
-4.676726*** |
-4.666094*** |
I(0) |
||||
|
(0.0009) |
(0.0009) |
||||||
|
India: |
|||||||
|
τ |
-1.268541 ns |
-5.029699*** |
-1.147320 ns |
-5.504941*** |
I(1) |
||
|
(0.6296) |
(0.0004) |
(0.6823) |
(0.0001) |
||||
|
CPI |
-0.727637 ns |
-6.647051*** |
-0.601096 ns |
-6.647051*** |
I(1) |
||
|
(0.8237) |
(0.0000) |
(0.8551) |
(0.0000) |
||||
|
IP |
3.559405 ns |
-2.788254* |
-3.541333*** |
4.263158 ns |
-2.730772* |
-7.353244*** |
I(2) |
|
(1.0000) |
(0.0732) |
(0.0175) |
(1.0000) |
(0.0820) |
(0.0000) |
||
|
I |
-2.733788* |
-7.001888*** |
-2.715645* |
-7.001888*** |
I(1) |
||
|
(0.0811) |
(0.0000) |
(0.0840) |
(0.0000) |
||||
|
Singapore: |
|||||||
|
τ |
-2.565101ns |
-4.868111*** |
-2.527906ns |
-4.869213*** |
I(1) |
||
|
(0.1119) |
(0.0006) |
(0.1199) |
(0.0006) |
||||
|
CPI |
-0.710357ns |
-4.665660*** |
-0.786317ns |
-4.665660*** |
I(1) |
||
|
(0.8282) |
(0.0010) |
(0.8076) |
(0.0010) |
||||
|
IP |
-3.084834** |
-4.067933*** |
I(0) |
||||
|
(0.0394) |
(0.0040) |
||||||
|
I |
-2.864186* |
-6.316592*** |
-2.910777** |
I(1) |
|||
|
(0.0624) |
(0.0000) |
(0.0568) |
|||||
Note. ***significant at 1% (0.01), ** significant at 5% (0.05), *significant at 10% (0.10), ‘ns’ not significant.
These differences in integration levels necessitate a causality testing method that accommodates non-stationary data without losing structural information. The Toda-Yamamoto causality test offers an optimal solution by incorporating additional lags corresponding to the maximum integration order (dmax), allowing for robust causality analysis regardless of the stationarity properties of the variables. This method effectively addresses the limitations of Engle-Granger and Granger-Sims tests, which require all variables to be integrated at the same level, thereby reducing the risk of spurious regression (R. Li et al., 2021).
The second stage in the Toda-Yamamoto causality analysis involves determining the optimal lag length (m) for the vector autoregression (VAR) model. The selection of an appropriate lag length is crucial to ensure model stability and prevent misspecification errors. As shown in Table 2, the Final Prediction Error (FPE) and Akaike Information Criterion (AIC) were used as the primary criteria for selecting m, as they provide reliable estimates for forecasting accuracy and model performance. The optimal lag lengths for each country, based on the lowest FPE and AIC values, are m = 2 for Indonesia, and m = 1 for Malaysia, India, and Singapore. These results indicate that most countries exhibit short-term dependencies among variables, except for Indonesia, where a longer lag structure is necessary to capture past dynamics adequately.
Selecting the appropriate lag length is essential in the Toda-Yamamoto method, as it ensures that sufficient past information is included while maintaining model efficiency. Once the optimal m has been determined, additional lags corresponding to the maximum integration order (dmax), are incorporated into the modified VAR model. This approach allows for valid causality testing while addressing potential non-stationarity in the data. By ensuring that the model accounts for different integration levels without requiring unnecessary differencing, the Toda-Yamamoto method provides a robust framework for analyzing causal relationships in macroeconomic variables.
Indonesia:
|
Lag |
LogL |
LR |
FPE |
AIC |
SC |
HQ |
|
0 |
-223.8717 |
NA |
15.86705 |
16.95346 |
17.19343 |
17.02482 |
|
1 |
-101.1403 |
190.9155 |
0.011824 |
9.714097 |
11.15392* |
10.14223 |
|
2 |
-67.30677 |
40.09900* |
0.007607* |
9.059761* |
11.69943 |
9.844673* |
Malaysia:
|
Lag |
LogL |
LR |
FPE |
AIC |
SC |
HQ |
|
0 |
-96.58020 |
NA |
0.001275 |
7.524459 |
7.764429 |
7.595815 |
|
1 |
-14.76237 |
127.2722* |
1.97e-05* |
3.315731* |
4.755550* |
3.743864* |
|
2 |
2.281594 |
20.20025 |
4.39e-05 |
3.905067 |
6.544735 |
4.689979 |
India:
|
Lag |
LogL |
LR |
FPE |
AIC |
SC |
HQ |
|
0 |
-87.01987 |
NA |
0.000628 |
6.816286 |
7.056256 |
6.887642 |
|
1 |
22.61318 |
170.5403* |
1.23e-06* |
0.547172* |
1.986991* |
0.975306* |
|
2 |
41.01054 |
21.80428 |
2.49e-06 |
1.036256 |
3.675924 |
1.821168 |
Singapore:
|
Lag |
LogL |
LR |
FPE |
AIC |
SC |
HQ |
|
0 |
-71.39364 |
NA |
0.000197 |
5.658788 |
5.898758 |
5.730144 |
|
1 |
24.80008 |
149.6347* |
1.05e-06* |
0.385179* |
1.824998* |
0.813313* |
|
2 |
37.14968 |
14.63656 |
3.32e-06 |
1.322246 |
3.961913 |
2.107157 |
The next phase in the Toda-Yamamoto causality analysis involves examining causal relationships among variables by using the Modified Wald Test (MWald Test), as presented in Table 3. This test identifies the direction of causal links while preserving the structural information within the data, even when variables exhibit different levels of integration.
|
Variable |
Chi-Squared |
Probability |
|---|---|---|
|
Indonesia: |
||
|
CPI → τ |
1.781798 |
0.4103ns |
|
IP → τ |
2.529475 |
0.2823 ns |
|
I → τ |
41.24764 |
0.0000*** |
|
E → τ |
1.834948 |
0.3995 ns |
|
τ → CPI |
3.552356 |
0.1693 ns |
|
IP → CPI |
1.567974 |
0.4566 ns |
|
I → CPI |
5.848634 |
0.0537** |
|
E → CPI |
0.280209 |
0.8693 ns |
|
τ → IP |
1.558303 |
0.4588 ns |
|
CPI → IP |
4.628187 |
0.0989* |
|
I → IP |
1.520529 |
0.4675 ns |
|
E → IP |
0.189210 |
0.9097 ns |
|
τ → I |
1.813280 |
0.4039 ns |
|
CPI → I |
0.753352 |
0.6861 ns |
|
IP→ I |
1.903963 |
0.3860 ns |
|
E → I |
1.570409 |
0.4560 ns |
|
τ → E |
4.820853 |
0.0898* |
|
CPI → E |
3.939057 |
0.1395 ns |
|
IP → E |
1.248340 |
0.5357 ns |
|
I → E |
4.952379 |
0.0841* |
|
Malaysia: |
||
|
CPI → τ |
5.08E-05 |
0.9943 ns |
|
IP → τ |
0.714742 |
0.3979 ns |
|
I → τ |
0.061104 |
0.8048 ns |
|
E → τ |
0.000728 |
0.9785 ns |
|
τ → CPI |
2.316619 |
0.1280 ns |
|
IP → CPI |
0.056361 |
0.8123 ns |
|
I → CPI |
0.027025 |
0.8694 ns |
|
E → CPI |
3.355781 |
0.0670* |
|
τ → IP |
3.280830 |
0.0701* |
|
CPI → IP |
3.12E-07 |
0.9996 ns |
|
I → IP |
0.852461 |
0.3559 ns |
|
E → IP |
0.162090 |
0.6872 ns |
|
τ → I |
0.687954 |
0.4069 ns |
|
CPI → I |
3.662679 |
0.0556** |
|
IP → I |
0.457530 |
0.4988 ns |
|
E → I |
0.032671 |
0.8566 ns |
|
τ → E |
0.072009 |
0.7884 ns |
|
CPI → E |
0.483781 |
0.4867 ns |
|
IP → E |
0.293980 |
0.5877 ns |
|
I → E |
0.896008 |
0.3439 ns |
|
India: |
||
|
CPI → τ |
0.111827 |
0.7381 ns |
|
IP → τ |
0.014008 |
0.9058 ns |
|
I → τ |
0.612533 |
0.4338 ns |
|
E → τ |
3.048105 |
0.0808* |
|
τ → CPI |
4.764697 |
0.0290** |
|
IP → CPI |
0.104895 |
0.7460 ns |
|
I → CPI |
1.476235 |
0.2244 ns |
|
E → CPI |
0.001723 |
0.9669 ns |
|
τ → IP |
1.823209 |
0.1769 ns |
|
CPI → IP |
0.009998 |
0.9204 ns |
|
I → IP |
0.046865 |
0.8286 ns |
|
E → IP |
2.551995 |
0.1102 ns |
|
τ → I |
2.950693 |
0.0858* |
|
CPI → I |
6.122204 |
0.0133*** |
|
IP→ I |
0.082826 |
0.7735 ns |
|
E → I |
0.782127 |
0.3765 ns |
|
τ → E |
3.928688 |
0.0475** |
|
CPI → E |
0.003977 |
0.9497 ns |
|
IP → E |
0.315724 |
0.5742 ns |
|
I → E |
0.079766 |
0.7776 ns |
|
Singapore: |
||
|
CPI → τ |
0.062841 |
0.8021 ns |
|
IP → τ |
0.010493 |
0.9184 ns |
|
I → τ |
0.579441 |
0.4465 ns |
|
E → τ |
0.073147 |
0.7868 ns |
|
τ → CPI |
1.006418 |
0.3158 ns |
|
IP → CPI |
0.595601 |
0.4403 ns |
|
I → CPI |
0.926232 |
0.3358 ns |
|
E → CPI |
0.392137 |
0.5312 ns |
|
τ → IP |
0.003254 |
0.9545 ns |
|
CPI → IP |
3.672917 |
0.0553** |
|
I → IP |
2.516142 |
0.1127 ns |
|
E → IP |
1.187862 |
0.2758 ns |
|
τ → I |
0.093160 |
0.7602 ns |
|
CPI → I |
0.629120 |
0.4277 ns |
|
IP → I |
3.141260 |
0.0763* |
|
E → I |
0.223175 |
0.6366 ns |
|
τ → E |
1.178652 |
0.2776 ns |
|
CPI → E |
0.454954 |
0.5000 ns |
|
IP → E |
0.036412 |
0.8487 ns |
|
I → E |
0.150431 |
0.6981 ns |
Note. ***significant at 1% (0.01), ** significant at 5% (0.05), * significant at 10% (0.10), ‘ns’ not significant.
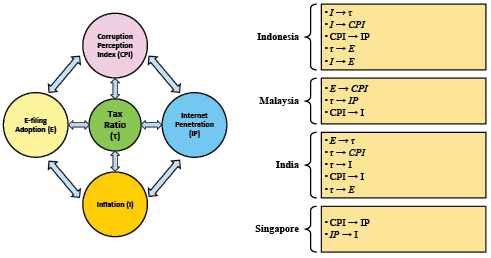
In Indonesia, the analysis reveals five significant causal relationships. Inflation (I) significantly influences the tax ratio (τ) at a 1% significance level (p-value = 0.0000), thus highlighting the importance of macroeconomic stability in optimizing tax revenue. Additionally, inflation affects the CPI at a 5% significance level (p-value = 0.0537), suggesting that price fluctuations can shape perceptions of corruption. CPI, in turn, influences internet penetration (IP) at a 10% significance level (p-value = 0.0989), indicating that improvements in governance and reductions in corruption may drive digitalization in the taxation sector. The tax ratio (τ) affects e-filing adoption (E) at a 10% significance level (p-value = 0.0898), implying that fiscal policies can accelerate the digitalization of tax administration. Lastly, inflation (I) impacts e-filing adoption (E) at a 10% significance level (p-value = 0.0841), possibly reflecting the effect of price stability on the adoption of technology in tax administration.
In Malaysia, three significant causal relationships were observed. E-filing adoption (E) influences CPI at a 10% significance level (p-value = 0.0670), suggesting that the digitalization of tax administration can enhance perceptions of corruption. The tax ratio (τ) affects internet penetration (IP) at a 10% significance level (p-value = 0.0701), implying that fiscal policies can promote internet penetration and economic digitalization. Additionally, CPI influences inflation (I) at a 5% significance level (p-value = 0.0556), indicating that governance perceptions can impact price stability.
The analysis for India identifies five significant causal relationships. The tax ratio (τ) influences CPI at a 5% significance level (p-value = 0.0290), suggesting that effective tax policies can enhance public perception of government institutions. E-filing adoption (E) affects the tax ratio (τ) at a 10% significance level (p-value = 0.0808), indicating that the digitalization of tax administration can influence fiscal policies. Additionally, the tax ratio (τ) impacts inflation (I) at a 10% significance level (p-value = 0.0858), suggesting that tax policies can affect price stability. CPI influences inflation (I) at a 1% significance level (p-value = 0.0133), reinforcing the idea that governance perceptions can impact macroeconomic stability. Lastly, the tax ratio (τ) affects e-filing adoption (E) at a 5% significance level (p-value = 0.0475), suggesting that fiscal policies can drive the digitalization of tax administration.
For Singapore, two significant causal relationships were found. CPI influences internet penetration (IP) at a 5% significance level (p-value = 0.0553), suggesting that perceptions of corruption can impact internet penetration rates. Singapore, a country known for its low corruption levels and ranking third globally in the Corruption Perception Index in 2024, has created a favorable environment for investment and digital infrastructure development, which, in turn, increases internet penetration. Additionally, IP influences inflation (I) at a 10% significance level (p-value = 0.0763), potentially reflecting the impact of digital technology on macroeconomic dynamics.
Some relationships in this study are statistically insignificant, possibly due to weak correlations, data volatility, policy variations, or model limitations. However, this does not necessarily indicate the absence of a relationship – but rather highlights the need for a more refined methodological approach to uncover some deeper insights. Figure 1 below summarizes the causal relationships observed in each country.
This study reveals key causal relationships between the tax reform and macroeconomic factors affecting the tax ratio in Indonesia, Malaysia, India, and Singapore. By using the Toda-Yamamoto approach, the analysis confirms the roles of CPI, internet penetration, inflation, and e-filing adoption in shaping tax dynamics. The findings support prior research on the importance of macroeconomic stability, governance transparency, and digitalization in optimizing tax revenue (Bird & Zolt, 2011; Dom et al., 2022; Yossinomita, Haryadi, & Hodijah, 2024; Yossinomita, Haryadi, Nainggolan et al., 2024).
In Indonesia, macroeconomic stability, governance, and digitalization emerge as key drivers of tax administration efficiency. The relationship between inflation and the tax ratio underscores the importance of price stability in maintaining tax compliance and revenue collection (Caballé & Panadés, 2004; Sarin & Mazur, 2023). Furthermore, effect of inflation on CPI suggests that economic instability can shape public perceptions of governance, thereby reinforcing arguments that price fluctuations influence institutional trust (Afzali et al., 2021). Improvements in governance, reflected in CPI, also drive internet penetration, highlighting the role of transparency in fostering digital adoption in taxation (Capasso et al., 2021). Additionally, the tax ratio’s effect on e-filing adoption indicates that broader fiscal policies can accelerate the transition to digital tax administration, aligning with research on how tax base expansion fosters digital transformation (Plekhanov et al., 2023). Finally, inflation’s role in facilitating e-filing adoption suggests that economic stability encourages both taxpayers and authorities to invest in digital solutions, as stable conditions reduce uncertainty and promote technological integration (Bassey et al., 2022).
Similar dynamics are observed in Malaysia, where governance and digitalization play a crucial role in shaping tax administration. The impact of e-filing adoption on CPI suggests that advancements in digital tax systems enhance transparency and reduce corruption risks, reinforcing research on how digitalization minimizes opportunities for corrupt practices (Jiang et al., 2023; Uyar et al., 2021). Moreover, the influence of the tax ratio on internet penetration supports the argument that taxation policies and technological development are interdependent, as fiscal policies can stimulate digital infrastructure investment (Ebaidalla, 2024). The relationship between CPI and inflation further highlights the impact of governance quality on macroeconomic stability, aligning with studies linking strong institutional frameworks to stable economic conditions (Uddin et al., 2023; Yossinomita, 2022).
India presents another perspective on the interplay between taxation, governance, and economic conditions. The significant relationship between the tax ratio and CPI highlights how effective tax policies can strengthen public trust in government institutions, reinforcing the argument that transparent tax systems enhance state legitimacy (Capasso et al., 2021). Additionally, the influence of e-filing adoption on the tax ratio suggests that digital tax administration plays a role in shaping fiscal policies and compliance, supporting findings on the benefits of digitalization in taxation (Bellon et al., 2022). The tax ratio’s effect on inflation underscores the role of tax policies in economic stability and price regulation (Afonso et al., 2016), while the strong link between CPI and inflation highlights how governance quality shapes macroeconomic conditions (Misi Lopes et al., 2023). Furthermore, the tax ratio’s impact on e-filing adoption suggests that well-structured fiscal policies can drive digital transformation in tax administration, emphasizing the interdependence of taxation and technological adaptation (Dom et al., 2022).
Meanwhile, Singapore presents a distinct case where strong governance and digital infrastructure development play a central role in shaping economic and tax-related outcomes. The relationship between CPI and internet penetration suggests that low corruption levels create a conducive environment for digital expansion, aligning with studies showing that well-governed economies are more likely to integrate technological innovations into public administration (Yang et al., 2024). As a global leader in governance, Singapore has leveraged its institutional strength to drive investment and digital infrastructure growth, further enhancing internet penetration. Additionally, the influence of internet penetration on inflation suggests that digital transformation has broader macroeconomic implications, supporting research on the economic effects of digitalization (Cheng et al., 2023).
This study highlights that a tax reform is shaped not only by a fiscal policy but also by macroeconomic stability, governance quality, and digital adoption, which are key factors across countries globally. The effectiveness of tax systems depends on economic conditions, institutional trust, and technological readiness, making the findings relevant for both developing and developed nations. By identifying causal links between inflation, corruption perception, internet penetration, and e-filing adoption, the study offers empirical insights for evidence-based policymaking. Although based on four Asian countries, the comparative and analytical framework is adaptable across contexts. These results are valuable for policymakers, researchers, and practitioners worldwide, whether in Asia, Europe, or elsewhere, who are seeking to build efficient, fair, and digitally adaptive tax systems grounded in strong governance.
This study provides empirical evidence on the intricate relationship between a tax reform, macroeconomic stability, governance quality, and digitalization in Indonesia, Malaysia, India, and Singapore. The findings underscore that tax ratio dynamics are not solely driven by fiscal policies but are also influenced by broader economic and institutional factors. Inflation, transparency, internet penetration, and digital tax adoption emerge as critical determinants shaping tax administration effectiveness and compliance. While each country exhibits unique patterns, common trends highlight the interdependence of taxation, governance, and digital transformation. The study confirms that stable macroeconomic conditions enhance tax compliance, good governance fosters digital adoption, and digitalization, in turn, contributes to transparency and efficiency in tax administration.
Based on these findings, policymakers should adopt a comprehensive approach to tax reform by integrating fiscal strategies with governance improvements and technological advancements. First, ensuring macroeconomic stability through inflation control and sound monetary policies is essential to maintain tax revenue consistency. Second, strengthening governance frameworks, particularly in enhancing transparency and reducing corruption, can improve taxpayer trust and compliance. Third, accelerating digitalization in tax administration, including expansion of e-filing systems and digital payment infrastructure, can enhance efficiency and reduce administrative burdens. Finally, cross-country collaboration in policy innovation and knowledge-sharing can further optimize tax reform strategies. A well-integrated approach that considers economic conditions, institutional quality, and technological readiness will contribute to a more effective, equitable, and resilient tax system, ultimately supporting long-term economic development and governance integrity.
Afonso, J. R., Araújo, E. C., & Fajardo, B. G. (2016). The role of fiscal and monetary policies in the Brazilian economy: understanding recent institutional reforms and economic changes. Quarterly Review of Economics and Finance, 62(November), 41–55. https://doi.org/10.1016/j.qref.2016.07.005
Afzali, M., Ҫolak, G., & Fu, M. (2021). Economic uncertainty and corruption: evidence from public and private firms. Journal of Financial Stability, 57(March). https://doi.org/10.1016/j.jfs.2021.100936
Ansong, J. D., Asamoah, M. K., Agyekum, B., & Nketiah-Amponsah, E. (2024). The influence of education on addressing the challenges of taxation and cocoa revenue mobilization in Ghana. Social Sciences and Humanities Open, 10(June), 101098. https://doi.org/10.1016/j.ssaho.2024.101098
Asian Development Bank. (2022). Launching a digital tax administration transformation, what you need to know (Issue May). https://doi.org/10.22617/TCS210343
Badan Kebijakan Fiskal. (2022). Two decades of fiscal decentralization, implementation in Indonesia. Development Economic Growth Support Activity (USAID EGSA).
Bartha, A., & Boda, Z. (2024). Tax compliance motivations during corruption scandals in a fragile democracy: a before-and-after study. Europe - Asia Studies, 76(7), 1055–1077. https://doi.org/10.1080/09668136.2024.2378814
Bassey, E., Mulligan, E., & Ojo, A. (2022). A conceptual framework for digital tax administration - a systematic review. Government Information Quarterly, 39(4), 101754. https://doi.org/10.1016/j.giq.2022.101754
Bellon, M., Dabla-Norris, E., Khalid, S., & Lima, F. (2022). Digitalization to improve tax compliance: evidence from VAT e-Invoicing in Peru. Journal of Public Economics, 210(June), 104661. https://doi.org/10.1016/j.jpubeco.2022.104661
Bird, R. M., & Zolt, E. M. (2011). Technology and taxation in developing countries: from hand to mouse. SSRN Electronic Journal, October. https://doi.org/10.2139/ssrn.1086853
Caballé, J., & Panadés, J. (2004). Inflation, tax evasion, and the distribution of consumption. Journal of Macroeconomics, 26(4), 567–595. https://doi.org/10.1016/j.jmacro.2003.06.001
Capasso, S., Cicatiello, L., De Simone, E., Gaeta, G. L., & Mourão, P. R. (2021). Fiscal transparency and tax ethics: does better information lead to greater compliance? Journal of Policy Modeling, 43(5), 1031–1050. https://doi.org/10.1016/j.jpolmod.2020.06.003
Cheng, Y., Zhou, X., & Li, Y. (2023). The impact of digital transformation on green total factor productivity of heavily polluting enterprises. Frontiers in Psychology, 14(February), 488–501. https://doi.org/10.3389/fpsyg.2023.1265391
Dom, R., Custers, A., Davenport, S., & Prichard, W. (2022). Innovations in tax compliance: building trust, navigating politics, and tailoring reform. In World Bank Group. https://doi.org/10.1596/978-1-4648-1755-7
Ebaidalla, E. M. (2024). The impact of taxation, technological innovation and trade openness on renewable energy investment: evidence from the top renewable energy producing countries. Energy, 306(February), 132539. https://doi.org/10.1016/j.energy.2024.132539
Gale, W. G., & Brown, S. (2013). Tax reform for growth, equity, and revenue. Public Finance Review, 41(6), 721–754. https://doi.org/10.1177/1091142113493655
Hendricks, S., & Mwapwele, S. D. (2024). A systematic literature review on the factors influencing e-commerce adoption in developing countries. Data and Information Management, 8(1), 100045. https://doi.org/10.1016/j.dim.2023.100045
Islam, A., Rashid, M. H. U., Hossain, S. Z., & Hashmi, R. (2020). Public policies and tax evasion: evidence from SAARC countries. Heliyon, 6(11), e05449. https://doi.org/10.1016/j.heliyon.2020.e05449
Jaber, M. M., Szép, T., El-naqa, A. R., & Abusmier, S. A. (2025). Energy consumption, economic growth, and climate change nexus in Jordan : insights from the Toda Yamamoto causality test. Resources, 14(36), 1–15. https://doi.org/10.3390/resources14030036
Jaber, Y., Kabouri, I., Bouzahzah, M., Ibourk, A., & Karim, M. (2022). Economic growth and education in Morocco: cointegration and Toda Yamamoto Granger Causality. International Journal of Accounting, Finance, Auditing, Management and Economics, 3(4–1), 1–20. https://doi.org/10.5281/zenodo.6611974
Jiang, Q., Chen, Y., & Sun, T. (2023). Government social media and corporate tax avoidance. China Journal of Accounting Research, 16(2), 100304. https://doi.org/10.1016/j.cjar.2023.100304
Kouam, J. C., & Asongu, S. A. (2022). Effects of taxation on social innovation and implications for achieving sustainable development goals in developing countries : a literature review. International Journal of Innovation Studies, 6(4), 259–275. https://doi.org/10.1016/j.ijis.2022.08.002
Li, J., Wang, X., & Wu, Y. (2020). Can government improve tax compliance by adopting advanced information technology? evidence from the Golden Tax Project III in China. Economic Modelling, 93(August), 384–397. https://doi.org/10.1016/j.econmod.2020.08.009
Li, R., Joyeux, R., & Ripple, R. D. (2021). Income and energy consumption in Asia-Pacific countries – a panel cointegration analysis enhanced with common factors. Heliyon, 7(5), e07090. https://doi.org/10.1016/j.heliyon.2021.e07090
Lubis, N. I., Susilawaty, T. E., & Lyanto, B. (2022). The growth and impact of e-filing in Indonesia. Accumulated Journal (Accounting and Management Research Edition), 4(2), 186. https://doi.org/10.22303/accumulated.4.2.2022.186-198
Martinez-Vazquez, J. (2022). Successful tax reforms in the recent international experience: lessons in political economy and the nuts and bolts of increasing country tax revenue effort. Asian Development Bank (ADB).
Matharu, S. K., Haryani, S., & Motwani, B. (2017). Impact of demographics of tax payers’ on their perception towards e-file adoption. FIIB Business Review, 6(2), 51–57. https://doi.org/10.1177/2455265820170208
Misi Lopes, L. E., Packham, N., & Walther, U. (2023). The effect of governance quality on future economic growth: an analysis and comparison of emerging market and developed economies. In SN Business & Economics (Vol. 3, Issue 6). Springer International Publishing. https://doi.org/10.1007/s43546-023-00488-3
Mohammed, H., & Tangl, A. (2024). Taxation perspectives: analyzing the factors behind viewing taxes as punishment—a Comprehensive study of taxes as service or strain. Journal of Risk and Financial Management, 17(1), 1–17. https://doi.org/10.3390/jrfm17010005
Musah, A., Padi, A., Blay, M. W., Okyere, D. O., & Ofori, B. S. (2025). Ethical organisational culture, effective internal control systems and tax compliance of small and medium scale enterprises (SMEs): the role of corporate governance. Social Sciences and Humanities Open, 11(February), 101331. https://doi.org/10.1016/j.ssaho.2025.101331
OECD. (2022). Revenue statistics in Asia and the Pacific, strengthening tax revenues in developing Asia 1990-2020. In OECD Publishing. https://doi.org/10.1787/db29f89a-en
Ojeka, S., Adegboye, A., Adegboye, K., Umukoro, O., Dahunsi, O., & Ozordi, E. (2019). Corruption perception, institutional quality and performance of listed companies in Nigeria. Heliyon, 5(10), e02569. https://doi.org/10.1016/j.heliyon.2019.e02569
Plekhanov, D., Franke, H., & Netland, T. H. (2023). Digital transformation: a review and research agenda. European Management Journal, 41(6), 821–844. https://doi.org/10.1016/j.emj.2022.09.007
Raouf, E. (2022). The impact of financial inclusion on tax revenue in EMEA countries: a threshold regression approach. Borsa Istanbul Review, 22(6), 1158–1164. https://doi.org/10.1016/j.bir.2022.08.003
Rashid, M. H. U., Ahmad, A., Abdullah, M. S., Ahmmed, M., & Islam, S. (2022). Doing business and tax Evasion: evidence from Asian countries. SAGE Open, 12(4), 1–15. https://doi.org/10.1177/21582440221131280
Santhanamery, T., & Ramayah, T. (2015). Understanding the effect of demographic and personality traits on the e-filing continuance usage intention in Malaysia. Global Business Review, 16(1), 1–20. https://doi.org/10.1177/0972150914553459
Sarin, N., & Mazur, M. J. (2023). The inflation reduction act’s impact on tax compliance—and fiscal sustainability. SSRN Electronic Journal, 15(May), 1–29. https://doi.org/10.2139/ssrn.4449161
Teo, T. S. H., & Wong, P. K. (2005). Implementing electronic filing of tax returns: insights from the Singapore experience. Journal of Information Technology Case and Application Research, 7(2), 3–18. https://doi.org/10.1080/15228053.2005.10856062
Torregrosa-Hetland, S., & Sabate, O. (2022). Income tax progressivity and inflation during the world wars. European Review of Economic History, 26(3), 311–339. https://doi.org/10.1093/ereh/heab020
Uddin, I., Ahmad, M., Ismailov, D., Eid, M., Akhmedov, A., Khasanov, S., & Ul, M. (2023). Enhancing institutional quality to boost economic development in developing nations : new insights from CS-ARDL approach. Research in Globalization, 7(June), 100137. https://doi.org/10.1016/j.resglo.2023.100137
Uyar, A., Nimer, K., Kuzey, C., Shahbaz, M., & Schneider, F. (2021). Can e-government initiatives alleviate tax evasion? the moderation effect of ICT. Technological Forecasting and Social Change, 166(May), 120597. https://doi.org/10.1016/j.techfore.2021.120597
Yang, C., Gu, M., & Albitar, K. (2024). Government in the digital age: exploring the impact of digital transformation on governmental efficiency. Technological Forecasting and Social Change, 208(September), 123722. https://doi.org/10.1016/j.techfore.2024.123722
Yossinomita. (2022). Tax policy in limiting the consumption of luxury goods. Review of Economics and Finance, 20(1), 165–171. https://doi.org/10.55365/1923.x2022.20.19
Yossinomita, Haryadi, Nainggolan, S., & Zulfanetti. (2024). Maximizing economic growth in Indonesia: A model-based exploration of optimal tax ratio. Indonesian Treasury Review: Jurnal Perbendaharaan, Keuangan Negara Dan Kebijakan Publik, 9(2), 87–98. https://doi.org/10.33105/itrev.v9i2.756
Yossinomita, Y., Effiyaldi, E., Feranika, A., Mardiana, R., Hassandi, I., Pangestu, M. G., & Fahdillah, Y. (2025). Analysis of optimal tax ratio and efficiency of regional tax revenue : a case study of provinces in Indonesia. Journal of Tax Reform, 11(1), 74–99. https://doi.org/10.15826/jtr.2025.11.1.193
Yossinomita, Y., Haryadi, & Hodijah, S. (2024). Determining the future direction and amount of tax revenue in Indonesia using an error correction model (ECM). Ekonomika, 103(1), 56–77. https://doi.org/10.15388/Ekon.2024.103.1.4