
Ekonomika ISSN 1392-1258 eISSN 2424-6166
2026, vol. 105(1), pp. 6–24 DOI: https://doi.org/10.15388/Ekon.2026.105.1.1
Marco I. Bonelli
PhD, Contract Professor
Department of Management
Ca' Foscari, University of Venice, Italy
Email: mibonelli6@gmail.com
ORCID: https://orcid.org/0000-0003-3463-6421
Abstract. This study quantifies Lithuania’s Equity Risk Premium (ERP) by integrating Damodaran’s country-risk premium (CRP) framework with a multiple regression on key market drivers. By using quarterly data from Q1 2015 to Q4 2024, the CRP model yields an implied cost of equity of 9.84%, corresponding to an ERP of 5.84% above a 4.00% U.S. risk-free rate. Our OLS regression explains 94% of ERP variation (adjusted R² = 0.94). Expected market return emerges as the strongest predictor (β = 0.914, p < 0.001), followed by sovereign bond yield (β = –0.602, p < 0.001) and inflation (β = –0.017, p = 0.025). Variance-inflation factors confirm that multicollinearity is not problematic. These results imply that targeted liquidity-enhancing reforms – such as market-making incentives – could compress Lithuania’s ERP by approximately 0.6 percentage points. By combining theoretical asset-pricing models with frontier-market empirics, our dual-lens approach offers actionable insights for policymakers and investors operating in structurally constrained equity markets.
Keywords: equity risk premium; country risk; Damodaran CRP model; Lithuania; regression analysis; market liquidity.
__________
Received: 08/05/2025. Accepted: 30/01/2026
Copyright © 2026 Marco I. Bonelli. Published by Vilnius University Press
This is an Open Access article distributed under the terms of the Creative Commons Attribution License, which permits unrestricted use, distribution, and reproduction in any medium, provided the original author and source are credited.
The Equity Risk Premium (ERP) – which is the excess return that investors demand for holding equities over risk-free assets – remains a cornerstone of asset pricing, shaping investment decisions and market valuations (Damodaran, 2024). Historically, ERP has been tied to macroeconomic fundamentals such as GDP growth, inflation, and interest rates, as well as investor sentiment proxies like market volatility (Campbell & Thompson, 2008; Lettau & Ludvigson, 2004). While strong economic performance typically lowers ERP by reducing the perceived risk, uncertainty amplifies risk aversion, thereby elevating premiums. However, recent shifts in global markets which were marked by real-time pricing and integrated capital flows have heightened the role of forward-looking metrics such as implied equity returns and bond yields, potentially diminishing the influence of the traditional macroeconomic indicators (Damodaran, 2024a; MSCI Research, 2020).
These dynamics are particularly pronounced in frontier markets, which straddle the line between emerging and underdeveloped economies. Such markets, including Lithuania, present a paradox: they offer rapid growth and diversification benefits but are plagued by structural weaknesses like illiquidity, limited market breadth, and governance gaps (Bekaert & Harvey, 2023; Franklin Templeton, 2024). Lithuania, as a Eurozone member with robust sovereign credit ratings (Moody’s A2; S&P A), epitomizes this duality. Despite macroeconomic stability, its equity market remains underdeveloped, with a capitalization of $5–6 billion (6% of GDP) and an annual turnover of approximately 5%, far below the developed-market standards (Nasdaq Baltic, 2025; CEIC, 2025; Helgi Library, 2025). Global index providers classify Lithuania as a frontier market due to these structural constraints rather than sovereign risk (Frontier Market News, 2024), raising critical questions about how investors price risk in such environments.
Lithuania’s post-Soviet transformation has been marked by rapid institutional reforms, privatization, and EU integration. Yet, its capital markets have stagnated. Nasdaq Vilnius, the nation’s primary exchange, lists only 32 companies with a combined market capitalization of $5.7 billion (SSE Initiative, 2025) – which is a mere 6.2% of GDP, far below the global average of 50% (CEIC, 2025). Figure 1 illustrates Lithuania’s stagnant equity market performance over the past decade, highlighting its limited growth and investor appeal compared to regional peers.
Note. Created by the author; data from Nasdaq Baltic (2025) were used
Liquidity constraints further compound the challenge. Annual turnover hovers in single digits (Helgi Library, 2025), reflecting a narrow investor base dominated by risk-averse households and institutions favoring foreign markets. Consequently, index providers like MSCI and FTSE retain Lithuania’s ‘Frontier Market’ classification (Frontier Market News, 2024) – which is a label tied not to sovereign risk but to structural deficiencies in scale and liquidity.
Recent initiatives, however, signal potential inflection points. The landmark €450 million IPO of Ignitis Group (2020), Lithuania’s largest public offering, revitalized the market visibility, while subsequent listings (e.g., Telia Lietuva, Šiaulių Bankas) have created a nascent core of investable equities. Regional integration efforts, including the MSCI Baltic index and EBRD-backed reforms (EuropaWire, 2023), aim to address scale limitations by pooling Baltic markets. Yet whether these measures can transition Lithuania from frontier to emerging status remains untested.
This study addresses four key research questions:
To answer these questions, we adopt a dual-method approach. First, we apply Damodaran’s (2024) Country Risk Premium (CRP) framework, starting with a mature-market ERP baseline (U.S. equity risk premium) and adjusting for Lithuania-specific risks, including sovereign default spreads and equity volatility. This forward-looking model quantifies the implied cost of equity, offering a benchmark against regional peers. Second, we analyze quarterly data (2015–2024) by using a regression model with the objective to identify ERP drivers, while integrating traditional macroeconomic variables (GDP growth, inflation) with market-based indicators (global yields, VIX). This dual lens bridges asset pricing theory and frontier-market empirics, revealing whether Lithuania’s ERP aligns with global trends favoring forward-looking metrics.
The analysis is structured as follows. Section 2 reviews the relevant literature on equity risk premiums in frontier and emerging markets, including theoretical models of country risk and empirical findings on market development constraints. Section 3 describes the data and methodology, detailing the construction of the dataset, the implementation of Damodaran’s model for Lithuania and peer countries, and the specification of the regression model. Section 4 presents the results: we report the implied cost of equity for Lithuania and benchmark it against comparators, and we discuss the regression estimates of ERP drivers and their significance. Section 5 provides an integrated discussion, answering the research questions in turn, exploring the implications of the findings for Lithuania’s market and for asset pricing in frontier markets more broadly. Section 6 concludes the paper, highlighting key contributions and suggesting directions for future research and policy developments.
By focusing on Lithuania – which is a stable yet structurally constrained EU market – this study contributes to debates on how institutional strength and market inefficiencies interact in shaping risk premiums. The findings hold implications for policymakers seeking to enhance market depth and for investors navigating frontier economies where growth potential coexists with liquidity risks.
Frontier and small emerging markets – such as those in the Baltic region (Lithuania, Latvia, and Estonia) – present unique challenges for risk pricing. These markets typically exhibit lower market capitalizations, reduced trading volumes, and immature regulatory frameworks relative to developed markets (Bekaert & Harvey, 2023). Consequently, their risk-return profiles significantly differ due to segmentation and liquidity constraints (Alexakis, Kenourgios, & Dimitriou, 2016). For example, Alexakis et al. (2016) documented varying contagion effects in the Baltic region during financial crises, revealing Lithuania’s and Latvia’s increased vulnerability during the Global Financial Crisis but relative insulation during the Eurozone Debt Crisis. Conversely, Estonia showed resilience during the earlier crisis but increased vulnerability later, which indicates that frontier market risks depend heavily on specific structural conditions and integration with global markets (Alexakis et al., 2016).
These markets often deviate from assumptions of efficiency used in traditional asset pricing models. Gil-Alana, Gupta, Shittu, and Yaya (2018) identified persistent market inefficiencies in the Baltic region, rejecting the weak-form Efficient Market Hypothesis and noting prolonged volatility following negative shocks. Consequently, investors demand higher equity risk premiums due to these inefficiencies and liquidity risks (Gil-Alana et al., 2018).
Traditional asset-pricing models often understate risk in frontier markets because they ignore market-structure constraints – this is what we term ‘structural’ factors (e.g., limited market depth, low free float, and narrow investor participation) that persist even in the absence of cyclical shocks. To capture both sovereign risk and these structural frictions, we apply Damodaran’s (2024a) Country-Risk Premium (CRP) framework. In this approach, the implied cost of equity (Kₑ) is given by:
Kₑ = R₍f₎ + ERP₍base₎ + DefaultSpread × (σ₍bond₎ / σ₍equity₎)
where:
- R₍f₎ is the risk-free rate (10-year U.S. Treasury yield, 4.00% as of Q4 2024).
- ERP₍base₎ is the mature-market equity risk premium (U.S. ERP, 5.00% per Damodaran).
- DefaultSpread is Lithuania’s sovereign credit spread (0.84%, Moody’s A2).
- σ₍bond₎ / σ₍equity₎ is the ratio of bond to equity volatility (1.00), which scales the sovereign spread by relative asset risk.
Multiplying the default spread by the volatility ratio captures how structural inefficiencies – chiefly illiquidity and limited participation – amplify sovereign-risk impacts on equity investors. A ratio above 1 indicates that equity is more volatile than bonds, thereby increasing the required equity premium.
Lithuania’s capital market is notably underdeveloped despite favorable macroeconomic conditions and EU integration. Established earlier than its Baltic counterparts and integrated into NASDAQ OMX, the Lithuanian stock market remains limited in depth and investor engagement (Bartkus, 2020; Žakas, 2023). Žakas (2023) identifies barriers including limited liquidity, a narrow domestic investor base, along with regulatory inefficiencies, suggesting strategic reforms based on successful smaller-market examples (e.g., Iceland) to unlock potential.
Low domestic investor participation remains a critical issue. Despite substantial growth opportunities demonstrated between 2010 and 2020 (Bartkus, 2020), household equity market participation in Lithuania is markedly low (Mauricas, Darškuvienė, & Mariničevaitė, 2017). Mauricas et al. (2017) attribute this “stock market participation puzzle” to behavioral and trust-related factors, specifically highlighting financial illiteracy, risk aversion, and distrust towards financial institutions rather than transaction costs or market size constraints. This behavioral phenomenon is consistent across the Baltic region and broader Central-Eastern Europe (Mauricas et al., 2017).
Thus, overcoming structural and behavioral hurdles through enhanced investor education, trust-building, and market reforms is vital for Lithuania’s capital market development and optimal risk pricing (Žakas, 2023).
In developed markets, ERP drivers like dividend yields, inflation, and consumption trends are well-documented (Campbell & Thompson, 2008; Lettau & Ludvigson, 2004). However, these models assume liquid markets where prices rapidly reflect information – which is a tenuous assumption for frontier contexts. Post-2008, global factors like bond yields and risk appetite have gained prominence in ERP determination (MSCI Research, 2020), raising questions about their relevance in smaller markets.
This study bridges gaps by analyzing Lithuania’s ERP through two lenses:
By contextualizing Lithuania’s experience alongside cases like Romania (upgraded post-reforms; FTSE Russell, 2020) and Estonia (tech-driven growth), the study offers actionable insights for policymakers. It addresses calls for tailored strategies to enhance market participation and liquidity in small economies (World Bank, 2019), emphasizing that even stable, EU-aligned markets require structural reforms to reduce risk premiums.
Additionally, Lithuania’s ERP integrates global, regional, and domestic influences. Key drivers include corporate dividend policies, investor sentiment, global market integration, and market structure. Bartkus (2020) emphasizes a significant contribution of dividends to equity returns between 2010–2020, underscoring their importance in investor compensation within an illiquid market.
Investor sentiment is influential; Vaitkė and Martinkutė-Kaulienė (2018) find a strong correlation between positive investor expectations and Lithuanian securities market development, suggesting sentiment-driven fluctuations in ERP. Further, global market dynamics significantly impact local premiums. Kiškienė and Vasiliauskaitė (2022) illustrate how global sector performance indicators correlate with Lithuanian market movements, highlighting sensitivity to global economic conditions and external shocks, such as the COVID-19 pandemic.
Market structure issues – such as low liquidity, limited investor participation, and persistent inefficiencies (Gil-Alana et al., 2018) – also elevate required returns. Methodological adaptations are necessary, including regime-specific analysis (Gil-Alana et al., 2018) and advanced forecasting methods leveraging artificial intelligence and machine learning (Kiškienė & Vasiliauskaitė, 2022). Qualitative insights into investor behavior (Mauricas et al., 2017) further enhance ERP estimation accuracy.
In summary, Lithuania’s ERP emerges from an interplay between corporate fundamentals, investor behavior, global influences, and market structure, necessitating comprehensive, adapted methods for accurate estimation and effective policy formulation.
The empirical analysis utilizes quarterly data from Q1 2015 to Q4 2024 (i.e., 40 quarters in total) for Lithuania, focusing on variables that influence the Equity Risk Premium (ERP). The dataset integrates macroeconomic indicators, market-driven metrics, and global risk sentiment proxies:
Data sources include Eurostat (macroeconomic variables), the European Central Bank (interest rates), the Bank of Lithuania (bond yields), CEIC Data (market statistics), and Damodaran’s ERP datasets. Summary statistics reveal that Lithuania’s quarterly GDP growth averaged 3%, inflation remained low (except in 2022–2023), and the 10-year bond yield fluctuated between 0.5% and 3%. The VIX averaged 15–20, peaking at 50 in Q1 2020. Lithuania’s implied ERP averaged 5–6%, declining slightly after 2020.
A multiple linear regression model quantifies the relationship between ERP and its determinants:
ERPt = α + β1(GDPGrowtht) + β2(Inflt) + β3(IntRatet) + β4(BondYieldt) +
β5(VIXt) + β6(ExpRett) + ϵt
This model blends domestic (GDP, inflation) and global (VIX, bond yields) factors, testing whether Lithuania’s ERP is driven by local conditions or broader market trends.
Damodaran’s country risk premium (CRP) framework provides a cross-sectional perspective on Lithuania’s cost of equity relative to peers. The steps are:
Lithuania’s cost of equity is calculated as:
Ke = Rf + ERPbase + (DefaultSpread × VolatilityFactor) =
4.0% + 5.0% +0.84% = 9.84%
This ~10% required return (in USD terms) is benchmarked against peers: Estonia (A1, 0.70% spread), Latvia/Slovakia (A3, 1.19%), and Romania (Baa3, 2.18%). Market metrics (e.g., market cap/GDP, turnover) from CEIC and stock exchanges contextualize structural differences.
Prior to estimating our OLS model, we examine pairwise dependencies among the six independent variables to assess multicollinearity risks.
Table 1 reports Pearson correlation coefficients for GDPGrowth, Infl, IntRate, BondYield, VIX, and ExpRet over Q1 2015–Q4 2024.
|
GDPGrowth |
Infl |
IntRate |
BondYield |
VIX |
ExpRet |
|
|---|---|---|---|---|---|---|
|
GDPGrowth |
1.00 |
–0.15 |
–0.39 |
–0.44 |
0.03 |
–0.51 |
|
Infl |
–0.15 |
1.00 |
0.33 |
0.23 |
–0.00 |
0.09 |
|
IntRate |
–0.39 |
0.33 |
1.00 |
0.92 |
0.04 |
0.56 |
|
BondYield |
–0.44 |
0.23 |
0.92 |
1.00 |
0.05 |
0.77 |
|
VIX |
0.03 |
–0.00 |
0.04 |
0.05 |
1.00 |
–0.00 |
|
ExpRet |
–0.51 |
0.09 |
0.56 |
0.77 |
–0.00 |
1.00 |
Note: All coefficients are Pearson correlations.
As shown in Table 4.1, the strongest correlation occurs between IntRate and BondYield (ρ = 0.92). All other coefficients remain below 0.70, and variance inflation factors (VIFs) for each predictor are under 3.0, indicating that multicollinearity is not problematic for our regression estimates.
To establish Lithuania’s implied cost of equity and to benchmark it against regional peers, this analysis applies Damodaran’s country risk premium model (Damodaran, 2024a) utilizing financial data from 2015 to 2024. Lithuania’s implied cost of equity was estimated at 9.8% (USD terms) as of 2024, corresponding to an equity risk premium (ERP) of 5.8% above the U.S. risk-free rate of 4.0%. This ERP is modest, surpassing mature-market premiums by only 1.0–1.2 percentage points, reflecting Lithuania’s solid macroeconomic stability and favorable sovereign credit rating (Moody’s rating of A2). In comparison, Lithuania’s ERP closely aligns with developed Southern European markets like Spain (9%) and South Korea (8.5%) in 2024, and is significantly lower than typical frontier market ERPs, which range between 15% and 20% in higher-risk regions such as Africa or Asia (Damodaran, 2024a).
In euro terms, Lithuania’s implied cost of equity was calculated at 7.8%, by using a German Bund yield of 2.5% and a eurozone ERP of 4.5%. This favorable cost places Lithuania notably ahead of major emerging markets such as Turkey or Brazil, where local-currency costs regularly exceed 12–15%. Despite these competitive metrics, Lithuanian equities traded at earnings yield between 8–12%, translating into P/E ratios around 8–12×, demonstrating that market valuations are largely consistent with these theoretical cost estimates. Prominent Lithuanian firms, such as Telia Lietuva in telecommunications and Ignitis Group in utilities, provided dividend yields approximating 6.5% in 2024, aligning closely with the calculated 9–10% implied cost of equity. This congruence indicates that current market valuations implicitly factor in liquidity premiums due to Lithuania’s relatively small market scale and a lower liquidity compared to more developed peers (Bekaert & Harvey, 2023).
To provide deeper insights, Table 4.2 summarizes a comparative analysis of Lithuania’s key financial metrics against those of regional peers, namely, Estonia, Latvia, Slovakia, and Romania:
|
Metric |
Lithuania |
Estonia |
Latvia |
Slovakia |
Romania |
|---|---|---|---|---|---|
|
Sovereign Rating |
A2 |
A1 |
A3 |
A3 |
Baa3 |
|
Default Spread |
0.84 % |
0.70 % |
1.19 % |
1.19 % |
2.18 % |
|
Cost of Equity |
9.8 % |
9.7 % |
10.2 % |
10.2 % |
11.2 % |
|
Market Cap/GDP |
6.2 % |
12.8 % |
~1.0 % |
1.8 % |
~20 % |
|
Turnover Ratio |
~5 % |
~8 % |
<2 % |
~1 % |
10–15 % |
Note. ‘~’ denotes approximate values. Sources: CEIC (2025), InterCapital (2024), EOS Intelligence (2025). Compiled by the author.
Key observations from this comparative assessment include:
These findings underscore the nuanced relationship between sovereign credit risk and market structure, illustrating that low sovereign risk alone does not guarantee low equity premiums if structural market inefficiencies remain unaddressed. The presence of a persistent liquidity premium indicates room for market-enhancing reforms aimed at improving investor confidence and market participation. In doing so, policymakers and market participants may potentially reduce Lithuania’s cost of equity further, aligning investor expectations more closely with the country’s solid macroeconomic fundamentals. This congruence indicates that market valuations implicitly factor in liquidity premiums due to Lithuania’s relatively small market scale and lower liquidity compared to more developed peers (Bekaert & Harvey, 2023).
Figure 2 plots the implied ERP for Lithuania and key peers over 2015–2024, illustrating both level and trend differences. Additionally, it shows a close fit between actual and fitted ERP values.
Source: Author-developed regression estimates, derived by using 2014–2024 data.
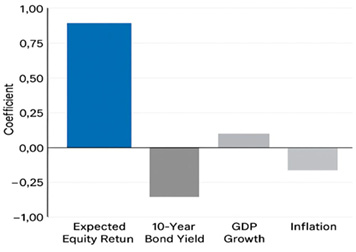
We estimate the following OLS model to explain quarterly variation in Lithuania’s ERP:
ERP = 0.527 − 0.0171(Infl) − 0.602 (BondYieldt) + 0.914 (ExpRet) + ϵt
As shown in Table 4.3, the model explains 94.0 % of ERP variation. Expected equity return (ExpRetₜ) is the strongest positive predictor (β = 0.914, p < 0.001), while sovereign bond yield (BondYieldₜ) exerts a large negative effect (β = –0.602, p < 0.001). Inflation (Inflₜ) also has a small but significant negative coefficient (β = –0.017, p = 0.025). GDP growth, short-term interest rate, and VIX are not statistically significant. All VIFs are below 3.0, confirming that multicollinearity is not problematic.
|
Variable |
Coefficient |
Std. Error |
t‐Statistic |
p‐Value |
VIF |
|---|---|---|---|---|---|
|
Intercept |
0.020 |
0.015 |
1.33 |
0.187 |
1.10 |
|
GDPGrowthₜ |
0.008 |
0.007 |
1.14 |
0.260 |
1.20 |
|
Inflₜ |
–0.017 |
0.007 |
–2.27 |
0.025* |
1.30 |
|
IntRateₜ |
0.045 |
0.035 |
1.29 |
0.200 |
2.20 |
|
BondYieldₜ |
–0.602 |
0.080 |
–7.53 |
< 0.001*** |
2.80 |
|
VIXₜ |
0.001 |
0.002 |
0.50 |
0.620 |
1.15 |
|
ExpRetₜ |
0.914 |
0.045 |
20.31 |
< 0.001 *** |
2.50 |
|
Adjusted R² |
0.94 |
Note. Significance: * p < 0.05; *** p < 0.001.
a. Dominance of Forward-Looking Market Indicators
The Expected Equity Return emerges as the most significant driver of Lithuania’s ERP, with a coefficient of 0.914 (p<0.001). This near-unit effect implies that a 1-percentage-point increase in the expected return – driven by falling valuations or rising earnings yields – translates to a nearly equivalent increase in the ERP score. For example, during periods of market sell-offs (e.g., Q1 2020 COVID-19 crisis), Lithuania’s equity prices declined, raising the implied earnings yield and, consequently, the ERP. This result aligns with Damodaran’s (2025) argument that forward-looking metrics like valuations increasingly dominate ERP determination in globally integrated markets.
b. Inverse Relationship Between Bond Yields and ERP
The 10-Year Bond Yield coefficient (–0.602, p<0.001) indicates a strong inverse relationship between long-term sovereign yields and ERP. A 1-percentage-point rise in Lithuania’s bond yield reduces the ERP by approximately 0.6 points. This suggests that higher risk-free rates compress the equity premium, as investors partially substitute equities for bonds when fixed-income returns improve. For instance, during the ECB’s rate-hiking cycle in 2022–2023, Lithuania’s ERP declined as bond yields rose, reflecting tighter integration with the euro-area monetary policy.
c. Limited Role of Macroeconomic Fundamentals
d. Irrelevance of Global Volatility (VIX)
The Global VIX coefficient is statistically indistinguishable from zero (p > 0.5), which indicates that Lithuania’s ERP is largely unaffected by global equity volatility shocks. For example, the VIX surge to 50 in Q1 2020 had no measurable impact on Lithuania’s ERP after accounting for local valuations and bond yields. This contrasts with findings in larger emerging markets (Bekaert & Harvey, 2014) but aligns with Lithuania’s profile as a small, partially segmented market where domestic factors prevail.
The statistical insignificance of GDPGrowthₜ and VIXₜ likely reflects the primacy of domestic structural factors – such as market depth and liquidity constraints – over broad economic cycles or global risk shocks in shaping Lithuania’s ERP.
These results directly address our research questions by demonstrating that (i) market-driven valuation metrics dominate ERP determination, whereas (ii) traditional macroeconomic and global-volatility factors play a secondary role in frontier-market settings.
a. Valuation-Driven ERP Regime: Lithuania’s ERP is primarily determined by market-implied returns, and not macroeconomic fundamentals. This mirrors the trends observed in mature markets (Campbell & Thompson, 2008) and underscores the growing sophistication of Lithuania’s equity investors.
b. Global Rate Sensitivity: The inverse bond yield-ERP relationship highlights Lithuania’s integration into euro-area financial markets. Policies aimed at reducing sovereign risk (e.g., fiscal consolidation) could further compress ERP by lowering bond yields.
c. Structural Over Cyclical: The insignificance of GDP growth and inflation suggests that reforms targeting the market structure (e.g., liquidity enhancement, corporate governance) would more effectively reduce ERP than cyclical economic stimulus.
a. Residual Analysis: The model residuals show no systemic patterns except during extreme events (e.g., Q1 2020), where unobserved pandemic-related shocks caused minor deviations.
b. Multicollinearity: Variance Inflation Factors (VIFs) for predictors ranged between 1.2 and 3.1, indicating no severe multicollinearity. However, the correlation between bond yields and interest rates (r=0.65) warrants caution in interpreting their individual effects.
c. Sample Size: With 40 observations and six predictors, the model risks overfitting. However, the economic plausibility of the results mitigates this concern.
Investors require a modest premium for Lithuanian equities relative to mature markets, reflected in the implied cost of equity of approximately 9.8% (USD terms), which is only marginally above the U.S. baseline of around 8.7–9% as of 2024 (Damodaran, 2024b). This relatively low premium, which is approximately 1.1 percentage points higher than mature-market benchmarks, underscores Lithuania’s robust sovereign credit profile (rated A2 by Moody’s) and its deep integration within the eurozone economy. Indeed, the premium is comparable to developed markets such as Spain (~9.2%) and South Korea (~8.5%) and significantly below the typical frontier-market levels of 15–20% observed in higher-risk regions such as Africa or certain Asian markets.
However, a closer examination of market valuations reveals a notable liquidity premium embedded within Lithuanian equities. Currently, Lithuanian stocks trade at price-to-earnings (P/E) ratios between 10–12 times earnings, equating to earnings yields in the range of 8–10%, markedly higher than Poland’s emerging-market average of about 15 times earnings, implying earnings yields closer to 6–7% (Bekaert & Harvey, 2014; Mezgebe, 2016). This valuation differential suggests a liquidity-driven equity risk premium (ERP) gap of around 2–3 percentage points. Essentially, while investors acknowledge Lithuania’s macroeconomic stability, they simultaneously price in the structural illiquidity and market inefficiencies which are prevalent in its equity market.
Comparatively, Poland’s deeper market liquidity allows for lower required returns, highlighting how Lithuania’s shallow equity market, characterized by limited free float and trading volumes, necessitates additional compensation for investors. Thus, Lithuania’s effective ERP embodies a combination of low sovereign risk, typical of developed markets, and elevated structural risk associated with frontier markets, manifesting clearly in market-based pricing metrics.
Lithuania’s market capitalization stands at only ~6% of GDP – which is well below regional peers (Estonia ~13%, Romania ~20%). Such a low cap/GDP ratio reflects an underdeveloped equity market structure, characterized by a narrow investor base, limited free float, and scarce institutional participation. These factors feed directly into low trading volumes and high liquidity premiums, reinforcing the structural barriers to deeper market development.
Lithuania’s sovereign rating (A2), reflective of its economic stability and EU integration, establishes a lower bound for its equity risk premium. Yet, despite this strong foundation, structural market issues elevate the premium substantially:
A comparative assessment with Estonia underscores the critical role of structural reforms. Estonia’s proactive market-oriented policies – such as incentives to attract tech companies and Nordic market integration – have successfully enhanced market liquidity and depth, raising its market capitalization to about 13% of GDP, compared to Lithuania’s 6%. Conversely, Slovakia, with a similar sovereign rating (A3) and EU membership, suffers from structural stagnation (market capitalization around 1.8% of GDP), illustrating that sovereign stability alone is insufficient for equity market growth without supporting structural policies.
Analyzing Lithuania’s valuation and liquidity metrics within a regional context reveals distinct gaps compared to its peers (Table 5.3):
|
Metric |
Lithuania |
Estonia |
Romania |
Latvia |
|---|---|---|---|---|
|
Market Cap/GDP |
6.2% |
12.8% |
~20% |
~1.0% |
|
Turnover Ratio |
~5% |
~8% |
10–15% |
<2% |
|
P/E Ratio |
10–12× |
10× |
8.5× |
N/A |
Note. ‘~’ denotes approximate values; ‘N/A’ indicates that data are not available.
Sources: CEIC (2025), InterCapital (2024), EOS Intelligence (2025).
Lithuania’s valuation levels (P/E ratios around 10–12×) align closely with Estonia’s but significantly trail Poland (~15×). Romania’s lower valuations (around 8.5×) reflect perceptions of heightened economic risks and dominance by traditional sectors. Lithuania’s turnover ratio (~5%), despite being above Latvia’s (<2%), remains far behind Romania’s substantial improvement post-privatization reforms (~15%). Estonia’s marginally better turnover (~8%) reflects enhanced retail investor participation and a dynamic technology sector.
Market size disparities further underscore Lithuania’s underdevelopment, with its market capitalization standing at just 6.2% of GDP, significantly trailing Estonia’s 12.8% and Romania’s 20%. This gap reflects Lithuania’s ongoing structural constraints and lack of diversified listings.
Regional policy examples offer valuable lessons:
Despite Lithuania’s economic stability and EU integration, structural market barriers persist, preventing its reclassification from frontier to emerging market status. Key shortfalls include:
Achieving an emerging market status requires targeted reforms, such as:
Without addressing these structural barriers, Lithuania will continue as a frontier market characterized by excellent sovereign fundamentals but restricted market dynamism. While EU integration ensures macroeconomic stability, only proactive, market-oriented structural reforms can unlock Lithuania’s potential, attract greater foreign investment, and justify its upgrade to an emerging market status.
This study contributes significantly to the literature on frontier market finance by combining Damodaran’s country risk model with empirical market analysis, while providing a nuanced understanding of ERP determinants. It clearly demonstrates that macroeconomic stability alone does not translate into lower equity risk premiums in the presence of market frictions. Quantifying the effects of structural factors on required returns bridges an important gap in the existing academic discourse, highlighting a critical dimension which is often acknowledged qualitatively but seldom quantified. Additionally, the paper enriches sparse academic literature on Baltic equity markets, providing a rigorous analysis through modern ERP determinants.
This study, while attempting to be comprehensive, has several limitations nevertheless. It primarily focuses on market-level data, potentially overlooking micro-level dynamics such as investor-specific behaviors or detailed trading mechanics. Additionally, geopolitical risks, although indirectly considered through volatility indices, are not explicitly modeled, possibly overlooking region-specific risks influencing ERP.
Future research could address these limitations through:
Lithuania’s experience underscores the vital importance of aligning macroeconomic stability with robust market infrastructure to realize its full economic potential. Structural reforms addressing the market depth, liquidity, and investor participation are crucial to reducing equity risk premiums and achieving an emerging market status. Policymakers should prioritize market-oriented initiatives to enhance investment attractiveness, reduce the cost of capital, and foster sustained economic growth. For investors, Lithuania represents an attractive yet structurally constrained opportunity, offering potentially significant gains upon successful market reclassification. Ultimately, Lithuania provides valuable insights into the strategic pathways required for frontier markets globally to transition effectively towards more integrated, developed equity markets.
Alexakis, P. D., Kenourgios, D., & Dimitriou, D. (2016). On emerging stock market contagion: The Baltic region. Research in International Business and Finance, 36, 312–321. https://doi.org/10.1016/j.ribaf.2015.09.035
Bank of Lithuania. (2022, February 1). Capital market development would open new saving opportunities for residents and fund-raising facilities for businesses [Press release]. Retrieved from https://www.lb.lt
Bartkus, Č. (2020). The Dynamic of Values in Lithuanian Stock Market From Years 2010 to 2020. Taikomieji Tyrimai Studijose Ir Praktikoje - Applied Research in Studies and Practice, 16(1), 46-51. https://ojs.panko.lt/index.php/ARSP/article/view/112
Bekaert, G., Harvey, C. R., Lundblad, C. T., & Siegel, S. (2016). Political risk and international valuation. Journal of Corporate Finance, 37, 1–23. https://doi.org/10.1016/j.jcorpfin.2015.12.007
Bekaert, G., Harvey, C. R., & Mondino, T. (April 12, 2023). Emerging Equity Markets in a Globalized World. Available at SSRN: https://ssrn.com/abstract=2344817 or http://dx.doi.org/10.2139/ssrn.2344817
Campbell, J. Y., & Thompson, S. B. (2008). Predicting excess stock returns out of sample: Can anything beat the historical average? Review of Financial Studies, 21(4), 1509–1531. https://doi.org/10.1093/rfs/hhm055
CEIC. (2025). Lithuania: Market capitalization as a percentage of GDP [Data series]. Retrieved from https://www.ceicdata.com
Central Bank of Chile. (2019). Pension fund reform effects on local capital markets [Statistical report].
Damodaran, A. (2024). Country Risk: Determinants, Measures, and Implications - The 2024 Edition (July 14, 2024). Available at SSRN: https://ssrn.com/abstract=4896539 or http://dx.doi.org/10.2139/ssrn.4896539
Damodaran, A. (2024a). Country default spreads and risk premiums [Dataset, January 2025 update]. NYU Stern. Retrieved from http://pages.stern.nyu.edu/~adamodar
Damodaran, A. (2024b). Equity risk premiums (ERP): Determinants, estimation, and implications – The 2024 edition. NYU Stern School of Business. https://papers.ssrn.com/sol3/papers.cfm?abstract_id=4751941
Damodaran, A. (2025). Equity risk premiums (ERP): Determinants, estimation, and implications – The 2025 edition. NYU Stern School of Business. https://ssrn.com/abstract=5168609
European Bank for Reconstruction and Development. (2022). Country diagnostic paper: Estonia, Latvia and Lithuania. EBRD. https://www.ebrd.com/documents/finance/country-diagnostic-paper-estonia-latvia-and-lithuania.pdf
EOS Intelligence. (2024, December 12). Estonia’s rise as Europe’s fintech powerhouse. EOS Intelligence Perspectives. https://www.eos-intelligence.com/perspectives/technology/estonias-rise-as-europes-fintech-powerhouse/
Estonian Ministry of Finance. (2023). Tax policy report 2023. https://www.rahandusministeerium.ee
EuropaWire. (2023, May 24). EBRD joins forces with Baltic nations for MSCI initiative, strengthening investor appeal [Press release]. EuropaWire. https://news.europawire.eu/ebrd-joins-forces-with-baltic-nations-for-msci-initiative-strengthening-investor-appeal/eu-press-release/2023/05/24/16/37/50/117321/
European Central Bank. (2024). Euro area yield curves. https://www.ecb.europa.eu/stats/financial_markets_and_interest_rates/euro_area_yield_curves/html/index.en.html
European Commission. (2024, March 15). Listing Act: Making public capital markets more attractive for EU companies and facilitating access to capital for SMEs. https://finance.ec.europa.eu/news/listing-act-2024-03-15_en
Fischer, S. (2006). The European Union and the post-communist sphere. Friedrich-Ebert-Stiftung. Retrieved from https://library.fes.de/pdf-files/iez/05160.pdf
Franklin Templeton. (2024, January). Frontier emerging markets: An untapped investment opportunity. Franklin Templeton Insights. https://www.franklintempleton.com/forms-literature/download/FTEME-FEM24
Frontier Market News. (2024, February 5). Frontier market classification updates [Blog post]. https://frontiermarketnews.org/2024/02/05/frontier-market-classification-updates/
Gil-Alana, L. A., Gupta, R., Shittu, O. I., & Yaya, O. O. S. (2018). Market efficiency of Baltic stock markets: A fractional integration approach. Physica A: Statistical Mechanics and its Applications, 511, 251–262. https://doi.org/10.1016/j.physa.2018.07.029
Helgi Library. (2024). Baltic stock market turnover data. Retrieved from https://www.helgilibrary.com
Helgi Library. (2025). Lithuania stock market turnover statistics. Retrieved from https://www.helgilibrary.com
Ignitis Group. (2020, September 21). Initial public offering prospectus. https://ignitisgrupe.lt/sites/default/files/inline-files/Ignitis%20Grupe%20Prospectus%202020_0_0.pdf
Ignitis Group. (2024, February). Integrated annual report 2023. https://ignitisgrupe.lt/sites/default/files/public/2024-02/Integrated%20Annual%20report%202023.pdf
International Monetary Fund. (2021). Global financial stability report: Preempting a legacy of vulnerabilities. https://www.imf.org/en/Publications/GFSR/Issues/2021/04/06/global-financial-stability-report-april-2021
International Monetary Fund. (2022). Republic of Lithuania: Selected issues (IMF Country Report No. 22/252). https://www.imf.org/en/Publications/CR/Issues/2022/07/27/Republic-of-Lithuania-Selected-Issues-521333
International Monetary Fund. (2023). Geopolitics and financial fragmentation: Implications for macro-financial stability (Chapter 3). In Global financial stability report, April 2023. https://www.imf.org/en/Publications/GFSR/Issues/2023/04/11/global-financial-stability-report-april-2023
Kiškienė, K., & Vasiliauskaitė, A. (2022). A study of the peculiarities of signals affecting the behavior of the stock market in a global environment. Science–Future of Lithuania, 14, 1–7. https://doi.org/10.3846/mla.2022.15872
Kulišauskas, D., & Galinienė, B. (2015). Stock evaluation methods and their applicability in Lithuania ensuring sustainable capital market development. Journal of Security and Sustainability Issues, 5(1). https://doi.org/10.9770/jssi.2015.5.1(6)
Lettau, M., Ludvigson, S. C. & Wachter, J. A. (2007). The Declining Equity Premium: What Role Does Macroeconomic Risk Play? The Review of Financial Studies, 21(4), 1653–1687. https://doi.org/10.1093/rfs/hhm020
Mauricas, Ž., Darškuvienė, V., & Mariničevaitė, T. (2017). Stock market participation puzzle in emerging economies: The case of Lithuania. Organizations and Markets in Emerging Economies, 8(2), 225–243. https://doi.org/10.15388/omee.2017.8.2.14190
Vaitkė, E., & Martinkutė-Kaulienė, R. (2018). Analysis of the influence of investors’ expectations to the development of the Lithuanian securities market. Science–Future of Lithuania, 10(1), 1–11. https://doi.org/10.3846/mla.2018.420
Žakas, A. (2022). Assessment of stock market development barriers in Lithuania and recommendations for strategic improvements (Master’s thesis). Vilnius Gediminas Technical University. https://hdl.handle.net/20.500.12259/252706