Ekonomika ISSN 1392-1258 eISSN 2424-6166
2026, vol. 105(2), pp. 63–83 DOI: https://doi.org/10.15388/Ekon.2026.105.2.4
Maurizio Pompella
School of Economics and Management, University of Siena
ORCiD: https://orcid.org/0000-0003-1747-2832
E-mail: pompella@unisi.it
website of University of Siena: https://www.unisi.it
Nicos Scordis
Peter J. Tobin College of Business, St. John’s University, New York
ORCiD: https://orcid.org/0000-0002-6964-8118
E-mail: scordisn@stjohns.edu
website of St. John’s University: https://www.stjohns.edu
Abstract. Objective: The aim of this paper is to explore the financial and strategic implications of decarbonization from a business risk perspective. Starting from risk theory, insurance economics, and transition finance, we conceptualize decarbonization not as a linear optimization process, but as a wicked problem. We argue that firms face both tame and wild risks, and that transition risk occupies a hybrid position that challenges conventional insurance as well as capital market arrangements.
Methods: To empirically assess whether these theoretical dynamics are explicit in corporate behavior, we focus on the automotive industry, which is most exposed to decarbonization pressures. By using ESG data (14 profile scores) and GHG emissions (Scope 1, 2, 3 – absolute and intensity-adjusted), we analyse eight global multinational companies from the automotive sector, from 2017 to 2023. We build a novel ESG-GHG Decoupling Index (DI), capturing the divergence between sustainability disclosure and emission performance.
Results: Our findings highlight significant misalignments in some firms, suggesting reputational risk, strategic inconsistency, or greenwashing. We complement this with a Mahalanobis distance-based clustering, revealing instead patterns of convergence and divergence in emissions strategy.
Conclusions: We conclude that ESG improvements alone are not sufficient indicators of true environmental transition, and argue for a multidimensional, risk-based framework to assess corporate decarbonization efforts.
Keywords: decarbonization, cost of risk, tame and wild risks, Mahalanobis clustering, ESG-GHG decoupling index.
_________
Received: 04/10/2025. Accepted: 16/03/2026
Copyright © 2026 Maurizio Pompella, Nicos Scordis. Published by Vilnius University Press
This is an Open Access article distributed under the terms of the Creative Commons Attribution License, which permits unrestricted use, distribution, and reproduction in any medium, provided the original author and source are credited.
This paper examines whether ESG scores available for companies are reliable indicators of companies’ efforts to decarbonize. We hypothesize that ESG scores are unlikely to effectively capture real progress toward carbon neutrality because, as we argue, decarbonization constitutes a wicked problem, and, as such, the path to decarbonization is difficult to optimize. We illustrate our argument with an analysis of the ESG scores of eight major automobile manufacturers in relation to their carbon emissions.
After framing the nature of carbon risk and explaining why we consider decarbonization a wicked problem, we relate decarbonization to the cost-of-risk concept with the objective to show the implied costs of decarbonization that cannot be captured by a company’s ESG disclosures. We explain the cost of risk dynamics by drawing on insurance-based literature on catastrophic risk and complex challenges. We then offer a broad review of the empirical literature on how markets react to the uncertainty associated with carbon risk. Carbon risk is an emerging risk, and mitigating this risk involves a significant, developing, and ultimately unknowable transition cost. We discuss risk financing strategies that distinguish between tame and wild risks as a way to further illustrate the difficulty a company faces in quantifying the cost of mitigating carbon risk. As part of our discussion, we speculate whether the global insurance industry may play a role in shaping the decarbonization process, potentially influencing corporate strategies through the pricing of insurance policies, or coverage exclusions in those policies.
While the literature supports defining the perils associated with decarbonization as either risk or uncertainty, Hofmann and Scordis (2018) argue that distinguishing between risk and uncertainty leads to better practical decisions. For example, Friberg (2015) explains that a firm can fully insure/hedge risk while it can only partially address uncertainty through operational flexibility. Decarbonization presents both risk and uncertainty, and it itself is a wicked problem. Proposed solutions to wicked problems resist optimization and thus can only be judged relative to each other as ‘better’ or ‘worse’. Actions taken to solve wicked problems are often not feasible to reverse, even if hindsight proves them worse than alternative actions.
A wicked problem, according to Rittel and Webber (1973), who coined the term, is intractable. Achieving decarbonization, like achieving sustainability, requires successfully solving a series of challenges in the realization that, as soon as we meet one challenge, the environment will have shifted to produce additional challenges. The arguments of Wals and Schwarzin (2012) on sustainability apply well to decarbonization: the pursuit of decarbonization is characterized by uncertainty, indeterminacy, controversy, complexity, and bias. Our understanding of them is incomplete, contradictory, and evolving. Focusing on German energy transition, and starting from the Rittel and Webber theoretical framework, Biehl et al. (2023) find that the transition is not inherently wicked, but “wickedness unfolds through the social setting into which technical solutions of the energy transition are embedded”. On the other hand, Schwab and Diaz (2023) highlight how the energy transition is a complex, ambiguous and uncertain issue, and resembles a ‘wicked problem’. By the same token, and more recently, Seitter (2024) shows how complex the green transition issue is, falling into the class of wicked problems, thus emphasizing that recognizing the complexity is a necessary step.
From the company’s perspective, we can make concrete the abstraction of decarbonization with the aid of the so-called ‘Cost of Risk’ (CoR) concept. At its core, the CoR represents the direct and indirect, financial and non-financial costs a company incurs to manage or mitigate the unwanted risks it faces. To the CoR, we append the cost of Transition Risk (TR) to explicitly account for the uncertainty associated with successfully completing the process of decarbonization. Just like any other cost, the costs associated with transition risk also impact the enterprise value. How companies disclose and communicate their pollution levels and initiatives taken to reduce emissions to their external stakeholders is a subject of extensive literature. Readers can see, for example, Pompella and Costantino (2022).
Decarbonization changes the landscape for both companies and investors, forcing them to face new costs and, consequently, lower returns. This shift occurs within a constantly evolving context, by presenting new challenges (as previously noted). A common method for managing tame pure risks is to map exposures on a severity–probability grid (risk matrix), with severity (S) on the x-axis and probability (P) on the y-axis; by contrast, wild risks tend to exhibit power-law loss profiles in which extreme outcomes do not meaningfully ‘average out’.
Thus, one way to view traditional insurance is as a hedge against a non-tradable risk that a policyholder faces. For non-catastrophic perils associated with excess carbon (climate and carbon transition risks), especially when such perils occur with regularity, insurance-linked options are particularly useful.
Traditional insurance policies are efficient instruments for financing tame risk. The single triggers of traditional insurance policies are straightforward. For example, if flooding damages a warehouse, the policy pays. An innovation to accommodate wild risk is that of a dual-trigger where an insurance policy pays only if two separate events occur. Since two independent events must occur both for the consumer to receive payment, the price associated with coverage under a dual-trigger arrangement is lower. This lower price is especially attractive to the consumer given the potential of high claims.
Insurance-Linked Securities (ILS) are an additional and popular way to finance wild risks. Due to the procyclical nature of the unavailability of insurance for catastrophic (CAT) risks, such as covering significant natural or man-made loss events, through traditional coverage channels, companies, insurers, and especially reinsurers turned to the capital market to increase the capacity for financing CAT risk.
Catastrophe bonds (or CAT bonds for short) are the dominant type of ILS. They are corporate bonds whose payment is inversely linked either directly or indirectly to the intensity of a natural event such as a hailstorm, a hurricane, or an earthquake. The more intense is the event, the lower is the bond’s repayment. Bonds are also linked to other events, such as forest fires, floods, mortality, longevity, and mortgages. Advances in data science, sensor technology, and simulation modeling are encouraging innovation in CAT bond triggers.
Let us consider the issue of fair pricing in terms of ‘sustainability/decarbonization pricing’ under the assumption that insurers are marshalled in a role complementing the role of governments in enforcing/promoting sustainability/decarbonization. Should – then – insurers increase prices and discriminate or penalize consumers according to their lack of ‘compliance’? If yes, is it fair to penalize consumers even if they cannot afford the costs of sustainability/decarbonization? If not, then how does a society allocate such costs? Different societies have different approaches to answering this question.
Since insurers effectively manipulate both the price for coverage and the cost of that coverage, the seminal analysis of Rothschild and Stiglitz (1976) shows that, in insurance markets, only a separating equilibrium is possible. There are multiple price-quantity combinations. The separating equilibrium develops because insurers limit the amount of coverage consumers can buy at a given price and require a different price for different amounts of coverage. Effectively, insurers manipulate their costs, which allows them to profitably undercut each other as they compete for consumers. Eventually, the market fragments and unravels. The ongoing research by Sastry et al. (2024) and Boomhower et al. (2024) on the market for home insurance from natural disasters supports the prediction of market unraveling. These studies document insurers withdrawing from the market and a striking variation in the price-quality of available insurance.
Rothschild and Stiglitz imply that additional market restrictions must accompany solidarity pricing. Unlike Rothschild and Stiglitz, who do not impose market restrictions, Chatterjee et al. (2021) assume a universal insurance contract under solidarity pricing. They show that, under such restrictions, a pooled equilibrium does emerge. This pooled equilibrium, however, is stable only if consumers have inelastic demand.
Charpentier et al. (2022) provide an economic analysis of the catastrophe insurance scheme in France. They explain that this regime offers broad coverage for all for a flat price, which reflects the solidarity principle, and at its inception, it was “<…> perceived as fair”. Also, they find that the market prices for properties in flood-prone areas adjust to reflect their exposure to flooding, which, combined with the fact that the less affluent population tends to occupy these less-desirable properties out of necessity, the scheme’s “<…> flat premium means a subsidy given by other segments to the wealthier population”.
While risk mapping is often practiced, there are caveats to its effective use. Mapping transition risk imposes additional limitations on risk mapping. Transition risk is not a risk in the strict sense, and, as such, it is ill-suited for charting on the risk graph, except perhaps as a ‘wicked problem’, located near the top right region of the map S/P. It shares with CAT risks the uncertainty, indeterminacy, controversy, and complexity.
According to analyses from sources such as Welton (2020), Penasco et al. (2021), and Nikolaeva (2024), the process of decarbonization involves implementing and enforcing sweeping policies, deploying new technologies, and addressing social and economic dislocation. And the process needs to unfold evenly across a fragmented global society. Ghosh and Gupta (2022) find that, for businesses, the financial benefits from decarbonization are vague and in the future, while its financial costs are definite and immediate. Carbon peril causes both more intense events (in terms of frequency and severity) as well as slow onset events (Nordlander et al., 2020). However, it is challenging to establish the true empirical link, if any, between a firm’s carbon emissions and its financial performance.
Yet, Bolton and Kacperczyk (2021) find a positive relation between stock return and a firm’s carbon emission intensity (which alternatively implies a lower price for the stock of high-carbon emitters). However, Aswani et al. (2024) find that stock returns are only correlated with the unscaled emissions estimated by data vendors and not with the unscaled emissions actually disclosed by firms.
Financial markets, in order to function effectively, rely on investors having access to low-cost, timely, and accurate information. When it comes to information on decarbonization, investors face asymmetric information due to the problematic nature of disclosure and reporting. The convergence among the existing indices is low, which makes it challenging for investors since the choice of an index can influence investment decisions. Nonetheless, the low degree of convergence among these metrics (Eccles & Stroehle, 2018; Widyawati, 2020) significantly impacts reliability and comparability. Additionally, more recently, Pompella and Costantino (2023) highlight how ESG ratings and rankings are influenced by a lack of disclosure. This concern also finds empirical support in a paper by Şeker and Şengür (2021), who show how ESG performance often affects financial reporting quality more than it reflects genuine environmental progress. And still, concerning the market investment decisions and the investors’ sentiment, Atasel et al. (2020) show that environmental disclosure can impact negatively on the cost of equity, while positively affecting firm value, thereby reinforcing the idea that the market rewards perceived sustainability.
Actually, Aswani et al. (2024) note that multicollinearity may explain why Bolton and Kacperczyk (2021), who use emission data from one such vendor, find a relation between emissions and returns when controlling for size but do not find a univariate relation between emissions and returns. Furthermore, Aswani et al. (2024) show that the positive relation between emission intensity and stock return in Bolton and Kacperczyk (2021) is only significant for the specific industry classification system used from Trucost (a vendor of firm emissions data).
There are also conflicting results of Huynh and Xia (2021) and Duan et al. (2023). Huynh and Xia (2021) construct an index of climate change news as a proxy for climate risk. By using this proxy, they find that when society’s concern about climate risk is elevated, the bonds of firms with stronger environmental performance have lower returns (which alternatively implies a higher price for the firm’s bonds). However, Duan et al. (2023), by using emissions data from Trucost, find that it is the bonds of firms with higher carbon emission intensity (and thus an implied weak environmental performance) that have lower returns. Then, there is a paper by Li et al. (2024) which uses a firm’s climate-related disclosures during its quarterly calls with analysts as a proxy for the firm’s proactiveness in addressing climate risk. They find that the less proactive firms have a lower Tobin’s Q than the more proactive firms. Li et al. (2024) interpret Tobin’s Q (the ratio of a firm’s market value of assets to the replacement cost of assets) as a proxy for the firm’s value. While this interpretation is popular, literature has also used the concept of Tobin’s Q to represent a firm’s market power, growth potential, or current profitability. See, for example, Lindenberg and Ross (1981), Lang et al. (1996), as well as Wernerfelt and Montgomery (1988).
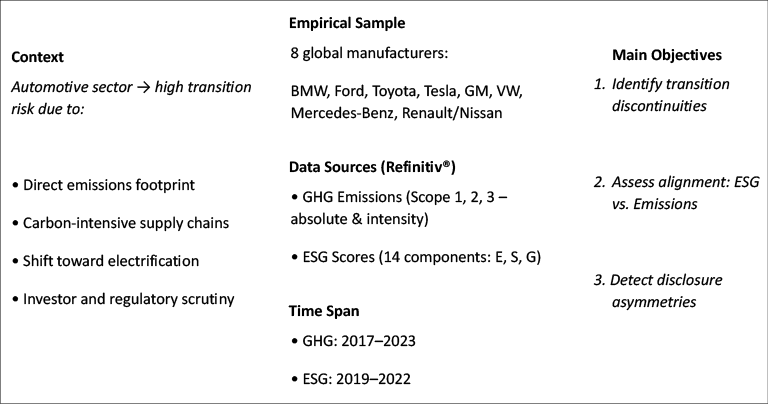
As Figure 1 illustrates, we examine eight major global automotive manufacturers. These firms vary in geographic location, product mix, technological strategy, and degree of vertical integration, thereby offering a solid heterogeneous panel for comparison1. These eight firms represent the population of multinational manufacturers with complete and comparable GHG and ESG disclosures throughout the study period. Our selection of these companies operationalizes the theoretical framing of decarbonization as a business risk by analyzing the alignment between environmental performance and sustainability signaling in eight global automotive companies, which is our sample, from 2017 to 2023. The time interval for the analysis is: 2017 to 2023 for GHG emissions data (7 years), and 2019 to 2022 for ESG component scores (4 years), due to limitations stemming from data availability and coverage consistency across all firms2.
These data allow us to investigate whether the theoretical dynamics of decarbonization as a business risk do correspond to the actual corporate behavior. The automotive industry is particularly exposed to transition risk due to its direct emissions footprint, dependence on carbon-intensive supply chains, and the rapid technological shift toward electric cars.
The empirical sample consists of eight major global automotive manufacturers: BMW, Ford, Toyota, Tesla, General Motors, Volkswagen, Mercedes-Benz, and Renault-Nissan. Two distinct but complementary data sources are used, both extracted from Refinitiv® Workspace (LSEG):
a) GHG Emissions: Scope 1 (direct emissions), Scope 2 (purchased energy), and Scope 3 (value chain emissions), reported both in absolute terms and relative intensity3. These figures allow us to track not only the total environmental footprint but also changes in the operational efficiency and the supply chain impact.
b) ESG Scores: A 14-dimensional profile of ESG indicators, which we denote as ESG14, as a way to highlight the multidimensional profile of these ESG scores. The construction of these scores covers specific environmental, social, and governance components. This detailed structure permits a more in-depth assessment of sustainability commitment than aggregate ESG ratings.
The empirical investigation develops according to three main objectives, by which, we seek to:
1. Identify transition discontinuities,
2. Assess alignment between ESG commitment and emission reduction, and
3. Detect asymmetries in disclosure behavior.
To ensure the robustness and comparability of firm-level emissions assessments in the automotive industry, this analysis focuses on Scope 1 and Scope 2 greenhouse gas emissions. These two scopes capture, respectively, direct emissions from owned or controlled sources, and indirect emissions from the generation of purchased energy.
By contrast, Scope 3 emissions, though significant in their absolute magnitude, are treated more prudently in this study, because of their structural dependence on downstream usage.
Scope 3 is highly heterogeneous across firms and less suitable for direct cross-company comparison.
For this reason, Scope 3 emissions are primarily reported for completeness, but the core of the empirical evaluation, particularly the ‘decoupling analysis’ which follows is based on the more operationally controlled and comparable Scope 1 and Scope 2 dimensions.
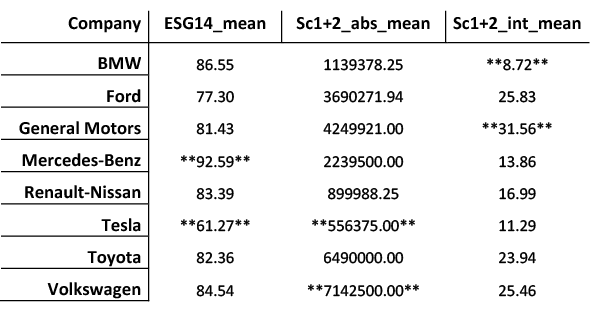
The above-presented Table 1 reports the average ESG14 score and Scope 1+2 emissions (absolute and intensity-based) for each company between 2019 and 2022. The highlighted values show the highest and lowest performers across these metrics.
Notably, Mercedes-Benz displays the highest average ESG14 score, while maintaining a moderately low emissions intensity, which suggests a fairly consistent sustainability performance. BMW achieves the highest carbon efficiency (lowest emissions per revenue), whereas Tesla stands out for the lowest absolute emissions, despite having the lowest ESG score.
In contrast, Volkswagen records the highest total emissions, and General Motors shows the worst emissions efficiency.
These contrasts, once more, underscore the relevance of the Decoupling Index introduced further in the paper to assess transition alignment across firms.
Figure 2 presents a three-dimensional visualization of greenhouse gas emission trajectories across Scope 1, 2, and 3 for the eight automotive manufacturers over the seven-year period from 2017 to 2023. Each data point represents a company-year observation positioned in the 3D emission space, with balloon sizes being proportional to Scope 1 emissions, i.e., larger balloons reflect greater operational emissions and thus higher exposure to transition risk through carbon-intensive production processes. Spline lines connect each company’s annual observations to illustrate the evolution of their emission profiles over time, thus enabling visual identification of structural patterns, strategic clustering, and the impact of external disruptions such as the COVID-19 pandemic, on emissions trajectories. Figure 2 reveals striking divergence in emission trajectories. Four meaningful patterns emerge from this visualization.
Some divergent emissions profiles quickly emerge. For example, Toyota and Volkswagen maintain persistently high Scope 3 emissions, reflecting the dominance of internal combustion vehicles in their product mix. Their trajectories evolve with relatively minor reductions across all scopes, suggesting slow operational decarbonization, despite visible ESG engagement.
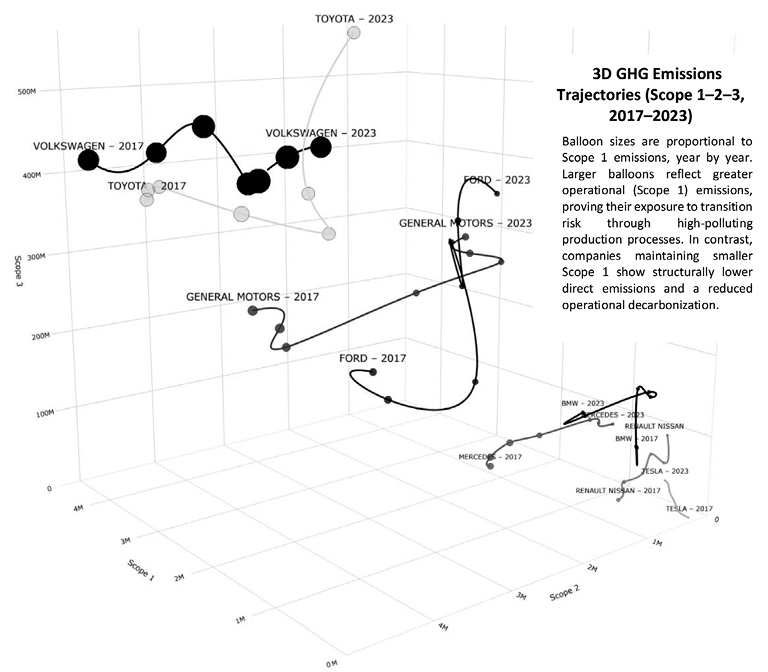
On the other hand, General Motors and Ford show larger structural shifts, especially in Scope 2 and Scope 3, which may reflect both production process adjustments and methodological changes in estimation.
Also, some low-emissions firms are clustered at the bottom of the graph: Tesla, BMW, Mercedes-Benz, and Renault-Nissan form a relatively tight cluster in the lower-emission zone, particularly according to Scope 1 and 2 dimensions. This suggests either more electrified operations or smaller industrial footprints. However, the absolute levels for these companies may reflect a lower overall output volume as much as efficiency.
As far as COVID-19 disruption effects, on the other hand, a visible dip in emissions around 2020 is observed for several firms, again, especially in Scope 1 and Scope 2. This aligns with the global production slowdown and the reduced industrial activity caused by the pandemic. While significant, these drops appear transitory, with emissions rebounding in 2021 or 2022 in most cases. As such, they do not indicate structural change but rather an external shock. Scope 3 emissions, on the other hand, display inconsistent sensitivity to the pandemic, reinforcing their dependence on estimation models, as mentioned, rather than real-time operational data.
Some firms exhibit nonlinear trajectories, with sharp inflection points (e.g., Ford post-2020 or Renault-Nissan in Scope 2). These may indicate methodological changes, production restructuring, or shifts in disclosure practices.
Finally, if we look at the GHG intensity compared to absolute emissions, the large balloon sizes for Toyota, Volkswagen, and General Motors reflect high Scope 1 emissions, reinforcing their exposure to operational transition risk, cost, and, in general, the needed related efforts. In contrast, Tesla and BMW maintain relatively low Scope 1 levels across the period.
This visual mapping allows us to qualitatively assess the alignment between corporate emissions and ‘decarbonization narratives’.
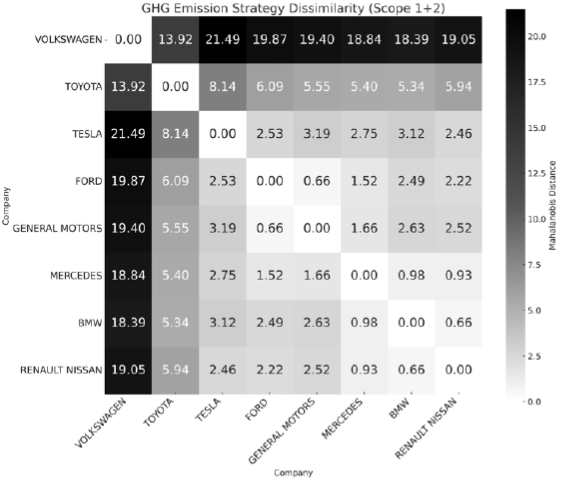
To evaluate convergence and divergence in emissions strategies, we computed Mahalanobis distances between companies based on their average Scope 1 and Scope 2 emissions from 2017 to 20234. This approach isolates operationally controlled emissions and removes distortions mostly caused by downstream-use estimates (Scope 3). The resulting dissimilarity matrix (Table 2) captures how similar or divergent firms are in terms of core production-related emissions, accounting for the correlation structure across scopes.
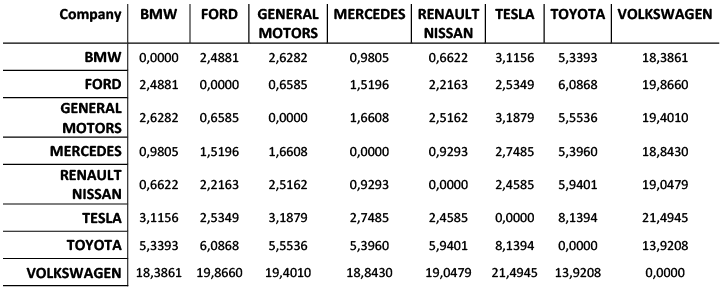
The grey scale ordered chromatography (in Figure 3) marks clear similarities (light grey zones) and divergences (dark ones). The Volkswagen peculiarity is explicit and evident.
To further test the alignment between corporate sustainability commitments and effective decarbonization, we develop the promised additional metric: the ESG – GHG Decoupling Index (DIdx).
A simple Decoupling Index captures the divergence between the percentage change in sustainability signaling and the percentage change in GHG emissions. Formally:
DIdx = %ΔESG−%ΔGHG (1)
where the notation %Δ indicates percent change.
Intuitively, a positive value indicates that ESG scores have improved more than emissions have increased (or that emissions have decreased more than ESG deteriorated), which implies a favourable or coherent sustainability trajectory. A negative value suggests the opposite: ESG scores are improving but emissions (worsening) are increasing more than the ESG score.
This index is designed to help unveiling potential discrepancies between a firm’s publicly disclosed ESG trajectory and its operational emissions performance. In our specific case, it measures the difference between the percentage change in a company’s ESG score and the percentage change in its greenhouse gas emissions over a common time horizon (2019–2022). By the way, greenwashing (whether it was the result of a strategy or just empirically documented) is not mechanically tied to the sign of the Decoupling Index. It arises when there is a fundamental disconnect between the narrative and the impact, regardless of whether the index is positive or negative. A positive Decoupling Index does not necessarily imply genuine progress. If ESG improvements are exaggerated, based on selective disclosure, inflated ratings, or underreported emissions, the index may reflect apparent alignment that conceals environmental inertia. In such cases, greenwashing can occur even when the Decoupling Index is positive.
Conversely, a negative Decoupling Index – where emissions rise faster than ESG scores improve – does not (probably) imply reputational manipulation. It may reflect transparent or effective reporting, realistic operational constraints, or a firm’s early-stage transition efforts. In these cases, the firm may be, let us say, honest about its challenges, even if the Decoupling Index is negative.
This provides a ‘first-order’ metric for quantifying divergence. It is of importance to note, however, a key interpretative limitation of this index: a single numerical value can stem from different underlying realities. For instance, a positive DIdx could signal a company that is genuinely reducing emissions or one that is simply improving its ESG parameters faster than its emissions are rising.
Using absolute values is useful to measure distance, but it loses direction. As a matter of fact, it would measure only the magnitude of the decoupling, and not the direction. Keeping the sign preserves the direction and allows meaningful interpretation instead, but it requires a conditional reading of the ESG and GHG trend. Thus, by preserving the sign of the DIdx, we can interpret the four possibilities conditionally since the DIdx indicates whether there is alignment or misalignment between the two factors. Positive decoupling occurs when ESG improvements exceed emissions increases, or when emissions decrease faster than the ESG scores decline, thereby suggesting a consistent sustainability approach. Negative decoupling happens when emissions grow more rapidly than ESG improves, or when ESG declines more steeply than emissions, which would indicate strategic inconsistency or potential greenwashing. It is important to note that neither positive nor negative values automatically reflect authenticity or deception; proper interpretation involves analyzing the direction of both components. Greenwashing is not automatically associated with the index sign, but it happens when there are significant disconnects between the narrative and the actual impact. A positive DIdx does not necessarily mean genuine progress if ESG improvements are exaggerated through selective disclosure, inflated ratings, or understated emissions. Conversely, a negative DIdx might indicate transparent reporting of operational limitations rather than strategic deception. The box below summarizes our conditional interpretation of the DIdx.
|
DIdx > 0 and ESG increasing |
GHG decreasing |
Strong alignment: ESG disclosures improve, but emissions fall. |
|
DIdx > 0 and ESG decreasing |
GHG decreasing |
Weak and ambiguous alignment: Both ESG disclosures and emissions fall, suggesting a slow transition. |
|
DIdx < 0 and ESG increasing |
GHG increasing |
Potential for greenwashing or simply discordant data: ESG disclosures improve while emissions rise. |
|
DIdx < 0 and ESG decreasing |
GHG increasing |
Full deterioration: ESG deteriorate while emissions increase. |
The following Figure 4 summarizes the four conditional configurations of ESG and GHG dynamics used to interpret the sign and magnitude of the Decoupling Index.
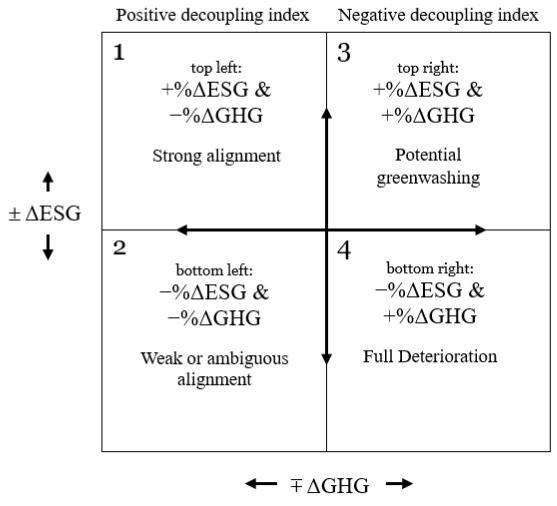
In the left-hand quadrants (1 and 2), the Decoupling Index is necessarily non-negative, as ESG variations dominate or offset emission dynamics. Whereas, in the right-hand quadrants (3 and 4), the Decoupling Index is non-positive instead, reflecting cases where emission dynamics dominate ESG changes.
Unlike traditional methods which view ESG scores and emissions data as separate indicators, our DIdx defines the idea of ‘alignment’ as a measurable factor. While the DIdx is descriptive, it does allow for a systematic evaluation of whether sustainability signals match operational performance. The aim of the DIdx is neither to generate statistically significant metrics nor to establish causality. It simply offers insights into how ESG disclosures and carbon emissions (limited to Scope 1 and 2) align5. To generate statistical inferences and confidence intervals, we would need to perform parametric testing, such as regression analysis, but even if we use a time-series, cross-sectional design, we only have 24 observations of both ESG scores and GHG emissions.
Our taxonomy allows a pragmatic use of the DIdx along three directions: benchmarking across firms to assess which are the firms whose ESG disclosures are congruent with their emissions, misalignment detection (which relates to incongruency) in unveiling how ESG disclosures diverge from true performance, and as a check on transition risk in the sense of answering the question of whether a company’s reported ESG scores reflect the firm’s reality, or an expansion in ESG disclosures simply masks a deterioration of the GHG score. Of course, an obvious limitation of the DIdx is that it does not measure causality, and is susceptible to changes in the intensity of ESG reporting which is less costly to a company in relation of reducing its emissions, and thus the index could be influenced by short-term dynamics.
Nevertheless, in order to provide further insight and assessment robustness, we also provide two parallel versions of the DIdx which can be used simultaneously with the DIdx itself. One of these versions is based on absolute emissions (Scope 1 + 2)6, DIdxabs, and the second is based on emissions intensity (Scope 1 + 2 per unit of output, as reported by Refinitiv®) DIdxint7. This dual approach tries to separate reputational narratives from the actual environmental performance, while also accounting for operational scale and economic growth.
We proceed to the construction and interpretation of the ESG-GHG Decoupling Index as we enumerate. First, we compute the percentage variation in ESG scores for each firm between 2019 and 2022, based on Refinitiv’s 14-dimensional ESG component dataset. Second, we compute the percentage variation in GHG emissions over the same period, limited to Scope 1 and Scope 2, which are operationally controlled and directly reportable. Third, and in parallel, we compute the percentage variation in GHG intensity (Scope 1 + 2 relative to economic activity) in order to capture the performance improvements net of scale effects. Fourth, we subtract the two percentage changes to derive two decoupling measures8. Lastly, we then identify firms with positive decoupling (in the easiest case if ESG ↑↑ while GHG ↑) and conversely identify firms with negative decoupling (which is, again, at the easiest when ESG ↑ while GHG ↑↑). Predictably enough, greenwashing will be most often associated to negative decoupling, as mentioned above.
The ESG score, even when limited to the ‘E’ pillar, reflects not only quantitative emission levels but also qualitative governance aspects: such as target setting, reporting transparency, and strategic alignment with the climate goals. Whereas the aggregate ESG score includes social and governance dimensions, which may rise independently of environmental performance. Therefore, a divergence between ESG improvement and emission trends may reflect a reweighting across ESG pillars, and not necessarily greenwashing.
To assess the alignment between the companies’ declared ESG commitments and their actual environmental performance, we built a Decoupling Index which measures the divergence between changes in ESG scores and changes in greenhouse gas (GHG) emissions. The analysis distinguished between:
For each company i, we computed:
DIdxabs i = %Δ ESG_i – %Δ GHGabs i (2)
DIdxint i = %Δ ESG_i – %Δ GHGint i (3)
Where: %Δ ESG_i is the percentage change in the firm’s ESG score (calculated as the average of 14 Refinitiv ESG profile indicators), and %Δ GHG_i is the percentage change in Scope 1 + 2 emissions, either in the absolute or in the intensity-adjusted form.
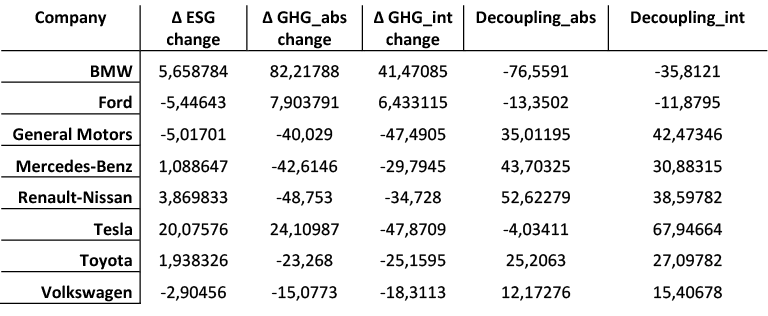
The DIdx measures the net environmental alignment of ESG improvements as it identifies companies whose ESG disclosures and emission reductions tend to be in step, regardless of variations in their ESG scores. Table 3 presents the computed DIdx values for each of the eight automotive manufacturers, showing the divergence between changes in their ESG scores and greenhouse gas emissions from 2019 to 2022. The table includes percentage changes in ESG scores (Δ ESG change), percentage changes in absolute emissions (Δ GHG_abs change), and percentage changes in emissions intensity (Δ GHG_int change), where GHG_int is as defined in Bolton and Kacperczyk (2021). It also provides decoupling values for both absolute (Decoupling-abs) and intensity-adjusted (Decoupling_int) measures. These two metrics help assess whether companies achieved genuine alignment between the sustainability signals and the emissions performance, with positive values indicating ESG improvements outpacing emissions increases, and negative values suggesting possible strategic inconsistency or greenwashing.
The bar chart (Fig. 5) displays two bars per company: the darker bar represents the Decoupling Index based on absolute emissions. In contrast, the lighter bar reflects the same metric based on emissions intensity.
i- Environmentally aligned companies (positive decoupling):
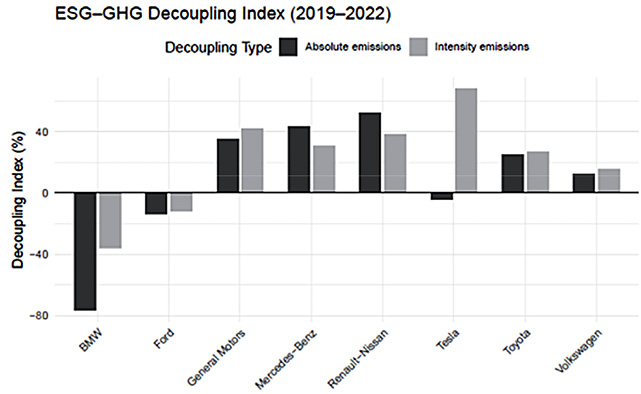
ii- Misaligned companies (negative decoupling):
The following graph (Fig. 6) offers an additional analysis perspective. In this two-dimensional scatterplot, we have on the X-axis the decoupling based on absolute emissions, and, on the Y-axis, the decoupling based on emissions intensity.
Each point represents a company. The dashed diagonal (where y = x) represents the internal consistency line, where both decoupling metrics coincide, of course.
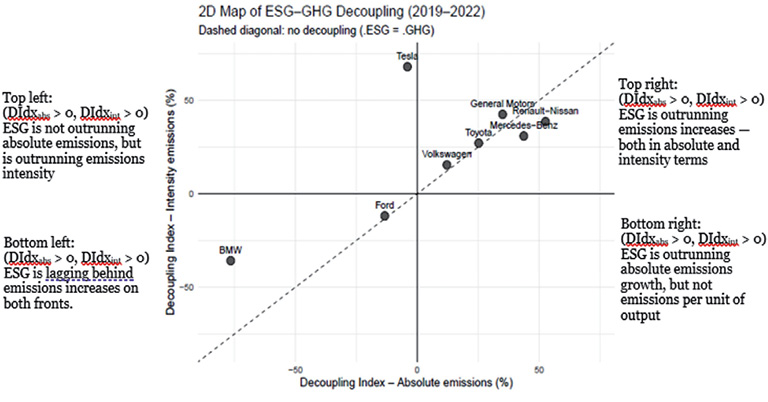
On the diagonal the divergence between ESG and GHG is the same, in fact, whether you use absolute or intensity-based emissions. The above-diagonal ESG score is relatively more divergent from the GHG absolute than from intensity (maybe, the firm improved its intensity, but the total emissions remain high nevertheless). The below-diagonal ESG score is relatively more divergent from GHG intensity than from absolute (possibly, the company improved its total emissions through offsets or scaling, but no real efficiency improvement was observed).
The graph suggests that General Motors, Mercedes-Benz, Renault-Nissan, Toyota and Volkswagen experience a positive divergence between ESG communication and emissions trends, across both dimensions. This could reflect a strategically consistent transition narrative, whether or not GHGs are decreasing. They could be perceived positively by investors or ESG analysts, but this does not guarantee real decarbonization, because of potential lack of transparency (vocational greenwashing).
Tesla has possibly improved its operational carbon efficiency significantly (by lowering the intensity weight), but its total emissions still increased more than its ESG improved.
BMW improved far less than the emissions increased, both in total and in intensity. This indicates that the company has not only failed to improve, but may have even moved backward on sustainability. Actually, even honest disclosure may not justify it.
Less dramatically, Ford’s ESG improvements have been slower than its emissions increases, both in total and per unit. This may mean limited strategic progress, ineffective ESG action, or a transparency-driven reporting of environmental weaknesses, but not a coherent transition strategy. This may reflect rapid production scaling, where improvements in ESG and technology are not yet sufficient to offset the total volume growth.
It is important to emphasize that the Decoupling Index, while analytically robust, is built on the input data (ESG scores and GHG emissions) that are themselves subject to limitations in terms of accuracy and comparability. Although the index captures directional misalignment between ESG improvement and emission trends, it does not account for statistical significance or confidence intervals around these values9.
Our results have pragmatic relevance, much so that their relevance outweighs the data-induced limitations of our analysis. We have a small number of observations because there are relatively few global automotive manufacturers, and they only reported comparative ESG and GHG data for only a small number of years.
The analysis carried out, while proving how challenging it may be to approach the Decarbonization and Transition Risk by using traditional tools, reveals that, at least according to the transparency and disclosure currently available and practiced, ESG score improvements alone are not sufficient to infer any genuine environmental progress. By explicitly comparing the ESG dynamics with the emissions performance, the Decoupling Indexes we built give a few insights, and a few tools may possibly be useful in order to distinguish credible sustainability leaders from potential greenwashers, and to operate a multidimensional assessment of corporate climate strategy, while, at the same time, providing a valuable framework for investors, analysts, and regulators seeking to link ESG disclosures to tangible outcomes.
Combined with the conceptual framework in the first part of the article, our results prove that decarbonization cannot be understood merely as a technological or regulatory challenge. It is a strategic risk problem with both tame and wild dimensions, where signals (ESG scores) may diverge from substance (emissions), and where operational alignment cannot be autoreferential, and it may require more than reputational adaptation.
From this perspective, the empirical evidence reinforces the characterization of decarbonization as a wicked problem. Firms showing a negative or unstable Decoupling Index value are not just underperforming, but are often locked into irreversible production, technological, or supply-chain choices that limit short-term emission reductions. The absence of a dominant or stable decarbonization pathway is reflected in the heterogeneous (and sometimes contradictory) combinations of ESG improvements and emission trajectories observed across firms. Rather than converging toward a clear solution, companies appear to navigate trade-offs under deep uncertainty, where actions taken now become a reason for future constraints and cannot be easily reversed. This ‘empirical fragmentation’ matches the defining features of wicked problems: irreversibility, contested solutions, and the impossibility of ex ante optimization.
By translating abstract risk typologies into measurable empirical tools, we show that firms differ not only in outcomes, but in their very exposure to the possibility of misalignment. This exposure – i.e., the gap between the intention and the impact – is where the cost of risk materializes in the transition to the ‘next green’.
Future research should expand the sample to include additional sectors and a broader range of firm sizes to assess the robustness of the Decoupling Index and its sector-specific characteristics. As longer time series become available, integrating a predictive approach with panel regressions, significance tests, and time clustering will enhance the analytical framework. The gap between intention and impact – between what firms disclose and what they emit – is where transition risk materializes, and enterprise value diminishes. Our findings show that closing this gap requires moving beyond ESG scores to risk-based, multidimensional frameworks that measure what truly matters, namely, verifiable decarbonization progress.
An additional and particularly relevant possibility for future research concerns Scope 3 emissions. While we excluded it in this context from the decoupling analysis, due to comparability and – even more – reliability concerns, improvements in Scope 3 reporting standards and data verification could specifically affect both clustering outcomes and the interpretation of transition alignment.
Abdi M.J. et al. (Raffar N., Zulkafli Z., Nurulhuda K., Rehan B.M., Muharam F.M., Khosim N.A., and Tangang F.) (2022). Index-based insurance and hydroclimatic risk management in agriculture: A systematic review of index selection and yield-index modeling methods. International Journal of Disaster Risk Reduction 67(January), 102653. https://doi.org/10.1016/j.ijdrr.2021.102653
Aswani, J., Raghunandan, A. And Rajgopal, A. (2024). Are carbon emissions associated with stock returns? Review of Finance 28(1), 75-106. https://doi.org/10.1093/rof/rfad013
Atasel, O.Y.; Güneysu, Y.; Ünal, H. (2020). Impact of Environmental Information Disclosure on Cost of Equity and Financial Performance in an Emerging Market: Evidence from Turkey. Ekonomika, 99(2): 76–91. https://doi.org/10.15388/Ekon.2020.2.5
Biehl, J. Et al. (Missbach, L.; Riedel, F.; Stemmle, R.; Jüchter, J.; Weber, J.; Kucknat, J.; Odenweller, A.; Nauck, C.; Lukassen, Laura J.; Zech, M.; Grimm, M.) (2023). “Wicked facets of the German energy transition – examples from the electricity, heating, transport, and industry sectors.” International Journal of Sustainable Energy, 42(1): 1128–1181. https://doi.org/10.1080/14786451.2023.2244602
Bolton, P. And Kacperczyk, M. (2021). Do investors care about carbon risk? Journal of Financial Economics 142(2), 517-549. https://doi.org/10.1016/j.jfineco.2021.05.008
Barone, G. and Bella, M. (2004). Price-elasticity based customer segmentation in the Italian auto insurance market. Journal of Targeting, Measurement and Analysis for Marketing 13(1), 21–31. https://doi.org/10.1057/palgrave.jt.5740129
Boomhower, Judson and Fowlie, Meredith and Gellman, Jacob and Plantinga, Andrew, How are Insurance Markets Adapting to Climate Change? Risk Classification and Pricing in the Market for Homeowners Insurance (June 2024). NBER Working Paper No. w32625, SSRN: https://ssrn.com/abstract=4881204
Charpentier, A., Barry, L. and James, M. (2022). Insurance against natural catastrophes: Balancing actuarial fairness and social solidarity. Geneva Papers on Risk and Insurance 47(1), 50–78. https://doi.org/10.1057/s41288-021-00233-7
Chatterjee, I., Macdonald, A., Tapadar, P. and Thomas, R. G. (2021). When is utilitarian welfare higher under insurance risk pooling? Insurance: Mathematics and Economics 101(8), 280–301. https://doi.org/10.1016/j.insmatheco.2021.08.006
Cox, L., 2008, What’s wrong with risk matrices? Risk Analysis, 28(2): 497–512. https://doi.org/10.1111/j.1539-6924.2008.01030.x.
De Finetti, B. (1974). Theory of probability, Vol 1. John Wiley: New York. https://doi.org/10.1002/bimj.19750170211
Duan, T., Li, F. And Wen, Q. (2023). Is carbon risk priced in the cross section of corporate bond returns? Journal of Financial and Quantitative Analysis. https://doi.org/10.1017/S0022109023000832
Eccles, R. G. and Stroehle, J. (2018), Exploring social origins in the construction of ESG measures. Working Paper, SSRN. https://doi.org/10.2139/ssrn.3212685
Engle, R., S. Giglio, B. Kelly, H. Lee and J. Stroebel, 2020, Hedging Climate Change News, Review of Financial Studies, 33(3): 1184-1216. https://dx.doi.org/10.2139/ssrn.3317570
Friberg, R. (2015). Managing risk and uncertainty: A strategic approach, MIT Press. ISBN 978-0-262-52819-1
Ghosh, N. And Gupta, D. (2022). Decarbonization strategy of businesses, stock return performance and investment styles: A systematic review. Benchmarking: An International Journal 30(1), https://doi.org/10.1108/BIJ0920210554
Hofmann, A. and Scordis, N. (2018). Challenges in applying risk management concepts in practice: A perspective. Risk Management and Insurance Review 21(2), 309-333. https://doi.org/10.1111/rmir.12106
Huynh, T. and Xia, Y. (2021). Climate change news risk corporate bond returns. Journal of Financial and Quantitative Analysis 56(6), 1985-2009. https://doi.org/10.1017/S0022109020000757
Lang, L., Ofek. E. and Stulz, R. (1996). Leverage, investment and firm growth, Journal of Financial Economics 40(1), 2−29. https://doi.org/10.1016/0304-405X(95)00842-3
Li, Q., Shan, H., Tang, Y. and Yao, V. (2024). Corporate climate risk: Measurements and responses. Review of Financial Studies 37(6), 1778-1830. https://doi.org/10.1093/rfs/hhad094
Lindenberg, E. and Ross, S. (1982). Tobin’s q ratio and industrial organization. Journal of Business 54(1), 1−32. https://doi.org/10.1086/296120
Loftus, P. Cohen, A., Long, J. and Jenkins, J. (2014). A critical review of global decarbonization scenarios: What do they tell us about feasibility? Wiley Interdisciplinary Reviews: Climate Change 6(1), 93-112. https://doi.org/10.1002/wcc.324
Nikolaeva, R., Filed, S. and Tskhay, A. (2024), Decarbonizing an energy-hungry world: The dilemma of investing in fossil fuels. Management Decision 62(3), 1105-1113. https://doi.org/10.1108/MD-03-2022-0314
Nordlander, L., Pill, M. and Romera, B. (2020). Insurance schemes for loss and damage: Fools’ gold? Climate Policy 20(6), 704-714. https://doi.org/10.1080/14693062.2019.1671163
Penasco, C., Anadon, L. and Verdolini, E. (2021). Systematic review of the outcomes and trade-offs of ten types of decarbonization policy instruments. Natural Climate Change 11(3), https://doi.org/10.1038/1038/s415580200097x.
Pompella, M. and Costantino, L. (2023). ESG disclosure and sustainability transition, a new metric and emerging trends in responsible investments, Taltech Journal of European Studies 13(1), 8-39. https://doi.org/10.2478/bjes-2023-0002
Rittel, H., and Webber, H. (1973). Dilemmas in a general theory of planning. Policy Sciences 4(2), 155-169. https://doi.org/10.1007/BF01405730
Rothschild, M. and Stiglitz, J. (1976). Equilibrium in competitive insurance markets: An essay on the economics of imperfect information. Quarterly Journal of Economics 90(4), 629-649. https://doi.org/10.2307/1885326
Sastry, P., Sen, I. and Tenekedjieva, A-M. (2024). When insurers exit: Climate losses, fragile insurers, and mortgage markets. Social Sciences Research Network. Working paper 4674279, https://ssrn.com/abstract=4674279
Schwab, J.; Diaz, N.C. (2023). “The discursive blinkers of climate change: Energy transition as a wicked problem.” The Extractive Industries and Society, 15: 101319. https://doi.org/10.1016/j.exis.2023.101319
Seitter, Keith L. (2024). “Weather as Fuel—The Wicked Problem of Renewable Energy in a Warming Planet.” Bulletin of the American Meteorological Society, 105(11). https://doi.org/10.1175/BAMS-D-23-0289.1
Şeker, Y.; Şengür, E.D. (2021). The Impact of Environmental, Social, and Governance (ESG) Performance on Financial Reporting Quality: International Evidence. Ekonomika, 100(2): 190–212. https://doi.org/10.15388/Ekon.2021.100.2.9
SwissRe Corporate Solutions (2024), Comprehensive Guide to Parametric Insurance. Available at: https://corporatesolutions.swissre.com
Wals, A. and Schwarzin, L. (2012). Fostering organizational sustainability through dialogical interaction. The Learning Organization 19(1), 11-27. https://doi.org/10.1108/09696471211190338
Wang, Y., Wu, Z. and Zhang, G. (2022). Firms and climate change: A review of carbon risk in corporate finance. Carbon Neutrality 1(6). https://doi.org/10.1007/s43979022000059
Welton, S. (2020). Decarbonization in democracy. UCLA Law Review 67(1), 56-121. Available at: https://www.uclalawreview.org/wp-content/uploads/securepdfs/2020/07/Welton-67-1.pdf
Wernerfelt, B. and Montgomery, C. (1988). Tobin’s q and the Importance of Focus in Firm Performance, American Economic Review, 78(1), 246−250. Available at: https://www.jstor.org/stable/1814713
Widyawati, L. (2020). A systematic literature review of socially responsible investment and environmental social governance metrics. Business Strategy and the Environment 29(2), 619–637. https://doi.org/10.1002/bse.2393
________
|
Maurizio Pompella (PhD) is a Professor at the University of Siena, School of Economics and Management (SEM), Italy. BSc and MSc in Banking, he holds a PhD in Political Economy. Maurizio Pompella is the editor of the Palgrave Studies in Risk and Insurance and editorial board member of highly reputed journals. He has been teaching Banking, Finance, and Insurance at graduate and post-graduate level in Italy, Eastern Europe, Latin America, the Middle East, Russian Federation, China, and Vietnam. His areas of expertise and current interest include Banking, Finance, Insurance Economics, Sustainability and Transition, ESG compliance, Reporting and Disclosure, and Artificial Intelligence in Finance. |
________
|
Nicos Scordis (PhD) is a Professor in the School of Risk Management, Insurance and Actuarial Science of the Peter J. Tobin College of Business, St. John’s University, New York (USA). Dr. Scordis received a Ph.D in Finance from the University of South Carolina, an M.B.A. from the University of Georgia, and a B.S. in Risk and Insurance from Florida State University. His research interests include risk modeling, risk financing, and management of risk across enterprises to create value for shareholders. Dr. Scordis’ research combines theoretical rigor with pragmatic relevance, and he has written for highly regarded risk industry publications. |
1 Our use of only eight companies is a structural characteristic of the global automotive industry. These eight companies, and the years we study, represent almost all multinational auto manufacturers that provide both complete and comparable GHG and ESG disclosures over the period we examine.
2 Even if the 2019–2022 window is relatively short, it represents a period of high scrutiny over sustainability and ESG reporting, during which, regulatory (and investors’) attention has intensified. Moreover, the selected period offers the best achievable cross-firm comparability for both GHG and ESG variables. The analysis provides a significant perspective on the alignment (or misalignment) of decarbonization signaling and actual emissions performance in the critical COVID and post-COVID transition phase.
3 Refinitiv provides GHG emissions intensity as a standardized metric across firms, typically reflecting total Scope 1 and 2 emissions relative to reported revenue (in tons CO₂ per million USD). The exact calculation methodology, including potential adjustments or estimations, is proprietary and not publicly disclosed in full.
4 Mahalanobis distance measures multivariate dissimilarity while accounting for correlations between variables. Here, each firm is represented by its average Scope 1 and Scope 2 emissions vector. Low distance means similar emission strategies; high distance, diverging operational footprints. This metric emphasizes core industrial emissions under direct corporate control, excluding Scope 3, so that to avoid behavioral and estimation noise.
5 Which also – being not GHG Scope 3 emissions under the control of the firm – allow us to roughly interpret the index as a proxy of the company efficiency.
6 It is worthy to note that absolute emissions, nothing to do with the absolute values of decoupling index ingredients we have just discussed.
7 As we alluded to this, Scope 1 and Scope 2 use creates a rough efficiency proxy. Scope 3 emissions are excluded from computing this decoupling index. Although Scope 3 represents a large share of total emissions in the automotive sector in fact – particularly due to vehicle use-phase emissions – it is not directly controllable by firms, and it remains subject to discretionary estimation methods. The magnitude of Scope 3 emissions depends heavily on assumptions about the product lifespan, usage intensity, regional energy mixes, and vehicle composition. Including it in the decoupling analysis would therefore conflate external consumer behavior and methodological noise with internal corporate performance. For this reason, Scope 3 is retained in the dataset for transparency, but is omitted from the alignment assessment.
8 These decoupling measures are the Absolute Decoupling Index = (%Δ ESG score) − (%Δ GHG emissions), and the Intensity-Based Decoupling Index = (%Δ ESG score) − (%Δ GHG intensity).
9 Future refinements, to the extent of a wider database which would be available, may include bootstrapped standard errors or Bayesian credibility intervals to assess whether the observed divergences are robust to data uncertainty.