Ekonomika ISSN 1392-1258 eISSN 2424-6166
2026, vol. 105(3), pp. 40–57 DOI: https://doi.org/10.15388/Ekon.2026.105.3.3
Jānis Kudiņš
Daugavpils University, LV-5401, Daugavpils, Latvia
Faculty of Humanities and Social Sciences; Department of Law, Management and Economics
ORCID: https://orcid.org/0000-0002-5870-8023
ROR: https://ror.org/01mrkb883
Email: janis.kudins@du.lv
Vera Komarova*
Daugavpils University, LV-5401, Daugavpils, Latvia
Institute of Humanities and Social Sciences
ORCID: https://orcid.org/0000-0002-9829-622X
ROR: https://ror.org/01mrkb883
Email: vera.komarova@du.lv
Edmunds Čižo
Daugavpils University, LV-5401, Daugavpils, Latvia
Department: Faculty of Humanities and Social Sciences; Department of Law, Management and Economics
ORCID: https://orcid.org/0000-0003-0654-2962
ROR: https://ror.org/01mrkb883
Email: edmunds.cizo@du.lv
Anita Kokarēviča
Rīga Stradiņš University, LV-1007, Riga, Latvia
Institute of Public Health
ORCID: https://orcid.org/0000-0001-6173-0910
ROR: https://ror.org/03nadks56
Email: anita.kokarevica@rsu.lv
Abstract. Rail Baltica is a flagship Trans-European Transport Network (TEN-T) corridor project whose positive corridor-level cost–benefit analysis (CBA) indicators do not automatically translate into proportional national welfare gains. Rather than replicating the official CBA, the study applies a methodological inversion based on benefit hierarchy, scenario analysis, and sensitivity testing. Official CBA indicators (NPV, BCR, IRR) are treated as a reference framework, while national outcomes are evaluated through bounded demand and delivery scenarios. Quantitative modelling focuses on passenger time savings as the most stable benefit component, while freight benefits are monetised conservatively by using baseline-anchored utilisation ranges. Freight effects are less robust due to a structural break in East–West transit and declining rail freight baselines. Financing gaps and phased delivery increase exposure to fiscal and timing risk, while environmental gains remain assumption-sensitive. For Latvian decision-makers, the study provides a practical robustness framework centred on node operability, phasing discipline, and demand realisation thresholds to support risk-aware implementation choices.
Keywords: Rail Baltica (RB); corridor-level performance; national effectiveness; benefit distribution; cost–benefit analysis (CBA); scenario analysis; sensitivity testing; Latvia.
_________
* Correspondent author.
Received: 26/12/2025. Accepted: 01/06/2026
Copyright © 2026 Jānis Kudiņš, Vera Komarova, Edmunds Čižo, Anita Kokarēviča. Published by Vilnius University Press
This is an Open Access article distributed under the terms of the Creative Commons Attribution License, which permits unrestricted use, distribution, and reproduction in any medium, provided the original author and source are credited.
Large-scale transport infrastructure projects are commonly appraised at an aggregate level, where costs and benefits are pooled across the participating countries and regions. Under this approach, a project may appear economically efficient overall while still producing uneven, delayed, or fragile outcomes at the national level. This paper addresses a central question in infrastructure economics and public investment appraisal: can a project that performs well in aggregate fail to deliver proportional welfare gains for an individual participating country?
Rail Baltica (RB) provides a particularly instructive case. It is a major post-accession transport investment in the Baltic States and a flagship project of the Trans-European Transport Network (TEN-T). Its stated objectives include strengthening cross-border mobility, market integration, and regional resilience (European Parliament and the Council, 2013). According to the official Cost–Benefit Analyses (CBAs) of RB, the project shows strongly positive corridor-level economic indicators. These include a positive net present value and a Benefit–Cost Ratio (BCR) well above 1 (Rail Baltica, 2024). However, corridor-level efficiency does not automatically translate into proportional national payoffs.
This translation problem is especially relevant for smaller economies participating in regional megaprojects. In such contexts, demand, fiscal capacity, and benefit realisation are unevenly distributed. Aggregate welfare gains may therefore coexist with asymmetric national outcomes. Benefits often concentrate in specific locations and time periods, while costs are borne broadly through national budgets. Latvia represents a clear example of this asymmetry. It also depends on delivery sequencing under constrained financing conditions (European Court of Auditors, 2021; State Audit Office of Latvia, 2024).
In the official CBAs, RB’s economic rationale is driven primarily by passenger time savings, reliability improvements, and modal-shift effects (Rail Baltica, 2024). Independent audit evidence points to a substantial financing gap and elevated exposure to phasing, schedule slippage, and cost escalation (State Audit Office of Latvia, 2024). These factors are critical at the national level, where fiscal burdens are front-loaded while user benefits materialise only once key sections have become operational.
Another source of asymmetry arises from Latvia’s spatial demand structure, with passenger flows and economic activity concentrated in the Riga metropolitan area (Zeibote et al., 2025). As a result, a large share of projected benefits depends on the timely operability of key urban and intermodal nodes – the ‘Riga core’, including the central station and airport interface. Delays or partial functionality of this node disproportionately weaken Latvia’s realised payoff relative to corridor-level results.
Against this background, the paper assesses Latvia as a case of asymmetric benefit distribution within a regional infrastructure project. It distinguishes corridor-level economic performance from national effectiveness. The analysis integrates results from the official CBAs of RB with national statistics on the passenger/freight traffic and turnover since 1990s, and fiscal data on expenditures for RB in Latvia.
The study applies a methodological inversion, defined as reversing the standard direction of cost–benefit interpretation. Instead of deriving aggregate indicators from a full set of assumed inputs, the analysis starts from the official corridor-level appraisal framework and reconstructs outcomes at the national level under bounded demand and delivery scenarios.
This shifts the focus from reproducing indicators such as NPV or BCR to testing the robustness of benefit realisation. Unlike standard sensitivity analysis, which examines marginal parameter variation, methodological inversion holds the CBA framework constant and evaluates how its key components translate into national-level outcomes under varying conditions.
RB is widely discussed in policy and strategic documents as a corridor-scale TEN-T investment aimed at enhancing cross-border connectivity, market integration, and cohesion. Independent audits and oversight reports instead emphasise delivery risks, cost escalation, and fiscal exposure linked to funding gaps and phased implementation (European Court of Auditors, 2021). Since 2022, the project has also been framed in relation to military mobility and security objectives (Håkansson, 2023).
Within EU practice, CBA remains the standard tool for evaluating large transport investments. The key challenge is not calculating summary indicators such as NPV or BCR, but ensuring robustness under uncertainty in demand, costs, and delivery timing. Recent studies stress structured scenario analysis and sensitivity testing rather than reliance on single-point estimates (Park, 2021).
Megaproject research documents persistent gaps between ex ante appraisal and realised performance. Optimism bias, escalation dynamics, and institutional lock-in are widely treated as structural features rather than isolated failures (Flyvbjerg & Bester, 2021). Positive aggregate appraisal results therefore do not guarantee proportional or timely welfare gains at lower spatial scales when implementation diverges from assumptions.
A broad literature shows that infrastructure benefits are rarely spatially uniform. Place-based approaches view infrastructure as embedded in specific economic and institutional contexts, where outcomes depend on node functionality, governance capacity, and complementary investment (McCann, 2023; Andrić et al., 2024). Corridor efficiency may thus coexist with uneven national outcomes. Empirical studies confirm that benefits concentrate around major urban nodes and dense regions rather than along entire alignments (Voitko et al., 2022; Boira, 2023; Cavallaro et al., 2023), which is a pattern that has already observed both between and within countries with strong internal disparities.
For Latvia, research highlights the concentration of economic activity and transport demand in the Riga metropolitan area and weaker peripheral performance. Territorial transport and productivity studies show that infrastructure effects vary with density, distance, and institutional capacity (Kudiņš et al., 2024; Zeibote et al., 2025).
Another strand of literature examines freight vulnerability to external shocks and structural change (Hollweg et al., 2017; Kılınç et al., 2023; Flyvbjerg & Gardner, 2023). Geopolitical disruption and trade reconfiguration can produce lasting breaks, making historical freight trends unreliable predictors. In the Baltic region, studies and audits document the collapse of East–West transit and declining rail freight activity (Kılınç et al., 2023; Yeboah, 2024; European Court of Auditors, 2021), with uneven regional economic effects inside Latvia (Zeibote et al., 2025).
Megaproject and logistics research further notes that freight benefits depend on successful intermodal integration, logistics services, and coordination mechanisms; without these, the corridor infrastructure may remain underutilised despite positive aggregate appraisals (Flyvbjerg & Bester, 2021; Flyvbjerg & Gardner, 2023; Park, 2021).
Overall, the literature indicates that corridor-level appraisal can mask spatial asymmetries in benefit realisation (Pagliara et al., 2022), both between countries and within territorially uneven economies. For Latvia, three gaps remain: corridor aggregation may obscure internal territorial differences; node-level benefit conversion is underexamined; and official appraisals are seldom systematically confronted with national statistics and budget constraints. This study addresses these gaps by combining corridor-level appraisal results with national statistical and fiscal data to evaluate how RB’s aggregate performance translates into uneven national outcomes.
The official CBA defines the baseline cost–benefit structure and integrated indicators (NPV, BCR) at the corridor level (Rail Baltica, 2024). This study introduces a national scenario layer that varies demand realisation, benefit timing, and utilisation intensity while preserving the conceptual structure of the official appraisal (European Commission, 2014; 2021).
Scenario analysis constructs bounded national trajectories for Latvia under Reference, Low, and Stress conditions. Passenger volumes are calibrated by using observed modal statistics, with bus and air flows as proxies for the contestable intercity market (Central Statistical Bureau of Latvia, 2025a; 2025b). A standard ramp-up profile captures gradual post-launch demand realisation.
Sensitivity testing is applied to core monetised benefits by varying the passenger demand (±20%) while holding the valuation parameters constant, which is consistent with the European guidance treating value-of-time as the normative (European Commission, 2014). This isolates demand effects without altering the formal CBA logic.
National transport statistics provide the empirical constraint layer: passenger data define the demand scale, while the freight data capture volatility and contraction (Central Statistical Bureau of Latvia, 2025a–d). These data are used to bound scenarios rather than generate forecasts, in line with reference-class and risk-based approaches (European Court of Auditors, 2021).
Scenario capture shares are benchmarked against comparable HSR and interoperability corridors, where mature modal shifts typically range within 5–15%, with a lower uptake in peripheral contexts (Cavallaro et al., 2023; Pagliara et al., 2022). Consistent with evidence on optimism bias in megaproject demand forecasts (Flyvbjerg & Bester, 2021; Park, 2021), the selected shares (3%, 1%, 0.5%) are set at the lower bound with the objective to ensure a conservative scenario design.
Within the benefit hierarchy, passenger time savings (A1) form the primary monetised component. Freight benefits (A3) are modelled by using conservative baseline-anchored ranges, while vehicle operating costs (A2) are retained conceptually but not separately monetised due to data limitations.
The resulting scenario structure (Table 1) defines bounded national trajectories and supports sensitivity testing of demand, timing, and delivery risk without replicating the official CBA.
|
Scenario |
Passenger demand |
Freight utilisation |
Cost–benefit timing |
Analytical purpose |
|
Reference |
Aligned with official CBA assumptions |
Consistent with corridor-level expectations |
Costs and benefits are broadly synchronised |
Baseline reference for comparison |
|
Low |
Below corridor-level projections due to partial modal shift and spatial concentration |
Limited, reflecting existing logistics patterns |
Benefits are delayed relative to costs |
Test sensitivity to demand underperformance |
|
Stress |
Substantially below official projections |
Marginal and volatile, sensitive to external conditions |
Costs are front-loaded; benefits significantly postponed |
Examine robustness under adverse delivery conditions |
Source: elaborated by the authors based on Park, 2021; Baerenbold, 2023.
Across all scenarios, the formal structure of the official CBA is retained, while the key parameters – those of demand realisation, timing, and exposure to uncertainty – are varied to assess their influence on national outcomes. This design allows for systematic sensitivity testing without reproducing or contesting the official appraisal itself.
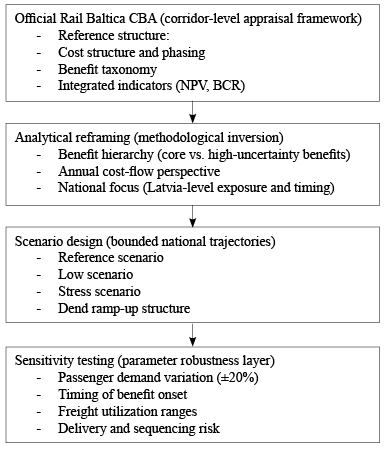
Figure 1 summarises the analytical logic of the study, illustrating the transition from the official corridor-level CBA to scenario-based sensitivity testing at the national level.
Source: elaborated by the authors based on Park, 2021; Baerenbold, 2023.
Methodological inversion in this study reinterprets the corridor-level CBA through a national cost-flow and benefit-realisation perspective. Instead of recalculating the integrated indicators, it isolates key benefit components and evaluates them under bounded demand and timing scenarios.
Official CBAs of RB constitute an institutionally recognised appraisal framework (European Commission, 2014; 2021) designed to support policy and investment decision-making in large-scale transport infrastructure. According to the published materials, the official CBAs of RB report a positive overall economic assessment of the project. In particular, they indicate a positive Net Present Value (NPV) and BCR > 1, which are presented as evidence of long-term socio-economic viability at the corridor level (Rail Baltica, 2024). These results are derived from an aggregated benefit structure that combines direct transport effects with environmental externalities, regional development impacts, and strategic or institutional considerations.
In line with the adopted methodological framework, the analysis introduces a hierarchy of transport-related benefits (Group A) for Latvia, comprising:
(1) passenger time savings (A1);
(2) vehicle operating cost reductions (A2);
(3) freight logistics efficiency (A3).
Publicly available materials identify passenger time savings (A1) as the primary economic benefit within the RB appraisal framework (Rail Baltica, 2024), driven by substantial travel time reductions on key corridors such as Riga–Tallinn and Riga–Kaunas. Given the dominance of road transport in intercity travel (Eurostat, 2024), these gains are structurally linked to a modal shift rather than an induced demand. As a standard and consistently monetisable component in European CBAs, A1 forms the analytical baseline for the scenario and sensitivity analysis.
A second benefit category (A2) reflects reductions in vehicle operating costs due to the modal shift from road to rail. While supported by transport energy and cost data (European Environment Agency, 2023), A2 is not separately monetised and is treated as demand-correlated within the model.
Freight benefits (A3) represent a third component, linked to improved interoperability and logistics efficiency (Rail Baltica, 2024). However, given the limited and volatile role of rail in Baltic freight transport (Central Statistical Bureau of Latvia, 2025c; Eurostat, 2024), these benefits are treated conservatively.
Additional benefit categories (Groups B and C), including environmental and strategic effects, are described qualitatively and excluded from monetisation due to high uncertainty (Rail Baltica, 2024).
Initial RB expenditures in Latvia were incurred during the institutional and planning phase between 2014 and 2017, following the establishment of Eiropas dzelzceļa līnijas (EDzL). During this period, expenditures were primarily administrative and design-related and remained below €10 million annually, while simultaneously creating binding co-financing obligations for the subsequent project stages (State Audit Office of Latvia, 2018).
A more explicit cost structure emerged following the conclusion of the first Connecting Europe Facility (CEF) grant agreements. By the end of 2019, three CEF agreements had allocated approximately €296 million to Latvia, while the national budget contributions amounted to around €55 million, corresponding to a co-financing share of roughly 18–20% (State Audit Office of Latvia, 2018). Although the EU transfers dominated the total funding volumes, Latvia assumed responsibility for advance payments, co-financing, and uncovered cost items.
From 2022 onwards, national expenditures increased sharply as RB entered the early construction phase. Public budget documents and ministerial communications indicate that the total project-related cash flows in Latvia exceeded €160 million in 2022 and reached approximately €175 million in 2024, with the national budget contributions estimated at €40–60 million per year (Ministry of Transport of Latvia, 2024).
In this context, the total project cash flows should be interpreted as reflecting the overall scale of expenditure within Latvia, including both EU co-financing disbursed to project activities and Latvian contributions. By contrast, national fiscal exposure is determined by the Latvian state budget component, which represents direct co-financing obligations and constitutes the relevant measure for assessing affordability and the budgetary impact. For 2025, public statements by government representatives suggest that an additional €62 million from the Latvian budget was required to maintain the project continuity, thus highlighting short-term fiscal pressure despite continued EU co-financing (LSM English, 2025).
EU support remains substantial but does not eliminate national exposure. In July 2025, the European Commission approved an additional €295.5 million in CEF funding for Rail Baltica across the Baltic States, while Latvia simultaneously committed to continued national contributions to meet co-financing and sequencing requirements (European Commission via Rail Baltica, 2025). As a result, Latvia’s annual budgetary burden has become increasingly sensitive to project phasing and cash-flow timing.
Given the absence of a consolidated public source on executed annual payments, RB’s cost profile in Latvia is reconstructed through triangulation of audit summaries, ministerial budget plans, official project communications, and media reporting. Annual figures should therefore be interpreted as indicative ranges rather than exact accounting values.
|
Year |
Total project cash flow* in Latvia (EU + LV), € mln |
Latvian national cash (state budget), € mln |
Source / confidence |
|
2014 |
~2–5 |
~2–5 |
EDzL setup, low confidence |
|
2015 |
~5–10 |
~2–4 |
Early planning |
|
2016 |
~10–15 |
~3–5 |
Design phase |
|
2017 |
~10–20 |
~3–6 |
Design / land prep |
|
2018 |
~20–30 |
~5–8 |
First CEF tranche |
|
2019 |
~30–50 |
~8–12 |
Preparation works |
|
2020 |
~40–70 |
~10–15 |
Transition phase |
|
2021 |
~50–80 |
~12–18 |
Early construction |
|
2022 |
~150–170 |
~40–45 |
Active works |
|
2023 |
~150–200 |
~40–50 |
Active works |
|
2024 |
~170–180 |
~55–60 |
Official MT plan |
|
2025** |
unknown |
unknown |
Data gap |
|
2026 |
~250–270 (planned) |
~70–80 (planned) |
Forward-looking |
Note. * “Total project cash flow in Latvia” refers to total annual expenditure within Latvia, including EU co-financing and national contributions, and reflects the project scale rather than its fiscal burden. National fiscal exposure is captured separately by the “Latvian national cash” column.
** For 2025, publicly available data on executed cash expenditures remain fragmented; this year is treated as a gap and is addressed through scenario ranges in the sensitivity analysis.
Source: elaborated by the authors based on publicly available data from State Audit Office of Latvia, 2018; Ministry of Transport of Latvia, 2024; European Commission via Rail Baltica, 2025; LSM English, 2025.
Table 2 summarises the annual cost structure of Rail Baltica in Latvia and highlights three patterns: rising national budget contributions, persistent gaps between the commitments and execution transparency, and exposure to sequencing risk, where corridor delays translate into short-term fiscal pressure.
The Latvian case shows that corridor-scale megaprojects can create significant, front-loaded national fiscal obligations before benefits materialise, providing the basis for the subsequent analysis of robustness and affordability.
Scenario analysis and sensitivity testing framework. In line with the adopted research design, scenario analysis and sensitivity testing are used as the central quantitative instruments of this study. Following the established European appraisal practice, the analytical structure separates scenario-dependent quantified variables from fixed parameters (European Commission, 2014). The fixed parameters are as follows: the average time saving per trip (based on official Rail Baltica corridor comparisons), the value of time (VoT), consistent with European CBA standards, and the cost-structure logic derived from official railway CBA methodology.
Historical rail passenger volumes in Latvia are dominated by suburban and domestic trips and therefore do not adequately represent the intercity and international market targeted by RB. Accordingly, the rail passenger counts alone are not used as the demand base (B).
Instead, the contestable intercity market is approximated using bus and air passenger traffic, which represent the principal competing modes for medium- and long-distance travel. According to official Latvian statistics for 2024: bus passenger traffic is 100.9 million, air passenger traffic is 5.5 million, and B = 106.4 million passengers per year (Central Statistical Bureau of Latvia, 2025a). The use of the observed modal volumes as a calibration base is consistent with reference-class and scenario-based approaches in megaproject demand assessment (Baerenbold, 2023).
Scenario capture shares are defined conservatively, while reflecting bus dominance in intercity mobility, the historically limited role of rail, and the documented demand forecast risks (Baerenbold, 2023): 3% (Reference), 1% (Low), and 0.5% (Stress).
Empirical evidence from European rail corridors provides context for these values. While mature high-speed rail systems in dense markets (e.g., Madrid–Barcelona, Paris–Lyon) have achieved modal shifts exceeding 30%, such outcomes reflect favourable conditions, including large metropolitan endpoints and a strong baseline demand. By contrast, secondary and emerging corridors typically exhibit more moderate uptake, at around 5–15%, with a gradual ramp-up (Cavallaro et al., 2023), while cross-border and lower-density contexts tend to show a weaker modal shift due to a fragmented demand and strong road competition (Pagliara et al., 2022).
Against this background, the selected capture shares are positioned at the lower bound of the observed ranges. The Reference scenario (3%) aligns with conservative outcomes for secondary corridors, while the Low (1%) and Stress (0.5%) scenarios reflect weak demand realisation and structural constraints typical of peripheral markets, thus supporting a robustness-oriented interpretation.
The passenger uptake is assumed to grow gradually after the service introduction by using a staged ramp-up profile (European Commission, 2021): t1 = 0.40, t2 = 0.60, t3 = 0.80, t4 = 0.90, t5+ = 1.00. Scenario passenger volumes are calculated by using the formula:
Pt = B × smaure × тt (1)
where:
Pt is passengers in year t,
B is the observed demand base,
smaure is scenario capture share,
тt is the ramp-up factor.
|
Year |
Reference scenario (3%) |
Low scenario (1%) |
Stress scenario (0.5% with one-year delay) |
|
t1 |
1.28 |
0.43 |
0.00 |
|
t2 |
1.91 |
0.64 |
0.21 |
|
t3 |
2.55 |
0.85 |
0.32 |
|
t4 |
2.87 |
0.96 |
0.43 |
|
t5 |
3.19 |
1.06 |
0.53 |
Source: calculated by the authors based on Formula (1) and data from Central Statistical Bureau of Latvia, 2025a.
Scenario-specific passenger volumes (Pt) are calibrated by using the observed national passenger transport statistics rather than treated as point forecasts. Scenario values are derived as bounded capture shares of this observed demand, combined with a standard ramp-up profile over the initial years of operation. The Reference, Low, and Stress scenarios therefore represent alternative modal-shift and timing conditions rather than deterministic demand projections.
In accordance with the adopted benefit hierarchy, passenger time savings constitute the primary monetised benefit component (A1). This category is consistently used as a core benefit driver in European railway CBAs due to its direct behavioural basis and methodological standardisation (European Commission, 2014). Public RB documentation indicates substantial travel-time reductions on key corridors relative to existing road and rail alternatives, driven by higher operating speeds and an improved reliability (Rail Baltica, 2024).
Annual monetised passenger time savings are estimated by using the formulation that follows the established European transport appraisal methodology (European Commission, 2014):
A1t = Pt × ΔT × VoT (2)
where:
A1t – annual passenger time savings (EUR) in year t,
Pt – scenario-based passenger volume in year t,
ΔT – average time saving per trip (hours),
VoT – value of time (EUR/hour).
Parameter selection:
(1) Average time saving per trip (ΔT): official RB corridor comparisons indicate time reductions typically in the range of 1.5–2.5 hours, depending on the route and the baseline mode (Rail Baltica, 2024). For conservative core estimation, this study adopts ΔT = 2.0 hours. This parameter is held constant across the scenarios; sensitivity testing is applied to demand rather than to time parameters.
(2) Value of time (VoT): European CBA guidance and railway appraisal practice typically apply the intercity passenger values of time in the range of EUR 8–15 per hour (European Commission, 2014). A mid-range value is adopted as VoT = EUR 12 per hour. The monetised time saving per passenger equals EUR 24 per trip.
While VoT is recognised as a normative parameter subject to variation (European Commission, 2014, 2021), it is treated as fixed to focus on demand realisation as the primary source of uncertainty. This allows sensitivity testing to isolate behavioural variability in passenger uptake, with VoT serving as a standardised benchmark consistent with robustness-oriented appraisal approaches (Park, 2021).
|
Year |
Reference scenario |
Low scenario |
Stress scenario |
|||
|
Pt, million |
A1t, EUR million per year |
Pt, million |
A1t, EUR million per year |
Pt, million |
A1t, EUR million per year |
|
|
t1 |
1.28 |
30.7 |
0.43 |
10.3 |
0.00 |
0.0 |
|
t2 |
1.91 |
45.8 |
0.64 |
15.4 |
0.21 |
5.0 |
|
t3 |
2.55 |
61.2 |
0.85 |
20.4 |
0.32 |
7.7 |
|
t4 |
2.87 |
68.9 |
0.96 |
23.0 |
0.43 |
10.3 |
|
t5 |
3.19 |
76.6 |
1.06 |
25.4 |
0.53 |
12.7 |
Source: calculated by the authors based on Formula (2) and data from Table 3.
Following the European CBA guidance, sensitivity testing is applied to the passenger demand by varying the volumes by ±20%, while holding time savings and the value of time constant (European Commission, 2014). Because A1 is linear in Pt, benefits scale proportionally:
A1±20% = A1 × (0.8;1.2) (3)
Sensitivity testing is therefore applied to demand parameters, while VoT inputs are held constant to preserve comparability across the scenarios and avoid mixing behavioural and normative sources of variation.
|
Year |
Base A1 |
-20% demand |
+20% demand |
|
t1 |
30.7 |
24.6 |
36.8 |
|
t2 |
45.8 |
36.6 |
55.0 |
|
t3 |
61.2 |
49.0 |
73.4 |
|
t4 |
68.9 |
55.1 |
82.7 |
|
t5 |
76.6 |
61.3 |
91.9 |
Source: calculated by the authors based on Formula (3) and data from Table 4.
Passenger time savings are monetised by using standard European CBA parameters and scenario-calibrated passenger volumes. Sensitivity testing is performed on demand rather than on value-of-time parameters, thus ensuring that robustness results reflect behavioural uncertainty rather than normative valuation choices (Park, 2021).
Freight transport in Latvia exhibits high volatility and structural breaks. The railway freight turnover has declined sharply from 15,000–20,000 million tonne-kilometres in the 2000s–2010s to approximately 3,509 million t-km in 2024, while road freight remains dominant (Central Statistical Bureau of Latvia, 2025c). European audit evidence also shows that modal shifts to rail tend to materialise more slowly and unevenly than projected (European Court of Auditors, 2021).
Accordingly, freight demand represents a higher-uncertainty benefit component relative to passenger time savings. Consistent with the adopted benefit hierarchy, freight benefits (A3) are included but treated conservatively, modelled through scenario ranges and monetised separately from the passenger results, in line with evidence on optimism bias in megaproject demand forecasts (Flyvbjerg & Bester, 2021).
The freight scenario baseline is anchored to the latest observed rail freight turnover level rather than to historical peaks. For 2024, the rail freight turnover in Latvia is approximately: FT_base = 3.5 billion t-km (Central Statistical Bureau of Latvia, 2025c). The use of the latest observed level rather than earlier maxima avoids embedding structural transit patterns that may no longer be reproducible under the current geopolitical and market conditions.
Freight scenarios are defined as percentage improvements relative to the observed baseline turnover, reflecting different degrees of corridor capture and logistics integration (European Court of Auditors, 2021). The scenario structure is as follows:
Illustrative affected freight volumes
Freight benefits are monetised by using a simplified logistics cost/time saving proxy (European Commission, 2021):
A3t = FTt × ΔClog (4)
where:
A3t – annual freight benefit (EUR),
FTt – freight tonne-km affected by RB,
ΔClog – average logistics cost saving per t-km.
Instead of applying optimistic logistics value parameters, a conservative unit benefit range is used: ΔClog = EUR 0.01–0.03 per t-km. This range reflects lower-bound intermodal efficiency differentials and avoids overstating corridor-level freight gains. Illustrative monetised freight benefits (annual):
Freight benefits are therefore material but they remain below passenger time savings in all scenarios, thus preserving analytical balance.
Freight benefits are modelled by using baseline-anchored scenario ranges and conservative unit values due to the documented volatility and forecast risk in rail freight demand. This ensures that corridor-level upside assumptions do not dominate national robustness results and maintain consistency with risk-aware megaproject appraisal practice (Baerenbold, 2023).
|
Year |
Reference |
Low |
Stress |
|
t1 |
39 |
15 |
2 |
|
t2 |
55 |
20 |
9 |
|
t3 |
73 |
26 |
12 |
|
t4 |
81 |
29 |
15 |
|
t5 |
92 |
31 |
15 |
Note: Passenger A1 values are calculated by using scenario passenger volumes and standard VoT parameters. Freight A3 values are conservative midpoint estimates within the defined scenario ranges.
Source: calculated by the auhors based on the data from Central Statistical Bureau of Latvia, 2025a, 2025b, 2025c and the above-outlined methodology.
|
Year |
Passenger A1 |
Freight A3 (mid) |
Typical national cost range |
|
t1 |
30.7 |
8 |
40–60 |
|
t2 |
45.8 |
9 |
40–60 |
|
t3 |
61.2 |
12 |
40–60 |
|
t4 |
68.9 |
12 |
40–60 |
|
t5 |
76.6 |
15 |
40–60 |
Note: Freight values use conservative midpoint estimates within scenario ranges. Cost ranges reflect reconstructed national co-financing flows rather than full corridor expenditure.
Source: compiled/calculated by the authors based on the data from Tables 2, 5 and 6.
The scenario-based results presented above operationalise the methodological inversion introduced in this study relative to the official corridor-level CBA framework. Freight benefits are incorporated only through conservative baseline-anchored ranges. This layered structure makes it possible to observe how the total monetised benefits behave when higher-uncertainty components are restricted and demand parameters are varied explicitly.
Across all scenarios, passenger time savings remain the dominant quantified benefit component, while freight-related gains contribute a secondary (Table 7) and uncertainty-weighted increment. The resulting benefit ranges demonstrate strong linear sensitivity to passenger uptake assumptions, as confirmed by the ±20% demand tests (Table 5). This shows that the results depend mainly on the passenger volumes, and not on the parameter choice.
When scenario-based annual benefits are compared with indicative Latvian national co-financing ranges (Table 7), a timing and scale interaction becomes visible that is not directly observable in corridor-level CBA aggregates. Even under the Reference scenario, early-year monetised benefits are of a comparable order of magnitude to the annual national budget contributions, while, under the Low and Stress scenarios, they remain materially below them for several years.
To interpret the link between the demand and the fiscal exposure, a break-even passenger threshold is defined as the level at which annual monetised benefits equal Latvian national co-financing costs. On the grounds of using A1 = Pt × ΔT × VoT, and a midpoint freight estimate (A3 ≈ EUR 10–15 million) as a representative central value within the defined scenario range, the break-even condition can be expressed as Pt × 24 + A3 ≈ 40–60 million EUR, where EUR 24 represents the monetised time saving per passenger.
This yields a break-even range of approximately 1.0–2.1 million passengers per year: around 1.0–1.2 million at lower cost levels (~EUR 40 million) and 1.9–2.1 million at higher levels (~EUR 60 million). The threshold provides an indicative central benchmark, though the outcomes remain sensitive to the freight performance and demand.
Compared with the scenarios, the Reference case exceeds this range after ramp-up, the Low scenario approaches it later, and the Stress scenario remains below it, thereby indicating that the fiscal balance is highly dependent on demand realisation.
This study examines whether a transport megaproject with strong corridor-level performance can produce uneven outcomes at the national level. The results show that, while the official CBA framework is coherent at a corridor scale, national outcomes remain highly conditional on demand realisation, delivery timing, and node functionality. Aggregate efficiency and national welfare are therefore not equivalent, particularly in smaller economies with concentrated demand and fiscal constraints (Yeboah, 2024).
The benefit hierarchy clarifies this gap. Passenger time savings remain the most stable and monetisable component (Cavallaro et al., 2023), while freight benefits are more uncertain due to post-2020 structural contraction in rail flows (Central Statistical Bureau of Latvia, 2025d), thus supporting conservative modelling assumptions.
The Riga core acts as the key mediator of national benefit realisation. With demand concentrated in the Riga metropolitan area (Zeibote et al., 2025), outcomes depend on the operational completeness of central nodes, including the station and airport interface. This aligns with place-based research showing that corridor benefits are node-mediated rather than spatially uniform (McCann, 2023; Pagliara et al., 2022), and that they may conceal internal asymmetries (Boira, 2023).
Geopolitical shocks have further reshaped freight dynamics, making pre-2020 baselines unreliable (Central Statistical Bureau of Latvia, 2025d), while the EU policy increasingly emphasises military mobility and dual-use infrastructure (Håkansson, 2023).
Despite weak economic performance under the Stress scenario, a strong counterargument arises from this strategic role. RB may be justified on non-economic grounds, including security, resilience, and integration. However, such benefits are difficult to quantify, and they are largely external to national fiscal accounts, which means that they do not remove the need to assess affordability and demand realisation.
This argument is particularly relevant in the current geopolitical context. However, such benefits differ from standard CBA components: they are difficult to quantify, unevenly distributed, and largely external to national fiscal accounts. Their presence does not remove the need to assess affordability and demand realisation, but indicates that economic and strategic rationales operate in parallel.
Accordingly, the results should not be read as rejecting the project’s strategic justification, but as clarifying the conditions under which economic benefits materialise at the national level.
By using RB and Latvia as a case, the study distinguished corridor-level effectiveness from national effectiveness and assessed how official appraisal logic translates under national demand, timing, and delivery constraints.
The results show that corridor-level net benefits are structurally driven by passenger time and reliability effects, while national benefit realisation for Latvia is highly sensitive to passenger demand ramp-up and delivery sequencing. Scenario modelling demonstrates that monetised national benefits vary substantially under Reference, Low, and Stress demand trajectories. Delays or partial operability of this node significantly weaken Latvia’s realised payoff relative to corridor-level indicators.
The study contributes methodological novelty by introducing a corridor-to-national translation framework that combines the official CBA structure with benefit hierarchy, national statistics, bounded scenarios, and explicit sensitivity testing. This robustness-oriented layer complements – rather than replaces – integrated CBA and responds to documented risks of the demand forecast error and megaproject optimism bias. The explicit integration of node-level (Riga core) dependence and national cost-flow timing further extends place-based and megaproject appraisal approaches.
Several limitations should be noted. The study does not reconstruct a full national CBA and does not monetise all benefit categories. Vehicle operating cost savings and environmental effects are treated conceptually or conservatively due to attribution and parameter uncertainty. Scenario ranges are bounded rather than predictive, and rapidly evolving geopolitical conditions – including war-related logistics and security shifts – are incorporated through robustness framing rather than dynamic modelling. As a result, the findings should be interpreted as conditional robustness results rather than forecasts.
Future research may extend this approach by integrating dynamic geopolitical and trade scenarios, network simulation of node operability, and lifecycle environmental accounting. Comparative corridor-to-national analyses across other TEN-T projects and small economies would also help generalise the framework. Further work linking scenario-based appraisal with fiscal risk modelling and defence-mobility planning would be especially relevant under current European security conditions.
Andrić, J. M., Wang, J., & Mohammadi, A. (2024). Determining cost and causes of overruns in infrastructure projects in South Asia. Sustainability, 16(24), 11159. https://doi.org/10.3390/su162411159
Baerenbold, R. (2023). Reducing risks in megaprojects: The potential of reference class forecasting. Project Leadership and Society, 4(7–8), 100103. https://doi.org/10.1016/j.plas.2023.100103
Boira, J. V. (2023). Progress and challenges in the implementation of the Mediterranean Corridor and the TEN-T in Spain: The Port of Valencia. Land, 12(11), 1986. https://doi.org/10.3390/land12111986
Cavallaro, F., Nocera, S., Sommacal, G., & Vergelli, G. (2023). The fare and frequency sensitivity in high-speed rail demand: Empirical evidence from the Italian market. Transportation, 50(5), 1685–1721. https://doi.org/10.1007/s11116-022-10291-y
Central Statistical Bureau of Latvia. (2025a). Table TPA020: Passenger traffic (million passengers), 1990–2024. Statistical Database. https://stat.gov.lv/en/statistics-themes/business-sectors/passenger-traffic/tables/tpa020-passenger-traffic-million
Central Statistical Bureau of Latvia. (2025b). Table TPA030: Passenger turnover (million passenger–kilometres), 1990–2024. Statistical Database. https://stat.gov.lv/en/statistics-themes/business-sectors/passenger-traffic/tables/tpa030-passenger-turnover-million
Central Statistical Bureau of Latvia. (2025c). Table TRK010: Cargo traffic and cargo turnover by mode of transport, 1980–2024. Statistical Database. https://stat.gov.lv/en/statistics-themes/business-sectors/freight-transport/tables/trk010-cargo-traffic-and-cargo-turnover
Central Statistical Bureau of Latvia. (2025d). Table TRK030: Cargo traffic by rail, 1993–2024. Statistical Database. https://stat.gov.lv/en/statistics-themes/business-sectors/freighttransport/tables/trk030-cargo-traffic-rail
European Commission. (2014). Guide to cost-benefit analysis of investment projects: Economic appraisal tool for cohesion policy 2014–2020. Publications Office of the European Union. https://ec.europa.eu/regional_policy/en/information/publications/guides/2014/guide-to-cost-benefit-analysis-of-investment-projects-for-cohesion-policy-2014-2020
European Commission. (2021). Economic appraisal vademecum 2021–2027: General principles and sector applications. Publications Office of the European Union. https://ec.europa.eu/regional_policy/en/information/publications/guides/2021/economic-appraisal-vademecum-2021-2027-general-principles-and-sector-applications
European Commission via Rail Baltica. (2025). European Commission grants €295.5 million to support Rail Baltica’s further development. Railbaltica.org. https://www.railbaltica.org/news/european-commission-grants-e295-5-million-to-support-rail-balticas-further-development/
European Court of Auditors. (2021). Intermodal freight transport: Still a long way to go (Special Report No. 06/2021). https://www.eca.europa.eu/en/publications/SR-2021-06
European Environment Agency. (2023). Transport and environment report 2022 (EEA Report No. 14/2023). Publications Office of the European Union. https://www.eea.europa.eu/en/analysis/publications/transport-and-environment-report-2022
European Parliament and the Council. (2013). Regulation (EU) No 1315/2013 on Union guidelines for the development of the trans-European transport network. https://eur-lex.europa.eu/eli/reg/2013/1315/oj
Eurostat. (2024). Key figures on European transport – 2023 edition. Publications Office of the European Union. https://ec.europa.eu/eurostat/web/products-key-figures/w/ks-he-23-001
Flyvbjerg, B., & Bester, D. W. (2021). The right projects built right: From the Iron Law of megaproject management to the Hiding Hand. Project Management Journal, 52(5), 474–497. https://doi.org/10.1177/87569728211014890
Flyvbjerg, B., & Gardner, D. (2023). How big things get done. Crown Currency.
Håkansson, A. (2023). Military mobility for Europe? How the Russia–Ukraine War changes the strategic rationale for military mobility. Defence Studies, 23(3), 436–456. https://doi.org/10.1080/14702436.2023.2213647
Hollweg, C. H., Smith, T., Taglioni, D., & Winkler, D. (2017). Services in global value chains: Driving competitiveness and innovation. World Bank. https://doi.org/10.1596/978-1-4648-0859-3
Kılınç, G., Kocabıyık, T., & Karaatlı, M. (2023). Baltic Dry Index estimation with NARX neural network model. Ekonomika, 102(1), 60–80. https://doi.org/10.15388/Ekon.2023.102.1.4
LSM English. (2025). Latvian government approves more cash for Rail Baltica. LSM.lv. https://eng.lsm.lv/article/economy/transport/11.02.2025-latvian-government-approves-more-cash-for-rail-baltica.a587356/
McCann, P. (2023). How have place-based policies evolved to date and what are they for now? Background paper for the OECD–EC High-Level Expert Workshop Series on “Place-Based Policies for the Future” (Workshop 1, 14 April 2023). OECD. https://www.oecd.org/content/dam/oecd/en/publications/reports/2023/04/how-have-place-based-policies-evolved-to-date-and-what-are-they-for-now_2b350aad/b80f3e4e-en.pdf
Ministry of Transport of Latvia. (2024). Rail Baltica projekta īstenošanai 2024. gadā plānots apgūt 174,7 miljonus eiro. SAM.gov.lv. https://www.sam.gov.lv/lv/jaunums/rail-baltica-projekta-istenosanai-2024-gada-planots-apgut-1747-miljoni-eiro (In Latvian)
Pagliara, F., Henke, I., Russo, L., & Guigon, M. (2022). Is high-speed rail a geographically inclusive system? Evidence from some European countries. Applied Spatial Analysis and Policy, 15(1), 241–263. https://doi.org/10.1007/s12061-021-09399-y
Park, D. W. (2021). A review of demand forecasting in transport and its implications for cost–benefit analysis. Journal of Transport Economics and Policy, 55(1), 1–21. https://doi.org/10.1920/jtep.2021.1.1
Rail Baltica. (2024). Rail Baltica global cost-benefit analysis (Executive Summary). RB Rail AS. https://www.railbaltica.org/wp-content/uploads/2025/07/RB_CBA_EXECUTIVE_SUMMARY_0405-1.pdf
State Audit Office of Latvia. (2018). Rail Baltica – Audit summary (Financial Audit Summary No. 2.4.1-15/2018).https://www.lrvk.gov.lv/en/getrevisionfile//uploads/Majaslapa %20ENG/Audit%20report/2018/2.4.1-15_2018/Rail_Baltica_audit_summary.pdf
State Audit Office of Latvia. (2024). Review on the Rail Baltica project (Financial audit summary No. 2.4.1-44/2023). https://www.lrvk.gov.lv/en/audit-summaries/audit-summaries/review-on-the-rail-baltica-project
Voitko, S., Naraievskyi, S., & Trofymenko, O. (2022). Development of energy supply infrastructure based on Industry 4.0 (on the example of Ukraine and Turkey). Ekonomika, 101(2), 70–91. https://doi.org/10.15388/Ekon.2022.101.2.5
Yeboah, E. (2024). The effect of foreign direct investment, domestic investment, and trade on economic growth: Evidence from the Baltic countries. Ekonomika, 103(4), 129–150. https://doi.org/10.15388/Ekon.2024.103.4.8
Zeibote, Z., Balodis, J., Kokarēviča, A., Kudiņš, J., & Čižo, E. (2025). Transportation efficiency in Latvia in the context of economic productivity and environmental sustainability. In I. Kabashkin et al. (Eds.), RelStat 2024, LNNS 1337 (pp. 638–648). https://doi.org/10.1007/978-3-031-87532-8_57