Ekonomika ISSN 1392-1258 eISSN 2424-6166
2026, vol. 105(3), pp. 118–134 DOI: https://doi.org/10.15388/Ekon.2026.105.3.7
Gintarė Barišauskaitė
Department of Economics
Vytautas Magnus University
K. Donelaičio st. 52, Kaunas, Lithuania
https://ror.org/04y7eh037
Email: gintare.barisauskaite@stud.vdu.lt
Orcid: https://orcid.org/0009-0000-3672-7883
Akvilė Aleksandravičienė
Doctor of Social Sciences
Department of Economics
Vytautas Magnus University
K. Donelaičio st. 52, Kaunas, Lithuania
https://ror.org/04y7eh037
Email: akvile.aleksandraviciene@vdu.lt
Orcid: https://orcid.org/0000-0003-4882-5602
Abstract. This article uses cluster analysis to examine changes in average monthly gross wages (AMGW) by economic activity in the Baltic States and uses econometric analysis to investigate the impact of macroeconomic factors on wages in Lithuania. Previous studies have provided limited comparative data on wage differentiation by economic activity in the Baltic States, particularly at the macro level. Thus, this study aims to evaluate wage disparities by economic activities and determine the primary macroeconomic determinants of wages in Lithuania. The study employs hierarchical and comparative cluster analysis, as well as OLS regression.
The results show that changes in AMGW by economic activity are significantly influenced by national economic conditions, policy decisions, and institutional factors. In Baltics, the highest wages are in the finance and insurance sector, as well as in information and communication activities. While the Baltic countries share some common wage patterns, cluster analysis reveals significant differences between countries. Econometric results indicate that wages in Lithuania are significantly impacted by unemployment, economic growth, and inflation. These results underscore the importance of sector-specific wage policies, improved alignment of labour supply and demand, and wage-setting mechanisms that consider inflation dynamics and productivity growth.
Keywords: average wage, GDP, inflation, NACE, unemployment.
_________
Received: 20/01/2026. Accepted: 01/06/2026
Copyright © 2026 Gintarė Barišauskaitė, Akvilė Aleksandravičienė. Published by Vilnius University Press. This is an Open Access article distributed under the terms of the Creative Commons Attribution License, which permits unrestricted use, distribution, and reproduction in any medium, provided the original author and source are credited.
Wages are one of the most important macroeconomic and social indicators, reflecting a country’s economic conditions, labour market structure, household income levels, standards of living and overall population well-being. The level of wages and their changes have a significant impact on consumption possibilities, income distribution, and the risk of poverty. Therefore, wage analysis is an important part of labour market and economic policy research (Arranz & Garcia-Serrano, 2025). Recent studies indicate that wage differentials across economic activity sectors remain substantial and often reflect deeper structural differences in labour markets as well as variations in sectoral productivity (Hamilton & Vries, 2025). In addition to sectoral differences, wage developments are also influenced by broader macroeconomic conditions. Economic growth, changes in unemployment and inflation affect both nominal and real wages (Chen & Yao, 2025). In small, open economies, such as those of the Baltic States, wages are sensitive to macroeconomic fluctuations.
Most studies on wages focus on individual and firm-level factors. Researchers often examine employee characteristics, such as education, experience, and gender, as well as company features, such as size and industry (Wisen, 2022). Although macroeconomic factors, such as unemployment, gross domestic product (GDP), inflation, etc., are occasionally mentioned, they are rarely analysed empirically. Thus, despite the abundance of micro-level studies, two gaps remain. First, very few studies in the Baltic States compare wages across economic activities using NACE (Nomenclature of Economic Activities) classifications, even though economic activity greatly affects pay differences. Second, the effect of macroeconomic factors on wages is rarely studied directly in Lithuania, as most research focuses on employees or firms rather than the entire economy. In the case of Estonia and Latvia, the relationship between wages and macroeconomic factors has already been examined in scientific studies. This study addresses these gaps by examining two dimensions: (1) wage disparities across economic activities in the Baltic States using cluster analysis, and (2) the impact of macroeconomic factors on wages in Lithuania using an econometric technique. This dual approach allows for an assessment of both employer-related (sectoral) and macroeconomic determinants of wages, providing added scientific value by integrating two analytical levels commonly examined separately in the literature.
The goal of this study is to evaluate wage differentiation across economic activities in the Baltic States and to determine the effect of macroeconomic factors on wages in Lithuania.
The findings depict clear sectoral wage differentiation in the Baltic States and confirm, that GDP per capita increases average wages in Lithuania, while unemployment and inflation reduce them. The results of this research may be useful for shaping wage policy, assessing sectoral competitiveness, and analysing labour market developments in the region.
Wages are not only a form of remuneration for work performed but also a key factor determining individuals’ economic security, living standards and social inclusion. Adequate wage levels contribute to employee’s well-being, motivation and productivity, while insufficient wages may increase the risk of poverty and social exclusion. At the macroeconomic level, wages play an important role in shaping aggregate demand, labour supply and income distribution, which makes them a central object of labour market and economic policy analysis. In scientific research, the average wage (AW) is frequently used, as it reflects the compensation an employee receives over a specific period. The different definitions and calculations of AW are provided by Lavetti (2023), Oneh and Samsu (2023), etc.
Factors influencing wages are a frequently examined topic. Wages may be influenced by various economic, social, political, and organizational factors. Employee characteristics, such as qualifications, experience, education, and the nature of work - remain among the most important determinants of wages. Empirical research shows that education and qualifications have a positive effect on earnings (OECD, 2021). Cross country analyses indicate that higher education provides a wage premium, but its size strongly depends on the profession. More recent studies highlight that formal education alone is no longer sufficient for higher earnings, as practical skills and specific competencies have become increasingly important, especially in technology-intensive fields (Mishel, 2022). This suggests that success in the labour market is influenced more by the ability to apply knowledge than by the highest level of education achieved.
Labour market studies also show that educational mismatch, being overqualified or underqualified for a job, can negatively affect wages (Montt, 2017). Thus, wage growth depends not only on acquiring higher education but also on the alignment between employee skills and job requirements. In few cases, vocational and technical education may provide equal or even greater earning potential than traditional academic pathways, particularly where the labour market faces skill shortages (Kemper et al., 2025). Thus, the higher the level of qualifications and the better the match between competencies and job tasks, the higher the likelihood of receiving a higher wage.
Employer characteristics are also an important determinant of wages. These include company size, sector, competitive environment, and internal organizational practices. Analyses of European data reveal more pronounced wage differentiation in large firms: they tend to pay higher wages to highly qualified employees and managers, increasing internal wage inequality (Zwysen, 2022). Conversely, smaller firms, especially those operating in highly competitive markets, often face financial constraints and cannot offer comparable wage levels. Studies of the Baltic region also confirm that larger companies pay higher AW, but they also have greater wage disparities across employee groups (Hazans et al., 2025). Thus, firm size is associated not only with wage levels but also with the internal wage structure.
Economic conditions also affect wages. These mostly include inflation, unemployment, and long-run economic development. Economic expansion typically increases labour demand, which can raise wages. However, inflation can reduce real wages when prices increase faster than income. Inflation also widens wage inequality, especially among the lowest-paid workers (Mishel & Bivens, 2021). Pinheiro and Yang (2020) examined inflation’s impact on wages and found that wages declined after the 2008–2009 financial crisis and they were not fully restored despite improvements in economic growth and unemployment. They also observed that wage growth was more strongly associated with inflation than with productivity. Westermark (2019) also found that persistently high inflation exerts pressure to increase wages, as workers require compensation for rising living costs, whereas low and stable inflation contributes to wage stability. Thus, inflation directly affects wages by reducing workers’ purchasing power and lowering real wage levels.
An additional dimension of wage analysis concerns sectoral differences. Wages can be compared across the public and private sectors or across economic activities classified under systems such as NACE. Although still limited, existing studies allow for certain insights. In many European countries, public sector employees tend to earn higher wages than those in the private sector, especially among lower-skilled workers (Sławinska, 2021). However, this varies by institutional context. In contrast, studies from African countries by Ekpeyong (2023) show that the private sector sometimes offers higher wages, though gender inequality is more pronounced, particularly in low-skilled occupations. Sectoral analyses using the NACE classification consistently reveal gender wage gaps in near all economic activities. Using European firm-level data, Sliwicki (2025) found persistent gender wage disparities even in high-tech and public service sectors. Sector-based wage differences are also evident in average earnings. Parker et al. (2023) found that the highest wages are in the information, communication, and professional services industries, while the lowest wages are in the education, social services, and accommodation industries. The results of Zwysen (2024) show a different pattern: wages were highest in construction and energy, whereas information and communication technology sector did not experience strong wage growth. These findings suggest that wages vary across sectors, and each country may develop a unique wage structure depending on economic conditions, sector competitiveness, and labour market dynamics.
In summary, wages play a significant role in shaping individuals’ living standards, labour market outcomes, and overall economic performance. There are a number of factors that impact wages. Most existing studies focus on micro-level determinants, while macro-level wage determinants are less frequently analysed, indicating a research gap. A deeper understanding of wage formation mechanisms can contribute to more effective wage policy development and improved labour market functioning.
A literature review revealed that number of factors affect wages, including both employee and employer characteristics, as well as economic conditions. One employer-related factor that is rarely analysed in scientific research is the type of economic activity in which a company operates. Another crucial factor affecting wages is the broader economic environment. However, studies examining macro-level determinants of wages remain scarce. This gap provided the basis for a study incorporating both perspectives. Due to the lack of detailed economic activity data in statistical databases, it is not possible to perform a regression analysis of wage determinants according to NACE Rev. 2 classifications. For this reason, the study consists of two components: (i) a cluster-based comparative analysis of wages across economic activities in the Baltic States, and (ii) an econometric analysis of the main factors influencing wages in Lithuania. A cluster-based comparative analysis of wages by economic activity at sections level in all three Baltic States–Estonia, Latvia, and Lithuania–provides a more accurate assessment of a country’s wage structure. Additionally, examining macro-level determinants helps determine whether factors that influence wages in other countries also affect wages in Lithuania. The econometric analysis focuses exclusively on Lithuania to address a clear research gap identified in the literature. Previous empirical studies conducted in Estonia and Latvia have analysed the impact of macroeconomic factors, such as unemployment, economic development, and inflation, on wage dynamics (Kolar & Fir, 2024).
Thus, this research is relevant because there are no existing studies comparing the average monthly gross wages of the Baltic States by NACE classification. The econometric component is also important, as wage research in Lithuania typically focuses on micro-level factors (see research performed by Beržinskienė & Raziulytė (2013)), rather than macroeconomic determinants. This study aims to examine the factors influencing AMGW from two perspectives: employer characteristics in the Baltic States and economic conditions in Lithuania. From the employer’s perspective, the key characteristic under analysis is the company’s economic activity. The cluster analysis identifies similarities and differences in AMGW across economic activities and countries. Econometric analysis evaluates the impact of unemployment, inflation, and GDP on AW in Lithuania.
The research questions are the following:
The study uses data on AMGW by NACE for Lithuania, Latvia, and Estonia obtained from the official statistics portals of each country, i.e., Statistics Lithuania (2025), Official Statistics of Latvia (2025), and Statistics Estonia (2025). This study uses the most recent available data spanning twelve time series entries from 2010 to 2021 for cluster analysis. It is important to note that not all countries provide these data from 2022. The data used for econometric analysis are collected from international sources, such as OECD (2025), the World Bank (2025a, 2025b), and Eurostat (2025). The dataset contains observations from 1995 to 2024. The selected period reflects the most recent available data for all indicators up to 2024. Data on all the economic factors included in the econometric analysis are not provided by economic activities in Lithuania; thus, an analysis by economic activity is not possible.
This study conducts a comparative analysis of AMGW in Lithuania, Latvia, and Estonia across different economic activities (section level), based on the NACE Rev. 2 classification used in the European Union to categorize economic activities (for more information on classification see Eurostat (2008)). To identify which economic activities are most similar in terms of AMGW, a cluster analysis is applied. This analytical technique groups objects into clusters according to their similarity–elements within the same cluster are more similar to each other than to elements in other clusters (Han et al., 2023).
The clustering process consists of the following key steps: selecting objects and variables, determining a similarity measure, forming clusters, and evaluating the results (Everitt & Hothorn, 2011). As the dataset used in this study consists of only 19 economic activities per country, a hierarchical clustering method was chosen as the k-means method is only recommended for larger datasets (n>300) (Jain, 2010). In this approach, each economic activity initially forms its own individual cluster, which is then progressively merged with the nearest cluster based on their proximity. This process continues until all activities are combined into a single hierarchical structure (Murtagh & Contreras, 2011). The resulting structure is presented in a dendrogram, which illustrates the similarities and differences among activities visually. The number of clusters is determined by examining the shape and height of the dendrogram’s merging points (Jain, 2010).
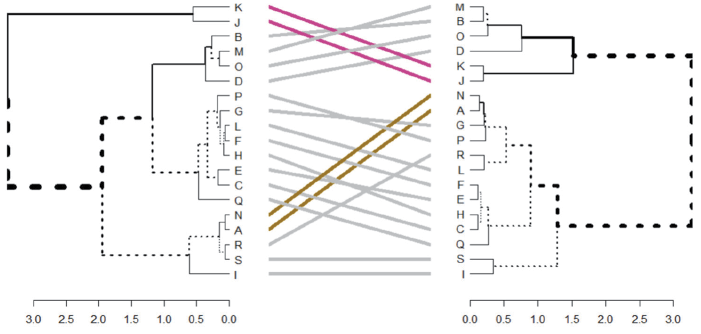
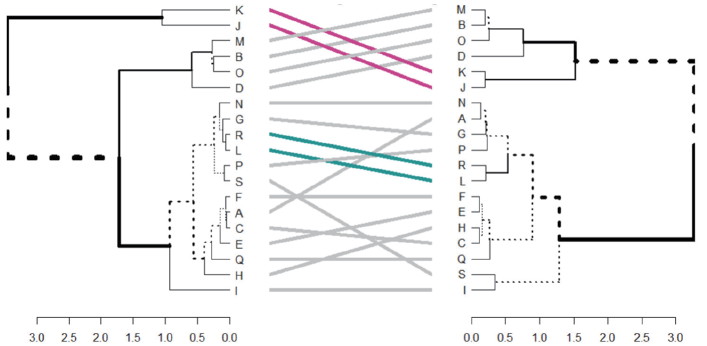
In addition to individual country analyses, a comparative cluster analysis is performed. This involves comparing dendrograms between two countries to determine whether economic activities are grouped similarly. The height values shown at the bottom of the dendrogram indicate similarity: the lower the height, the more similar the wage structure of the activities (Jain, 2010). Similarities and differences between countries are marked with coloured, dashed lines to help identify which activities form identical or different clusters.
Thus, this study uses cluster analysis to reveal intra-country wage differences and cross-country similarities and discrepancies in economic activities according to the NACE classification.
The aim of the regression analysis is to assess the impact of economic factors on AW. Table 1 provides a description of the variables used in this study.
|
Variable |
Abbreviation |
Indicator |
|
Average wage |
AW |
Average annual wage ($) |
|
Unemployment |
UR |
Unemployment rate (% of total labour force) |
|
Inflation |
INF |
Consumer price index (2010 = 100) |
|
Long-run economic development |
GDP |
Real gross domestic product per capita (EUR) |
Source: Prepared by the authors
Economic research highlights that the unemployment rate significantly affects both individual earnings and the AW at the national level. Meixnerova and Krajnak (2020) demonstrates that unemployment is significantly associated with changes in the AW. Regarding inflation, studies also show that it has a statistically significant impact on AW. The results indicate that nominal wages respond to price level dynamics, which highlights the role of inflation in shaping average wage movements (Meixnerova & Krajnak, 2020). Economic development increases AW (Heathcote et al., 2008). Przekota et al. (2023) proved a lagged effect between these phenomena. Unemployment, inflation, and GDP per capita are among the principal macroeconomic factors shaping average wage dynamics.
Based on the literature review, the following research hypotheses are formulated:
H1: Inflation has a positive effect on AW.
H2: Rising unemployment reduces AW.
H3: Economic development has a positive effect on AW.
The effect of economic factors on AW is assessed using a multiple regression model estimated by the ordinary least squares method. The following regression model controls for the financial crisis and COVID pandemic:
AWt = a + b1URt + b2INFt + b3GDPt + b4GDPt-1 + b5COVIDt + b6CRISISt + εt, (1)
where: AW is the dependent variable, i.e. average wage; UR is the unemployment rate; INF is the annual inflation rate; GDP is real gross domestic product per capita; COVID is a dummy variable representing COVID-19 pandemic; CRISIS represents a dummy variable for financial crisis (2008-2009); a is the intercept; b₁, b₂ and b3 are coefficients showing the expected change in the dependent variable when any of the explanatory variables on the right side of the regression model increases by one unit; t represents time; t-1 represents a one year lag; and εₜ is the error term (Hyndman & Athanasopoulos, 2018).
To obtain reliable results, several diagnostic tests are applied. The stationarity of the variables is assessed using the Augmented Dickey-Fuller (ADF) unit root test. This test is employed to determine whether time series contains a unit root and is therefore non-stationary (Wooldridge, 2009). The null hypothesis states that a variable has a unit root and is non-stationary, while the alternative hypothesis indicates that it is stationary. For non-stationary variables, dynamic measures are constructed as four-year changes, while static variables were constructed as four-year averages. Salles et al. (2019) and Coulombe and Klieber (2026) provide in-depth descriptions of these approaches. Outliers are identified using standardized residuals (SR) method. An observation is an outlier if |SR| > 3 (Hyndman & Athanasopoulos, 2018). Since regression requires normally distributed residuals, the Jarque-Bera test is applied. The hypotheses tested are the following: H₀: the residuals are normally distributed; H₁: the residuals are not normally distributed. The decision rule is as follows: if the p-value is greater than 0.05, we fail to reject H0; if p-value is less than or equal to 0.05, we reject H0, indicating a deviation from normality (Thadewald & Buning, 2004). It is also important to check for multicollinearity. This assumption is tested using the Variance Inflation Factor (VIF): values between 1 and 5 show weak correlation; values above 5 indicate strong multicollinearity (Daoud, 2017). Since the research analyzes time series data, it is also important to test for autocorrelation. The Durbin–Watson statistic is used to test for this. A value around 2 indicates no autocorrelation, values <1 or >3 suggest positive or negative autocorrelation. The overall model significance is evaluated using the F-test, while the significance of individual coefficients is evaluated using Student’s t-test. The coefficient of determination (R2) and the adjusted coefficient of determination (adjusted R2) are also examined. The former shows the proportion of variation in the dependent variable that is explained by the independent variables. Values range from zero to one; the closer to one, the better the model is. Adjusted R² corrects the standard R² for the number of predictors in the model and the sample size (Hyndman & Athanasopoulos, 2018).
After conducting hierarchical cluster analysis, the economic activities of Lithuania, Latvia, and Estonia were grouped according to similarities in AMGW.
In Lithuania, two high-wage economic activities, i.e., J (Information and communication) and K (Financial and insurance activities) form the first cluster, as both recorded the highest and fastest-growing wages over 2010–2021. I (Accommodation and food services) economic activity stands out as a separate cluster due to exceptionally low wages and a wage decline in 2019, caused by pandemic-related restrictions on hospitality services. Other economic activities tend to cluster into groups with similar wage levels and growth trends. These clusters are influenced by factors, such as labour shortages, COVID-19 impacts, increases in minimum wages, bonuses, and changes to tax regulations (Eurofound, 2021). Overall, Lithuania is characterised by two high-wage economic activities (J and K) and one uniquely low-wage and volatile economic activity (I).
In Latvia, three economic activities–J, K, and I–also appear to be distinct from all others. The economic activity I show the lowest wage levels and experienced a decline in 2020. J and K remain the highest wage economic activities; although K has the highest wage level, J demonstrates faster wage growth. Medium-wage economic activities, such as B, D, M, O, form a separate cluster, while the remaining activities are grouped together due to similar wage patterns, shaped by changes in the national minimum wage (Keirane & Šagejeva, 2024). Thus, Latvia has two clearly high-wage economic activities (J and K) and one persistently low-wage activity (I).
In Estonia, the lowest-wage cluster consists of I (Accommodation and food services) and S (Other service activities), where wages began just above €500 in 2010 and grew modestly over the period. The I economic activity also experienced a wage decline in 2020. A second cluster includes Q, C, H, E, and F, all showing similar wage growth of around €700 during the period. Other medium-wage sectors form additional clusters with only minor differences between them. As in the other Baltic States, J and K stand out: wages in these economic activities were already above €1000 in 2010 and approached €3000 by 2021, far exceeding those in all other sectors.
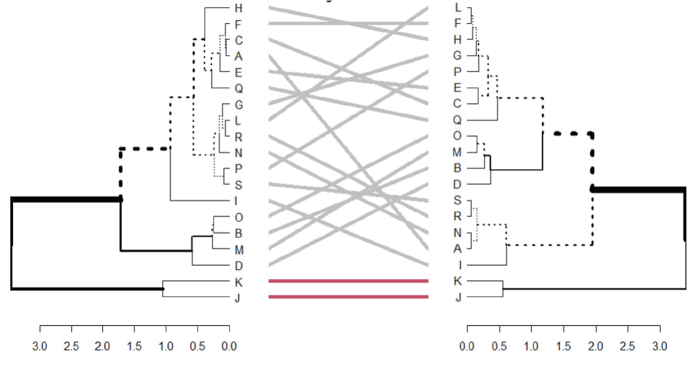
For a comparative analysis of AMGW in Lithuania, Latvia, and Estonia across different economic activities, the dendrograms of the three countries are compared to identify similarities and differences in AMGW by NACE classification. The dendrograms are compared pairwise, and therefore each figure displays information for two countries at a time.
Figure 1 presents the comparative cluster analysis for Latvia and Lithuania.
Source: Prepared by the authors
The results show one clear similarity between the two countries: a matching cluster consisting of J and K activities, both of which form a distinct high-wage group. Closer examination also reveals several economic activities that, though not connected by solid lines, fall into the same broader cluster in both countries. These include B (Mining and quarrying), D (Electricity, gas, steam, and air conditioning supply), M (Professional, scientific, and technical activities), and O (Public administration and defense; compulsory social security). These economic activities are assigned to different sub-clusters, which is why they are not highlighted as direct similarities. However, the fact that they are placed within the same overall cluster in both Latvia and Lithuania suggests that their wage patterns are comparable. Thus, the analysis indicates that Latvia and Lithuania share two clusters with matching structures, meaning that the corresponding economic activities show similar AMGW trends in both countries.
Figure 2 presents the comparative cluster analysis of Lithuania and Estonia.
Source: Prepared by the authors
Source: Prepared by the authors
A situation like the Latvia–Lithuania comparison is observed when comparing these countries. Both in Lithuania and Estonia, identical cluster separation appears for J and K activities. A comparable pattern is also found for the cluster including economic activities B, D, M and O: although the initial grouping differs slightly, both countries assign these activities to the same cluster, indicating only minor differences in their wage levels. Figure 2 further reveals strong similarities between agriculture, forestry and fishing (A) and administrative and support service activities (N). In both Lithuania and Estonia, these sectors demonstrate comparable AMGW. Thus, based on the cluster analysis results most economic activities in Lithuania and Estonia show similar wage structures.
Figure 3 presents the comparative cluster analysis of Latvia and Estonia. Here again, activities J and K form similar clusters in both countries. The same applies to activities B, D, M and O, which are grouped together in both instances. Notably, real estate activities (L) and arts, entertainment and recreation (R) consistently fall into the same cluster from the very beginning of the grouping process. In both Latvia and Estonia, these sectors are characterised by low wage levels compared to other economic activities. In summary, the comparative cluster analysis of Latvia and Estonia indicates that the two countries share significant similarities in their wage structures across NACE categories.
Overall, the analysis indicates that while the Baltic states share certain common patterns, they also demonstrate more differences than similarities, due to variations in economic policy and wage structures within each country.
The results of stationarity analysis revealed that inflation should be analysed in differences (changes). The next step in the econometric analysis was to check for outliers using standardized residuals. The results showed no outliers. The normality test revealed no reason to reject the null hypothesis that the residuals follow a normal distribution. Multicollinearity as well as autocorrelation (Durbin-Watson statistic is equal to 1.11) problems were not detected. The estimated model with twenty-six observations is the following:
AW = 10691.50 – 387.19 × UR + 2.08 × GDP + 223.15 × ∆INF + 0.36 ×
GDP(t-1) – 1149.65 × COVID + 1515.98 × CRISIS (2)
The constructed model is statistically significant according to the F-test (p-value<0.05). The p- values for UR, GDP, INF, and CRISIS are all below 0.1, indicating that these variables are statistically significant at the 90% level of confidence based on a Student’s t-test. The detailed results of the model are provided in Table 2. Based on these results, all proposed hypotheses are confirmed. H1 is confirmed as inflation was found to have a statistically significant and positive effect on AW. H2 and H3 are also supported, confirming that unemployment negatively affects AW, while GDP has a positive impact on AW. By interpreting the latter results as elasticities (E) using the formula E = b × (mean of independent variable/mean of dependent variable), it can be concluded that a 1% increase in unemployment is associated with a decrease in AW of about 0.13%, and a 1% increase in GDP is associated with an increase in AW of around 0.67%.
|
Variable |
Coefficient |
Standard Errors |
t-test |
|
Constant |
10691.50 |
1585.86 |
6.74 |
|
Unemployment |
-387.19 |
80.73 |
-4.80 |
|
Inflation |
223.15 |
76.53 |
2.92 |
|
Long-run economic development |
2.08 |
0.90 |
2.30 |
|
Long-run economic development (lagged) |
0.37 |
0.91 |
0.40 |
|
COVID |
-1149.65 |
869.62 |
-1.32 |
|
CRISIS |
1515.98 |
635.24 |
2.39 |
Source: Prepared by the authors
The coefficient of determination of the model is 0.9269, and the adjusted coefficient of determination is 0.9259. These high coefficients are because the analysed macroeconomic variables move together during business cycles; consequently, they explain almost all variation in wages. Additionally, the small sample size is another probable reason for the high coefficient of determination, as the model closely fits the limited data. One more limitation of the study is the potential endogeneity of GDP and average wages. While the model is designed to capture the effect of GDP on wages, higher wages can also stimulate economic growth by increasing consumption and aggregate demand. If GDP is correlated with the error term, this reverse causality may lead to biased coefficient estimates. Finally, small number of observations limits the degrees of freedom and potentially reduces statistical power. However, the small sample size reflects the use of annual macroeconomic data, which is common in empirical research.
The findings of this study align with empirical research on wage determinants. Although there are no published studies comparing the Baltic countries’ sectoral wages by NACE classification, parallels can be drawn with international sector-level analyses. Recent work by Parker et al. (2023) shows that the information and communication sector consistently exhibits the highest wage levels in advanced economies, which corresponds to the situation observed in Estonia and, in more recent years, in Lithuania and Latvia. Meanwhile, research by Lindley and McIntosh (2017) indicates that wages in education and social services tend to grow slowly and remain below the national average, a trend that partially matches the modest wage increase observed in these sectors across the Baltics. Studies on Belgium and the Netherlands (Zwysen, 2024; Masters et al., 2022) found that construction wages are not among the highest despite labour shortages, which is consistent with the results of this study, where construction did not stand out as a high-wage sector in any Baltic country.
Turning to the econometric results, the negative effect of unemployment on the AW found in this study matches recent empirical findings. Marcus and Sant’Anna (2021) demonstrate that higher unemployment reduces workers’ bargaining power and leads to slower wage growth, while C. D. Romer and D. H. Romer (2022) highlight similar patterns across U.S. labour markets. The positive relationship between GDP and wage levels corresponds to contemporary macroeconomic research, which finds that economic development increases labour demand and raises wage levels (Ganong & Noel, 2022; Pereira et al., 2025). Finally, the results indicate that inflation has a positive effect on AW. Similar conclusions are reported in empirical literature. Nektarios and Kyriaki (2024) find that wages exhibit a positive response to overall inflation, suggesting that increases in the general price level are associated with upward adjustments in wages.
Overall, the results of this study are consistent with the direction of effects identified in recent international research: unemployment suppresses wages, GDP and inflation increases wages. Meanwhile, comparisons of economic activities reflect similar cross-country patterns reported in the latest literature.
Review of recent scientific literature shows that wage formation is influenced by a combination of worker characteristics, employer attributes, and broader macroeconomic conditions. Contemporary studies published between 2021 and 2024 emphasize the growing importance of sectoral specificity, technological intensity, labour demand, and skill mismatches in shaping wage dispersion. Research also highlights that the relationship between macroeconomic indicators—such as unemployment, inflation, and GDP—and wages has become more complex in the post-pandemic period, but the overall direction of these effects remains consistent: economic development supports wage growth, inflation raises wages, while higher unemployment tends to suppress earnings. These tendencies provided a solid theoretical basis for the empirical analysis conducted in this study.
The cluster analysis conducted for Lithuania, Latvia and Estonia revealed clear wage differentiation across economic activities and demonstrated that the structure of wages varies across the Baltic region. Despite these differences, all three countries share a stable pattern: J and K consistently form high-wage clusters and stand apart from all other economic activities, confirming their high productivity and skill intensity. Conversely, I is among the lowest-paid economic activities in all countries and shows the strongest sensitivity to economic shocks, particularly during the COVID-19 pandemic. Although minor similarities in cluster composition were identified, such as the grouping of certain administrative, public sector, and technical activities, the overall wage structures differ across countries due to national labour market policies, industrial composition, and different sectoral dynamics. These results demonstrate that sector-level wage patterns cannot be generalised uniformly across the Baltic region, even though certain high- and low-wage activities follow similar trends.
The econometric analysis for Lithuania confirmed the statistically significant impact of the examined macroeconomic variables on average wages. The negative coefficient for unemployment indicates that higher unemployment leads to lower wage growth, whereas the positive coefficients for GDP and inflation suggest that long-run economic development and rising price levels contribute to increases in average wages. These findings align closely with the most recent international empirical studies, which also document a negative relationship between unemployment and wages. Overall, the results affirm that macroeconomic developments play a crucial role in shaping wage dynamics in Lithuania, and that the patterns observed in this study are consistent with broader international evidence.
The results of this study have important practical implications for labour market policy and wage-setting practices in the Baltic States. The observed sectoral wage clustering and heterogeneity across countries suggest that wage policies should be designed at the sectoral level rather than at the aggregate level. Uniform wage-setting measures may have uneven effects across economic activities, particularly in low-wage and economically vulnerable sectors such as accommodation and food services. In general, sectoral composition is a key driver of wage levels.
The analysis for Lithuania highlights the importance of macroeconomic conditions in wage formation. The negative effect of unemployment on AW indicates a need for policies that support employment and improve labour market matching, while the positive impact of inflation on wages suggests that wage-setting systems partially reflect price increases. This underscores the relevance of wage-setting systems that better reflect inflation dynamics and incorporates inflation expectations. The positive relationship between GDP and wages confirms that long-run economic development remains a key driver of wage increases. Policies aimed at enhancing productivity, increasing investment in high-productivity sectors and infrastructure, and supporting sustainable economic development, may therefore contribute to long-term wage growth. Finally, the significant impact of the financial crisis variable indicates that macroeconomic shocks can significantly affect wages in Lithuania. Therefore, it is important to implement policies that improve economic resilience and labour market stability during economic downturns. Future research could extend the dataset and apply alternative econometric methods. It could also analyse real wages instead of nominal wages and include other variables that affect wages.
Arranz, J., M., & Garcia-Serrano, C. (2025). Assessing the impact of an increase in the minimum wage on household income and poverty. Social Science Research, 127, 103143. https://doi.org/10.1016/j.ssresearch.2025.103143
Beržinskienė, D., & Raziulytė, S. (2013). Darbo užmokesčio diferenciacija Lietuvos darbo rinkoje [Wage differentiation in the Lithuanian labour market]. Studies in Contemporary Society, 4(1), 9–21. https://www.lituanistika.lt/content/47506
Chen, Y., & Yao, J. (2025). Minimum wage and employment: Sectoral and regional perspectives. IMF Working Papers, 2025(241), Article A001. https://doi.org/10.5089/9798229030779.001.A001
Coulombe, P. G., & Klieber, K. (2026). An adaptive moving average for macroeconomic monitoring. Economic Letters, 259, 112773. https://doi.org/10.1016/j.econlet.2025.112773
Daoud, J. I. (2017). Multicollinearity and regression analysis. Journal of Physics: Conference Series, 949(1), 012009. https://doi.org/10.1088/1742-6596/949/1/012009
Ekpeyong, P. (2023). Gender pay gap and employment choice in Nigeria. MPRA Paper No. 118315. https://mpra.ub.uni-muenchen.de/118315/
Eurofound. (2021). Impact of the COVID-19 crisis on wages and wage setting. https://www.eurofound.europa.eu/en/publications/all/impact-covid-19-crisis-wages-and-wage-setting?utm_source=chatgpt.com
Eurostat. (2008). NACE Rev. 2 - Statistical classification of economic activities. https://ec.europa.eu/eurostat/web/products-manuals-and-guidelines/-/ks-ra-07-015
Eurostat. (2025). Real GDP per capita (Lithuania). https://ec.europa.eu/eurostat/databrowser/view/tipsna40/default/table?lang=en
Everitt, B., & Hothorn, T. (2011). An introduction to applied multivariate analysis with R. Springer. https://doi.org/10.1007/978-1-4419-9650-3
Ganong, P., & Noel, P. (2022). Why do borrowers default on mortgages? The Quarterly Journal of Economics, 138(2), 1001–1065. https://doi.org/10.1093/qje/qjac040
Hamilton, C., & Vries, G. J. D. (2025). The structural transformation of transition economies. World Development, 191, 106977. https://doi.org/10.1016/j.worlddev.2025.106977
Han, J., Kamber, M., & Pei, J. (2023). Data Mining: Concepts and Techniques. 4th Ed. Elsevier Inc.
Hazans, M., Holmen, R. B., Upenieks, J., & Žabko, O. (2025). STEM-oriented secondary education in Latvia: Spatial inequalities in access and achievements. Regional Studies, Regional Science, 12(1), 682–702. https://doi.org/10.1080/21681376.2025.2525432
Heathcote, J., Storesletten, K., & Violante, G. L. (2008). The macroeconomic implications of rising wage inequality in the United States. Journal of Political Economy, 118, 14052. https://www.researchgate.net/profile/Kjetil-Storesletten/publication/5189045
Hyndman, R. J., & Athanasopoulos, G. (2018). Forecasting: Principles and practice, 2nd ed. OTexts.
Jain, A. K. (2010). Data clustering: 50 years beyond K-means. Pattern Recognition Letters, 31(8), 651–666. https://doi.org/10.1016/j.patrec.2009.09.011
Keirane, A., & Šagejeva, J. (2024). Latvian labour market under the microscope: Minimum wage impacts on income disparities across different occupations. SSE Riga Student Research Papers, 5(268), 1–63. https://www.sseriga.edu/sites/default/files/2024-09/5Paper_Keirane_Sagejeva.pdf
Kemper, J., Au Yong Lyn, A., McDonald, P., & Renold, U. (2025). Labor market outcomes of formal vocational education and training: A meta-analysis. Education Economics, 1–25. https://doi.org/10.1080/09645292.2025.2579799
Kolar, G., & Fir, N. (2024). Wage function estimation of Estonia and Latvia. Our Economy, 70(1), 34–49. https://doi.org/10.2478/ngoe-2024-0004
Lavetti, K. (2023). Compensating wage differentials in labor markets: Empirical challenges and applications. Journal of Economic Perspectives, 37(3), 189–212. https://doi.org/10.1257/jep.37.3.189
Lindley, J., & McIntosh, S. (2017). Sectoral wage growth and occupational change. Oxford Economic Papers, 74(2), 367–387. https://doi.org/10.1111/obes.12155
Marcus, M., & Sant’Anna, P. H. (2021). The role of parallel trends in event study settings: An application to environmental economics. Journal of the Association of Environmental and Resource Economists, 8(2), 235–275. https://doi.org/10.1086/711509
Masters, M. F., Gibney, R. F., & Albright, R. (2022). The financial status of national unions. Industrial Relations Journal, 53(4), 303–335. https://doi.org/10.1111/irj.12374
Meixnerova, L., & Krajnak, M. (2020). Macroeconomic time series affecting the minimum and average wages of V4 countries. E&M Economics and Management, 23(4), 4–22. https://doi.org/10.15240/tul/001/2020-4-001
Mishel, L. (2022). How automation and skill gaps fail to explain wage suppression or wage inequality. Industrial and Corporate Change, 31(2), 269–280. https://doi.org/10.1093/icc/dtac004
Mishel, L., & Bivens, J. (2021). The Productivity-Median Compensation Gap in the United States: The Contribution of Increased Wage Inequality and the Role of Policy Choices. International Productivity Monitor, 41, 61–97. http://www.csls.ca/ipm/41/IPM_41_Mishel.pdf
Montt, G. (2017). Field-of-study mismatch and overqualification: Labour market correlates and their wage penalty. IZA Journal of Labor Economics, 6(1), 2. https://doi.org/10.1186/s40172-016-0052-x
Murtagh, F., & Contreras, P. (2011). Algorithms for hierarchical clustering: An overview. WIREs Data Mining and Knowledge Discovery, 2(1), 86–97. https://doi.org/10.1002/widm.53
OECD. (2021). How does the earnings advantage from tertiary education vary by field of study? OECD Education Working Paper No. 250. https://www.oecd.org/content/dam/oecd/en/publications/reports/2021/01/how-does-earnings-advantage-from-tertiary-education-vary-by-field-of-study_60f20424/8a4b8f7a-en.pdf
OECD. (2025). Average wages (indicator). https://doi.org/10.1787/cc3e1387-en
Official Statistics of Latvia. (2025). Average monthly wages and salaries by kind of activity (in euro), 2005–2022. https://data.stat.gov.lv/pxweb/en/OSP_PUB/START__EMP__DS__DSV/DSV030/table/tableViewLayout1/
Oneh, C. O., & Samsu, S. H. (2023). An urban household living wage: An empirical overview. Quantum Journal of Social Sciences and Humanities, 4(6), 50–58. https://doi.org/10.55197/qjssh.v4i6.291
Parker, J., Arrowsmith, J., Young-Hauser, A., Hodgetts, D., Carr, S. C., Haar, J., & Alefaio-Tugia, S. (2023). Perceptions of living wage impacts in Aotearoa New Zealand: Towards a multi-level, contextualised conceptualisation. Personnel review, 52(4), 1233–1254. https://doi.org/10.1108/PR-01-2021-0037
Pereira, J., Ramos, R., & Martins, P. S. (2025). Wage cyclicality and labor market institutions. Industrial Relations: A Journal of Economy and Society, 64(4), 598–615. https://doi.org/10.1111/irel.12387
Pinheiro, R. B., & Yang, M. (2020). Revisiting wage growth after the recession. Federal Reserve Bank of Cleveland Economic Commentary, 2020(2). https://doi.org/10.26509/frbc-ec-202002
Przekota, G., Janowski, A., & Szczepanska-Przekota, A. (2023). Causality in the Relationship between Economic Growth and Compensation. Sustainability, 15(23), 16465. https://doi.org/10.3390/su152316465
Romer, C. D., & Romer, D. H. (2022). A social insurance perspective on pandemic fiscal policy: Implications for unemployment insurance and hazard pay. Journal of Economic Perspectives, 36(2), 3–28. https://doi.org/10.1257/jep.36.2.3
Salles, R., Bellozea, K., Porto, F., Gonzalez, P. H., & Ogasawara, E. (2019). Nonstationary time series transformation methods: An experimental review. Knowledge-Based Systems, 164, 274–291. https://doi.org/10.1016/j.knosys.2018.10.041
Sławinska, K. (2021). Public–private sector wage gap in a group of European countries: An empirical perspective. Empirical Economics, 60(4), 1747–1775. https://doi.org/10.1007/s00181-020-01841-3
Sliwicki, D. (2025). Gender wage inequalities in European Union countries. In E. Wędrowska, M. Goliński, T. Doligalski, & A. Ignasiak-Szulc (Eds.), Socioeconomic Inequality in Central and Eastern Europe: Multidisciplinary Perspectives on Regional Disparities (pp. 48–59). Routledge. ISBN 9781032898193
Stansbury, A., & Summers, L. (2020). The declining worker power hypothesis: An explanation for the recent evolution of the American economy. Brookings Papers on Economic Activity, Spring, 1–96. https://www.brookings.edu/wp-content/uploads/2020/12/StansburySummers-Final-web.pdf
Statistics Estonia. (2025). Average gross wages (salaries), labour cost, hours actually worked and number of employees by economic activity section (2002–2024, quarterly). https://andmed.stat.ee/en/stat/Lepetatud_tabelid__Majandus.%20Arhiiv__Palk%20ja%20toojeukulu.%20Arhiiv/PA001
Statistics Lithuania. (2025). Average monthly earnings in the national economy by economic activity.
https://osp.stat.gov.lt/statistiniu-rodikliu-analize?hash=95f48793-1dd8-49fd-b4a5-50cf3e3ffe99#/
Suthaharan, N., & Bleakley, J. (2022). Wage-price dynamics in a high-inflation environment: The international evidence. Reserve Bank of Australia. Bulletin, September, 51–60. https://www.rba.gov.au/publications/bulletin/2022/sep/wage-price-dynamics-in-a-high-inflation-environment-the-international-evidence.html
Westermark, A. (2019). How can various structural changes in the economy affect wages and inflation? Sveriges Riksbank Economic Review, 2019(2). https://www.riksbank.se/globalassets/media/rapporter/pov/artiklar/engelska/2019/191010/2019_2-how-can-various-structural-changes-in-the-economy-affect-wages-and-inflation.pdf
World Bank. (2025a). Unemployment rate (Lithuania). https://data.worldbank.org/indicator/SL.UEM.TOTL.NE.ZS?end=2022&locations=LT&start=1994&view=chart
World Bank. (2025b). Inflation, consumer prices (annual %). https://data.worldbank.org/indicator/FP.CPI.TOTL.ZG?locations=LT
Zwysen, W. (2022). Wage inequality within and between firms: Macroeconomic and institutional drivers in Europe. Working Paper 2022.02. European Trade Union Institute. https://www.etui.org/sites/default/files/2021-12/Wage%20inequality%20within%20and%20between%20firms-Macroeconomic%20and%20institutional%20drivers%20in%20Europe-2022.pdf
Zwysen, W. (2024). Sectoral wage structures and labour shortages: Evidence from Belgium. European Journal of Industrial Relations, 28(3), 321–339. https://www.econstor.eu/bitstream/10419/302238/1/1899209786.pdf
Thadewald, T., & Buning, H. (2004). Jarque-Bera test and its competitors for testing normality: A power comparison. Diskussionsbeiträge, No. 2004/9, Freie Universität Berlin, Fachbereich Wirtschaftswissenschaft, Berlin. https://www.econstor.eu/bitstream/10419/49919/1/668828234.pdf
Wooldridge, J., M. (2009). Introductory Econometrics. United States of America. https://commecsinstitute.edu.pk/wp-content/uploads/2024/08/IntroductoryEconometrics_AModernApproach_FourthEdition_Jeffrey_Wooldridge.pdf
Nektarios, A., M., & Louca, K., G. (2024). Wages and inflation in the Euro Area. CESifo Economic Studies, 70(4), 474–485. https://doi.org/10.1093/cesifo/ifae014