Ekonomika ISSN 1392-1258 eISSN 2424-6166
2026, vol. 105(3), pp. 58–76 DOI: https://doi.org/10.15388/Ekon.2026.105.3.4
Ozan Özdemi̇r*
Assoc. Prof. Dr.
Süleyman Demirel University, Department of Finance and Banking, Türkiye
ROR ID: https://ror.org/04fjtte88
E-mail: ozanozdemir@sdu.edu.tr
ORCID: https://orcid.org/0000-0002-7579-9422
Gökhan Özkul
Assoc. Prof. Dr.
Süleyman Demirel University, Department of Finance and Banking, Türkiye
ROR ID: https://ror.org/04fjtte88
E-mail: gokhanozkul@sdu.edu.tr
ORCID: https://orcid.org/0000-0001-7545-8292
Özen Akçakanat
Assoc. Prof. Dr.
Süleyman Demirel University, Department of Finance and Banking, Türkiye
ROR ID: https://ror.org/04fjtte88
E-mail: ozenakcakanat@sdu.edu.tr
ORCID: https://orcid.org/0000-0002-7223-3028
Abstract. The sustainability of financial stability in the banking system is subject to the management of credit risk and the maintenance of the asset quality. The research study aims to analyze the ratios of non-performing loans in relation to the 27 member countries of the European Union (EU) during the period of 2014–2024 with the application of machine learning techniques. The originality of the study is embedded in the development of an integrated and comprehensive framework that does not confine credit risk to macroeconomic variables but also considers bank-specific variables, financial inclusion, and financial depth. During the analysis, the performance of the Support Vector Regression (SVR), Multi-Layer Perceptron (MLP), Extra Trees (ET), and Gradient Boosting (GB) algorithms was tested. From the analysis, it was evident that the SVR model offers the highest prediction accuracy. The results of feature significance analysis indicate that labor market variables, such as unemployment and employment, and return on equity (ROE), are critical variables for risk formation. Moreover, it has been identified that the use of financial inclusion and institutional structure variables enhances the model’s predictive capabilities. In conclusion, it has been established that this research supports the complex dynamics regarding the credit risk, while providing policymakers with a framework for a highly sensitive early warning system that meets International Financial Reporting Standard 9 (IFRS 9) standards.
Keywords: Credit risk, non-performing loans (NPLs), financial factors, macroeconomic factors, machine learning.
_______
* Correspondent author.
Received: 06/02/2026. Accepted: 01/06/2026
Copyright © 2026 Ozan Özdemi̇r, Gökhan Özkul, Özen Akçakanat. Published by Vilnius University Press
This is an Open Access article distributed under the terms of the Creative Commons Attribution License, which permits unrestricted use, distribution, and reproduction in any medium, provided the original author and source are credited.
Non-performing loans (NPLs), being the most prominent feature of credit risk, not only reflect the deteriorating financial condition of banks but are also considered a significant leading indicator of the emergence of systemic risks and financial crises (Ozili, 2020). Not only do high NPLs raise the provisioning requirement for banks, but they also reduce their Return On Equity (ROE), thus affecting their lending ability and creating a situation of a credit crunch, which may adversely affect economic recovery (Kuzucu & Kuzucu, 2019).
An analysis of the existing literature indicates that studies related to the determinants of credit risk are mainly focused on the role of macroeconomic factors in the context of the business cycle theory. The key role of exogenous factors such as Gross Domestic Product (GDP) growth, inflation, unemployment, and exchange rates in the determination of NPLs has been widely accepted (Beck et al., 2015; Skarica, 2014; Hada et al., 2020). However, the determination of credit risk based solely on macroeconomic factors may be considered to be an incomplete approach, ignoring the risk appetite of the bank, its management quality, and the sophistication of the financial system.
At this stage, the main debate in the literature is related to the double-edged sword role of financial depth and financial inclusion in ensuring financial stability. As recent literature indicates, aside from bank-specific indicators, financial access and financial inclusion indicators play an important role in credit risk as well. While financial inclusion creates more stable funding for financial institutions, as more depositors become financially included, the uncontrolled expansion of financial access to credit can result in higher NPL rates due to overborrowing and information asymmetry (Goyal et al., 2023; Ozili, 2020).
Another major limitation of the literature is the lack of proper consideration of banking variables, financial development, and macroeconomic variables in an integrated manner. However, the complex, multidimensional, and chaotic nature of financial data makes it imperative to use sophisticated techniques of financial forecasting, including machine learning, which can effectively capture the complex interrelations and nonlinear associations among financial variables (Sharma et al., 2024; Abdullah et al., 2023). In this context, International Financial Reporting Standard 9 (IFRS 9) mandates that banks assess credit risk through forward-looking macroeconomic scenarios, necessitating proactive detection. Given the dynamic and multivariate nature of the Expected Credit Loss (ECL) model, machine learning techniques provide a robust alternative framework to capture complex associations among financial indicators.
The main purpose of this study is to examine the issue of credit risk in the context of the European Union (EU) countries, which have a heterogeneous structure in terms of their financial development and institutional characteristics, based on a wide range of data, including macroeconomic and financial (bank-specific, financial inclusion and depth variables) factors. In this study, the following hypotheses were tested: “H1: Financial and macroeconomic factors significantly affect NPL rates.” H2: “There are differences in NPL prediction accuracy among machine learning algorithms.” While recent studies have been successful in employing machine learning algorithms in forecasting non-performing loans in the context of the EU, the underlying data employed in such studies are limited to a specific set of macroeconomic variables. The incremental contribution of this study is that a holistic framework is provided, incorporating financial depth, financial inclusion, and institutional variables into a forecasting model.
Credit risk, which is a major threat to the sustainability of financial stability, is more than just a banking problem; it is a complex issue that results from a combination of factors, both from the internal management dynamics of banks and from the macroeconomic and structural environment in which banks operate. In this sense, the literature usually analyzes the determinants of NPLs by distinguishing between two groups: micro factors (bank-specific and financial) versus macro factors (systemic).
In this part of the study, first, the bank-specific factors that influence credit risk, and then the impact of financial inclusiveness and financial depth indicators on NPLs will be discussed in the context of the literature.
NPLs, an important indicator of asset quality, are mostly an outcome of financial structures and management practices followed by each bank. Management decisions, risk-taking, and efficiency in managing the allocation process have a significant impact on the quality of loans.
Capital adequacy is a primary determinant of a bank’s resilience, reflecting its capacity to absorb unexpected losses. Recent empirical evidence suggests that robust capital structures generally mitigate credit risk by enhancing shock absorption (Ersoy, 2021; Kuzucu & Kuzucu, 2019). However, this relationship may vary by context; for instance, Gafsi (2025) and Salman Abdou et al. (2025) found that capital ratios have a higher explanatory power than the traditional macroeconomic indicators. Conversely, high capitalization can occasionally signal an increased risk appetite, leading to a positive correlation with NPLs in specific banking systems (Ghosh, 2015).
Profitability, proxied by Return on Equity (ROE), is another critical determinant of asset quality. Consistent with the ‘bad management’ framework, a high ROE is typically associated with superior credit monitoring and risk management efficiency, thereby reducing NPL ratios (Bayar, 2019; Kjosevski et al., 2019; Milenković et al., 2024). Nevertheless, excessive pressure for short-term profitability can lead to a deterioration in credit standards, potentially increasing NPLs (Klein, 2013). Finally, consolidated banking leverage serves as a key indicator of funding vulnerability; high leverage ratios often correlate with a diminished loan quality and heightened susceptibility to economic shocks (Climent-Serrano, 2019).
Financial inclusion is a primary driver of financial stability. Research suggests that physical access indicators, such as bank branches and ATMs, mitigate credit risk by reducing information asymmetry (Ozili, 2021; Morgan & Pontines, 2018). Bank branches reduce the credit risk by capturing ‘soft information’ through direct customer interaction, thereby enhancing the borrower quality (Bussoli et al., 2020). While financial inclusion generally enhances stability in emerging economies (Han et al., 2025), rapid and poorly supervised credit expansion can conversely elevate NPL rates (Ozili, 2021). In contrast, evidence from OECD countries suggests that inclusion indirectly promotes economic growth by reducing NPL ratios (Zhang et al., 2022).
Financial depth is a core indicator showing the degree of development of the financial system and its ability to fund the real economy, and it plays a decisive role in the asset quality of the banking sector. In the literature, financial depth is usually measured by the ratio of outstanding loans to GDP and the ratio of the private sector credit share to GDP, and these indicators indicate bidirectional effects in credit risk analysis in the context of the ‘financial expansion’ and ‘excessive debt’ hypotheses (Kuzucu & Kuzucu, 2019).
According to the first approach, an increase in the credit volume supports financial depth and reduces NPL ratios; this relationship is mostly explained by the denominator effect, whereby the NPL ratio mathematically declines when the credit growth outpaces the growth of NPLs. This conclusion is confirmed by empirical evidence that credit growth has a statistically significant effect on decreasing NPL ratios (Ayhan & Kartal, 2021). Moreover, the improvement in financial depth improves access to finance for the business and household sectors, which alleviates liquidity constraints and improves debt-servicing capacity (Erdinç & Abazi, 2014).
NPLs are more than just a banking problem; they are a complex phenomenon driven by various macro- and structural determinants (Louzis et al., 2012; Mileris, 2014; Beck et al., 2015).
The macroeconomic foundations of credit risk are based on real production and employment indicators, which measure the income-generating potential of borrowers (Beck et al., 2015).
Real GDP growth is a significant aspect of the above-mentioned relationship. The empirical results have a high consensus on the fact that a significant negative relationship exists between credit risk and growth. This is applicable over a very large geographical area, from the Eurozone and developed nations (Foglia, 2022; Klein, 2013; Milenković et al., 2024; Škarica, 2014), to emerging nations (Goyal et al., 2023; Kuzucu & Kuzucu, 2019).
Additionally, an increase in the real GDP per capita, representing the welfare level of individuals, results in a decrease in the rate of default due to financial stability, especially in developing nations (Akuoko-Konadu, 2025; Bayar, 2019). On the other hand, Ghosh (2015) explains that a sudden income shock faced by the economy during the crisis period increases the ratio of NPLs very quickly.
The impact of the real economy on the credit risk mainly takes place through the labor market. In line with life cycle consumption theory and income continuity theory, an increase in the rates of unemployment affects the cash flows of borrowers, acting as a significant cause of default for borrowers (Amoah et al., 2023; Konstantakis et al., 2016). The empirical results show a strong and positive correlation between unemployment and NPLs, and an increase in employment helps in making loan repayments (Makri et al., 2014; Dimitrios et al., 2016; Kupčinskas & Paškevičius, 2017; Sharma et al., 2024).
However, the relationship between growth and credit risk is not always linear. The loose credit standards hypothesis implies that an increase in the risk appetite and credit expansion during periods of fast growth can lead to an increase in the NPL ratio in the medium or long term (Artenisa & Hyrije, 2023). In addition, in countries with a large informal economy and a well-developed social safety net, the effect of the labor market data on the credit risk may appear with a lag (Doğan & Dinçsoy, 2023; Kjosevski et al., 2019; Lubis & Mulyana, 2021).
In the literature, the value of money, the funding capacity of the economy, and the dynamics of the external balance are accepted as the basic factors for credit risk, and it is underlined that price instability, low levels of saving, and deteriorations in the current account balance increase the risk in the banking sector.
As a reflection of price stability, inflation has a two-fold influence on credit risk. From the ‘Fisher effect’ perspective, inflation is believed to reduce the value of debt and thus ease the situation of debtors (Erdinç & Abazi, 2014; Goyal et al., 2023).
However, the general belief is that inflation causes a reduction in the purchasing power and thus defaults due to an increase in interest rates (Doğan & Dinçsoy, 2023; Ersoy, 2021; Škarica, 2014). Recent studies have also supported the fact that cost-driven inflationary pressures and price volatilities have a significant influence on increasing NPL ratios (Hada et al., 2020; Milenković et al., 2024; Węgrzyn & Mróz, 2023).
Savings provide resilience and liquidity, reducing the credit risk (Ayhan & Kartal, 2021; Bayar, 2019), yet extreme levels may cause the ‘Savings Paradox’ along with subsequent recessionary risks (Gashi et al., 2022; Sharma et al., 2024). Regarding external factors, high current account deficits signal financial fragility, undermining credit quality through potential capital flight and currency instability (Kuzucu & Kuzucu, 2019; Staehr & Uusküla, 2019).
In the banking industry, institutional quality and economic freedoms operate through a two-channel process in influencing credit risks, specifically through market disciplines and debt repayment cultures. Based on the first approach, under the institutional efficiency channel, the maintenance of property rights, strong legal systems, and transparent regulations enhance debt repayment disciplines due to lower transaction costs. Empirical studies verified that the economic freedom index and institutional quality have mitigating effects on NPL ratios (Amoah et al., 2023; Bayar, 2019; Defung & Yudaruddin, 2022; Doğan & Dinçsoy, 2023).
The second approach indicates that unsanctioned liberalization can set off the risk-taking channel. Financial liberalization, without any backing from the appropriate regulation, can make banks engage in ‘riskier’ loans in order to maintain their market share in an environment that is becoming increasingly competitive. In their study, Akhter et al. (2023) indicated that expansion of business and monetary freedom led to an increase in the banks’ risk appetite.
This study uses data from the banking sectors of the EU member countries for the period of 2014–2024 to analyze the banks’ NPL ratios. This study aims to predict the loan portfolio quality through machine learning methods. The main motivation of the study is to dynamically model the quality of loan portfolios, which plays a critical role in maintaining financial stability in the EU countries, based on both banking indicators and macroeconomic factors. The variables and data sources included in the research are listed in Table 1.
The geographical scope of the study includes the 27 EU countries whose data are continuously accessible, and whose reporting system complies with the EU standards. The time scope of the research is set from 2014 to 2024, which includes the time before and after 2018, when IFRS 9 actually came into effect. Therefore, it is expected that the model will be able to take into consideration the ECL.
Credit risk measurement, which is fundamental component of financial stability, has traditionally been driven by traditional econometric approaches in the literature (Beck et al., 2015; Louzis et al., 2012). While dynamic panel data approaches and regression analysis are well-established methods for explaining the role of macroeconomic factors (Bayar, 2019; Kuzucu & Kuzucu, 2019; Makri et al., 2014), machine learning algorithms offer a alternative perspective for identifying complex data patterns (Abdullah et al., 2023). This is being replaced by machine learning approaches, which are more accurate and faster in processing large-scale and highly complex datasets, with developments in big data analytics (Sharma et al., 2024).
|
Variable Code |
Description |
Data Source |
|
NPL |
Non-performing loans ratio (tipsbd10) |
Eurostat (2025) |
|
T1CR |
Tier 1 capital ratio (tipsbd30) |
|
|
ROE |
Return on equity (tipsbd40) |
|
|
CBL |
Consolidated banking leverage ratio (tipsbd20) |
|
|
ATM |
Number of ATMs |
International Monetary Fund (2025) |
|
BRNCH |
Number of bank branches |
|
|
OSLGDP |
Ratio of outstanding loans to GDP |
|
|
PSCF_GDP |
Private sector credit share in GDP |
Eurostat (2025) |
|
REAL_GDP_G |
Real GDP growth rate |
|
|
RGDP_P |
Real GDP per capita |
|
|
UNEMP |
Unemployment rate |
|
|
EMP |
Employment rate |
|
|
INF |
Inflation rate (CPI) |
|
|
SAV_GDP |
Gross savings as a percentage of GDP |
World Bank (2025) |
|
CA_GDP |
Current account balance as a percentage of GDP |
Eurostat (2025) |
|
EFREE |
Economic Freedom Index |
The Heritage Foundation (2025) |
Research Design: The research design of the study consists of three main stages: data preparation, modeling, and feature selection – evaluation.
First stage (Data preparation): The dataset was created from annual observations for the period of 2014–2024, and financial and macroeconomic indicators were integrated for each country. In the data preprocessing stage, country-specific categorical variables were transformed by using one-hot encoding. Additionally, a limited number of missing values were addressed through series mean imputation with the objective to ensure data integrity and continuity. Before training scale-sensitive algorithms (SVR and MLP), explanatory variables were standardized by using StandardScaler; this process was performed within the Pipeline structure so that to prevent data leakage. This step was carried out to reduce the biases of machine learning models caused by the scale of the variables.
Second stage (Modeling): Four different machine learning algorithms were applied in the modeling process. Hyperparameter optimization for each model was performed by using the GridSearchCV method (Hastie et al., 2009). For the proper tuning of the hyperparameters and to avoid overfitting, a 5-fold cross-validation was performed during the grid search for all models. The data were randomly split into 80% for training and 20% for testing purposes. Though time series splits are commonly adopted for panel data, a random split was intentionally chosen owing to the significant structural break in the period from 2014 to 2024, especially the advent of IFRS 9 and the COVID-19 pandemic. A chronological split might lead to the isolation of systemic shocks, which might hinder the generalization of the models. A random split will ensure the representation of the pre- and post-shock environment, thus enabling the models to learn from various situations. The machine learning models used are as follows:
R², MAE, MAPE, MSE, and RMSE were used as performance metrics (Hastie et al., 2009; Chai & Draxler, 2014).
Third stage (Feature selection and evaluation): To improve the interpretability of the model results, an independent variable significance analysis was conducted. For this purpose, the Permutation Feature Importance method was chosen (Breiman, 2001; Altmann et al., 2010). This method determines the contribution of a variable to model performance by measuring the increase in the model’s prediction error resulting from the random mixing (permutation) of the values of the relevant variable. After feature selection, the models were retrained, and performance changes were examined. During the retraining phase, the sample size for all 27 countries was strictly adhered to in order to avoid any selection bias. The dimensionality reduction was achieved by selecting the top 10 features, which consisted of the top 5 continuous macro-financial features to filter out noise and the top 5 country dummy features, which were obtained through one-hot encoding. The addition of the country dummy features accounts for any institutional and cultural heterogeneities that play a major role in the progression of non-performing loans, similar to ‘fixed effects’ in panel econometrics.
In the first stage, descriptive statistics are presented to reveal the distribution and central tendencies of the variables in the dataset. In the following subsections, error metrics obtained from machine learning models and testing processes are analyzed comparatively.
Table 2 presents summary statistics calculated to understand the overall structure of the dataset and the differences between the variables before training machine learning models.
|
Variable |
Mean |
Std. Dev. |
Min |
25% |
50% |
75% |
Max |
|
NPL |
5.63 |
7.80 |
0.60 |
1.70 |
2.90 |
5.60 |
46.80 |
|
T1CR |
18.55 |
3.63 |
11.40 |
16.30 |
18.30 |
20.30 |
41.30 |
|
ROE |
7.62 |
6.18 |
-24.20 |
5.20 |
8.30 |
11.10 |
21.80 |
|
CBL |
12.29 |
3.26 |
6.60 |
9.50 |
12.10 |
14.70 |
24.30 |
|
ATM |
11,982 |
17,591 |
196 |
1,457 |
4,919 |
12,835 |
86,767 |
|
BRNCH |
3,797 |
6,150 |
56 |
363 |
1,175 |
3,422 |
27,401 |
|
OSLGDP |
56.61 |
27.57 |
20.79 |
36.10 |
50.38 |
71.79 |
184.11 |
|
PSCF_GDP |
3.66 |
6.53 |
-26.70 |
0.80 |
3.20 |
6.00 |
61.80 |
|
Real GDP growth |
2.61 |
3.72 |
-10.90 |
1.10 |
2.50 |
4.10 |
24.60 |
|
RGDP per capita |
29,636 |
19,995 |
6,260 |
15,680 |
23,130 |
40,250 |
99,760 |
|
UNEMP |
7.43 |
3.98 |
2.00 |
5.00 |
6.50 |
8.40 |
26.60 |
|
EMP |
73.34 |
6.14 |
53.10 |
69.60 |
74.70 |
77.90 |
83.50 |
|
INF |
2.68 |
3.59 |
-1.60 |
0.50 |
1.60 |
3.20 |
19.40 |
|
SAV_GDP |
23.48 |
5.54 |
6.67 |
20.52 |
23.30 |
27.09 |
37.21 |
|
CA_GDP |
1.34 |
4.85 |
-20.70 |
-1.20 |
0.80 |
3.80 |
18.90 |
|
EFREE |
70.02 |
5.80 |
53.00 |
66.00 |
70.00 |
75.00 |
83.00 |
Table 2 shows the major descriptive statistics of financial and macroeconomic variables for the EU countries over the period from 2014 to 2024. The mean value of NPL is 5.6%, indicating large differences between countries, with NPL ranging from a minimum of 0.6% to a maximum of 46.8%. As for the banking sector, the capital adequacy ratio and the ROE suggest a strong capital base for the EU financial system. As for the macroeconomic variables, the average real GDP growth rate (2.6%) and inflation (2.7%) suggest a stable economy with minor fluctuations. The UNEMP and EMP rates indicate substantial differences in the structural composition of the labor force for the EU countries. Moreover, the substantial variance of the OSLGDP and EFREE variables indicates the existence of substantial differences in the financial depth and institutional freedom levels among the EU countries. Overall, the table reveals high variation and asymmetry in the economic and financial indicators of the EU countries, thus highlighting the need to consider country effects in panel data analysis.
This section presents the initial results of machine learning models used to estimate NPL ratios for the EU countries. The prediction performance of the models was compared by using different error metrics, thus evaluating the consistency of the results without relying on a single metric. The main objective of this stage is to objectively identify the model that would provide the highest prediction accuracy and to focus on this model in subsequent analyses.
|
Model |
R² |
MAE |
MAPE |
MSE |
RMSE |
|
MLP |
0.9450 |
1.0671 |
0.3178 |
2.3407 |
1.5299 |
|
SVR |
0.9535 |
0.9705 |
0.3047 |
1.9762 |
1.4058 |
|
Extra Trees |
0.8955 |
1.1252 |
0.2529 |
4.4434 |
2.1079 |
|
Gradient Boosting |
0.8002 |
1.6236 |
0.3847 |
8.4997 |
2.9154 |
The results obtained in Table 3 demonstrate that, when all the performance metrics have been considered, the highest accuracy in the prediction of NPL ratios is obtained by using the SVR model. The high explanatory power of the model (R²) indicates that the model has successfully explained a significant proportion of the total variance of the dependent variable, while the low values of error metrics such as RMSE, MAE, and MSE indicate that the level of the estimation error is still low in terms of value and stability. However, it should be noted that the fact that the error levels of the GB, ET, and MLP Regressor models are also low indicates that these models have been able to grasp certain aspects of the NPL ratios, which is an important reference point in terms of comparative analysis. Based on the findings, the following hypotheses were accepted: “H1: Financial and macroeconomic factors significantly affect NPL rates.” H2: “There are differences in NPL prediction accuracy among machine learning algorithms.”
Evaluation of the models by using the training and test set, and the use of multiple performance measures lend support to the claim that the result is not an overfitting problem, and this provides a good methodological basis for proceeding to the interpretation of the significance of the variables and the economic mechanisms in the next step.
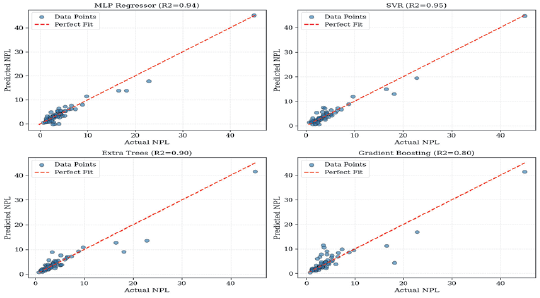
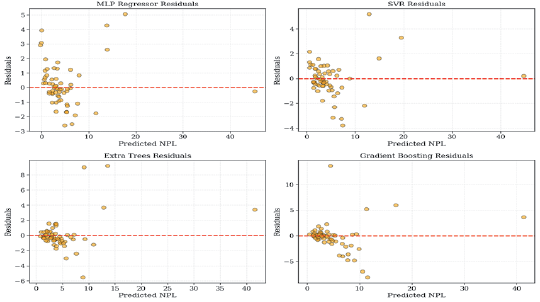
For a complete analysis of the outcomes of the comparison of the models, the level of agreement between the predicted and actual values, as well as the nature of the errors, was analyzed graphically for each of the models in the subsequent stage. Based on this, the graphs of the predicted values and the actual values, as well as the residual dispersion graphs, are provided together for each of the four models.
The relationship between the actual and the predicted values for NPL, as presented in Figure 1, provides a basis for visually determining the accuracy of predictions made by these models. The concentration of points in the SVR and MLP Regressor models, most of which are close to the perfect fit line, suggests that these models provide more balanced predictions, considering both lower and higher values for NPL. In contrast, the ET and GB models show increased deviations, particularly at high NPL values, with some observations systematically underestimated or overestimated. These findings support the table-based performance results and demonstrate that models capable of capturing nonlinear relationships more flexibly offer a superior visual fit in NPL prediction.
The residual graphs presented in Figure 2 allow for a visual examination of the structure of the models’ prediction errors and possible systematic deviations. The more balanced and random distribution of residuals around the zero line in the SVR and MLP Regressor models indicates that these models do not produce significant bias and provide consistent predictions at different NPL levels. In contrast, in the ET and GB models, the distribution of residuals widens, and outliers become more pronounced, especially at high predicted NPL values. This indicates that the prediction errors of these models increase in high-risk observations and reveals that residual analysis contributes to a deeper understanding of the model behavior by complementing the tabular performance metrics.
Feature importance analysis was conducted with the objective to determine the relative importance levels of the financial structure and macroeconomic factors that determine the credit risk (NPL) across EU countries. In the analysis process, a systematic feature selection procedure was followed, eliminating variables with a low explanatory power so that to optimize the model’s prediction success and obtain more generalizable results by minimizing noise in the dataset. The importance scores obtained through the algorithms used, showing the degree of dominance of the variables on credit risk, are presented in Table 4, and the key determinants of risk formation in the EU banking system are empirically interpreted.
|
Model |
Order |
Variable |
Score |
Country |
Score |
|
SVR |
1 |
UNEMP |
0.2287 |
Croatia |
0.0838 |
|
2 |
EMP |
0.1276 |
Spain |
0.0662 |
|
|
3 |
ROE |
0.1022 |
Czechia |
0.0579 |
|
|
4 |
OSLGDP |
0.0964 |
Estonia |
0.0567 |
|
|
5 |
EFREE |
0.0717 |
Poland |
0.0435 |
|
|
MLP |
1 |
OSLGDP |
0.2667 |
Croatia |
0.1527 |
|
2 |
UNEMP |
0.1967 |
Slovakia |
0.0983 |
|
|
3 |
CBL |
0.1382 |
Spain |
0.0691 |
|
|
4 |
EMP |
0.1066 |
Germany |
0.0490 |
|
|
5 |
T1CR |
0.0907 |
Hungary |
0.0488 |
|
|
Extra Trees |
1 |
UNEMP |
0.1290 |
Greece |
0.0762 |
|
2 |
EMP |
0.1218 |
Cyprus |
0.0573 |
|
|
3 |
SAV_GDP |
0.0723 |
Slovenia |
0.0082 |
|
|
4 |
ROE |
0.0507 |
Spain |
0.0062 |
|
|
5 |
EFREE |
0.0400 |
Hungary |
0.0047 |
|
|
Gradient Boosting |
1 |
ROE |
0.2784 |
Spain |
0.0133 |
|
2 |
UNEMP |
0.1236 |
Croatia |
0.0038 |
|
|
3 |
EFREE |
0.0867 |
Cyprus |
0.0022 |
|
|
4 |
EMP |
0.0631 |
Ireland |
0.0017 |
|
|
5 |
PSCF_GDP |
0.0408 |
Estonia |
0.0016 |
In the analysis of the model-based distribution of key variables, it is observed that the labor market indicators and the ratios of bank profitability are crucial in determining the rates of NPL. The observation that UNEMP and EMP rates are the most important variables in all four models confirms the crucial role of the security of household income in credit repayment ability. The dominant role of the ROE (27.8%) variable in the GB model indicates that the structure of the banks’ profitability is directly related to risk management. In addition, the dominant role of structural indicators such as OSLGDP and EFREE underscores the role of financial depth and economic liberalization in the credit quality; while, in country-specific analyses, the dominant role of Croatia and Spain in most models indicates that these countries have unique NPL dynamics that differ from the average in the EU during the reviewed period. The significance of certain country dummy variables reveals the presence of a structural dichotomy in the EU credit risk, which appears to reflect observable, albeit often invisible, distinctions between the more established member states still suffering from the legacy of former financial crises and the newer members, who have to contend with the consequences of their status as a transition economy. This reveals the potential of machine learning algorithms to transcend macro-economic indicators.
The retrained model results presented in this section were obtained in accordance with the noise reduction and variable selection-based retraining approach commonly used in machine learning studies. Five variables of the highest importance, identified in the previous stage, and five countries where their effects were most pronounced were selected. The models were then retrained on these subsamples, while preserving the country dummy variables. This approach aims to reduce the noise originating from low-contributing components in high-dimensional panel data structures and to enable the model to capture fundamental patterns more clearly. Therefore, the results obtained are complementary and in-depth, rather than replacing the main analysis findings.
|
Model |
R2 |
MAE |
MAPE |
MSE |
RMSE |
|
Extra Trees |
0.8982 |
1.2934 |
33.11 |
4.3307 |
2.0810 |
|
MLP |
0.8642 |
1.4834 |
37.21 |
5.7771 |
2.4036 |
|
Gradient Boosting |
0.8306 |
1.6568 |
41.51 |
7.2030 |
2.6838 |
|
SVR |
0.8111 |
1.3761 |
25.21 |
8.0324 |
2.8342 |
The dimensionality reduction process, based on variable importance levels, resulted in retraining the models with only the most critical features (a total of 10 variables), providing significant resilience and optimization in prediction performance. In particular, the Extra Trees (: 0.8982) and Gradient Boosting (: 0.8306) models maintained and even increased their explanatory power despite a radical reduction in the number of variables, thereby demonstrating that the models are free from noise in the dataset and that the risk of overfitting is minimized. The high success rates achieved with this limited dataset, dominated by key indicators such as unemployment (UNEMP) and ROE, show that NPL formation in the EU banking system is highly predictable and sensitive to specific macro-financial dynamics. In conclusion, these findings methodologically confirm that the developed models can produce highly accurate results even with a small amount of data, acting as an economically and operationally efficient early warning system for policymakers.
Below are presented the performance graphs that visualize the prediction accuracy and fit with the actual data of models optimized by variable selection.
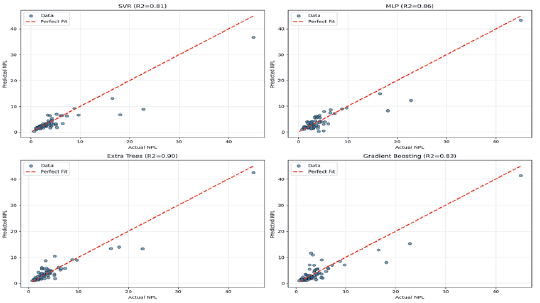
Figure 3 visually presents the prediction performance of the models obtained after a retraining strategy based on noise reduction and variable selection. In all models, the clustering of observations largely close to the perfect fit line shows that the models retrained with the selected variables and countries continue to capture the basic patterns. The observed differences in the model performance are related to the deliberate narrowing of the sample during the retraining phase and the more pronounced country-specific dynamics. These results reveal that the retrained models are supportive and complementary to the findings obtained in the main analysis.
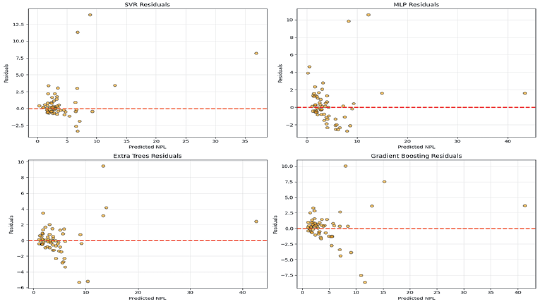
The residual distributions presented in Figure 4 visually assess the structure of the prediction errors of the optimized models and any potential systematic biases.
This set of graphs (Figure 4) visualizes the residual distributions (predicted NPL versus residual) of models retrained on only the 10 most important features after variable selection. Residual plots are used to assess the structure of model prediction errors, the presence of systematic bias, and homoskedasticity. The symmetrical and random distribution of residuals around the zero line in the graphs indicates that the models are correctly identified and stable. In particular, the narrower and more regular residual distribution in SVR and ET models reveals that the prediction performance of these models remains reliable and consistent after variable selection.
This research examines the factors influencing NPL ratios in the EU member states during the period from 2014 to 2024, by adopting a multi-dimensional framework that combines bank-specific factors, financial inclusion and depth metrics, as well as macroeconomic variables, through a machine learning algorithm. The results show that the credit risk is not driven by macro-economic changes alone but rather through a complex and nonlinear process influenced by labor markets, management practices in banks, and access to financial infrastructure. Furthermore, NPL dynamics are driven by the legacy of past crises in the older EU members, whereas they are shaped by transition economy vulnerabilities in the newer members.
The comparative evaluation based on different error metrics during the analysis process shows that the SVR model has the highest prediction accuracy. The reason for the better performance of the SVR model over other ensemble learning methods like Extra Trees and Gradient Boosting could be the structural risk minimization principle employed in the model, which helps it avoid noise from heterogeneous data across the EU countries.
The results of the analysis show a significant similarity with the bad management hypothesis in the literature in relation to bank-specific variables. The study empirically supports the view that the ROE’s power in predicting NPLs (particularly in the Gradient Boosting model) is an indicator of weaknesses in the managers’ credit monitoring and evaluation capabilities, demonstrating that poor profitability performance is indicative of weaknesses in their ability to monitor and evaluate credit. Banks with a low ROE experience weaknesses in risk management, resulting in a deteriorated asset quality with high levels of NPL. This result is consistent with the findings of Bayar (2019) and Kjosevski et al. (2019), which indicate that high profitability is linked to strong risk management.
One of the most original aspects of this research is the findings related to the impact of financial inclusion, as well as the banking infrastructure (in the sense of the branch and ATM network), on the credit risk. The fact that physical contact points, as well as the institutional quality (EFREE), enhance the accuracy of the models supports the ‘relationship banking’ concept, as presented in the literature. As noted by Bussoli et al. (2020), the existence of bank branches allows for face-to-face communication, enabling banks to gather specific intelligence about their customers, thereby reducing information asymmetry between the bank and its customers. This result is consistent with the positive externalities of financial access, as highlighted by Ozili (2020) and Morgan and Pontines (2018).
On the other hand, the variables which symbolize financial depth can be related to credit boom analyses in literature. As stated in the studies of Ghosh (2015) and Klein (2013), the easing of credit standards adopted by banks in the context of market share competition during periods of fast credit expansion result in lagged effects of NPLs. The strong significance level of this variable in our study reveals that the financial depth in EU countries can cause risk accumulation beyond certain thresholds.
Regarding the macroeconomic factors, with the unemployment rate being the most dominant factor in all models is in line with the life cycle consumption model. The mechanism, where the impact of disruptions in the household income flows is directly related to the repayment of loans, is in complete agreement with the studies of Louzis et al. (2012) and Dimitrios et al. (2016) on the Euro Area. However, it has been revealed in our study that this macroeconomic factor alone is not sufficient; when combined with the institutional structure and financial infrastructure, the success rate improves substantially.
From a policy recommendation perspective, the results provide bank executives and regulators with three important implications. First, branch closures may undermine a bank’s intelligence capabilities, which can raise credit risks. Thus, risk management can be as important as cost reduction in designing strategies for branch expansion. Second, in measuring expected credit losses under IFRS 9, it is not only necessary to incorporate macroeconomic forecasts but also financial access and quality proxies into the models. Third, from an overall economic viewpoint, the high predictive power of unemployment and ROE underscores the reality that the credit risk has strong links to the real-world job stability and bank management quality. Thus, policymakers need to address the job stability and bank management quality in their efforts, rather than relying on traditional macroeconomic policies.
Finally, the scope of the study is restricted to the EU countries, and the machine learning algorithms employed, despite providing a high predictive accuracy, are not capable of explaining the causal relationships between the variables. Future studies that would extend the framework with other countries and models and concentrate on the crisis periods by incorporating stress scenarios into the analysis would be a valuable addition to the literature.
Abdullah, M., Chowdhury, M. A. F., Uddin, A., & Moudud‐Ul‐Huq, S. (2023). Forecasting nonperforming loans using machine learning. Journal of Forecasting, 42(7), 1664-1689. https://doi.org/10.1002/for.2977
Akhter, T., Abdul Halim, Z., Mehzabin, S., Shahriar, A., & Azad, M. A. K. (2023). Do national culture and economic freedom affect bank risk-taking behavior? Evidence from GCC countries. International Journal of Islamic and Middle Eastern Finance and Management, 16(6), 1159-1180. https://doi.org/10.1108/IMEFM-07-2022-0283
Akuoko-Konadu, E., & Mahmud, A. (2025). Corruption, economic growth, and non-performing loans in Sub-Saharan Africa: An empirical analysis (2011–2019). Journal of Quantitative Economics, 23(1), 233-251. https://doi.org/10.1007/s40953-024-00420-y
Altmann, A., Toloşi, L., Sander, O., & Lengauer, T. (2010). Permutation importance: A corrected feature importance measure. Bioinformatics, 26(10), 1340–1347. https://doi.org/10.1093/bioinformatics/btq134
Amoah, A., Asiama, R. K., & Korle, K. (2023). Applying the breaks to non-performing loans in Ghana. International Journal of Emerging Markets, 18(8), 1978-1993. https://doi.org/10.1108/IJOEM-03-2020-0287
Artenisa, B., & Hyrije, A. A. (2023). The impact of economic growth on non-performing loans in Western Balkan countries. InterEULawEast, 10(2), 117-130. https://doi.org/10.22598/iele.2023.10.2.6
Ayhan, F., & Kartal, M. T. (2021). The macro economic drivers of non-performing loans (NPL): Evidence from selected countries with heterogeneous panel analysis. MANAS Sosyal Araştırmalar Dergisi, 10(2), 986-999. https://doi.org/10.33206/mjss.800648
Bayar, Y. (2019). Macroeconomic, institutional and bank-specific determinants of non-performing loans in emerging market economies: A dynamic panel regression analysis. Journal of Central Banking Theory and Practice, 8(3), 95-110. https://doi.org/10.2478/jcbtp-2019-0026
Beck, R., Jakubik, P., & Piloiu, A. (2015). Key determinants of non-performing loans: New evidence from a global sample. Open Economies Review, 26(3), 525-550. https://doi.org/10.1007/s11079-015-9358-8
Breiman, L. (2001). Random forests. Machine Learning, 45(1), 5-32. https://doi.org/10.1023/A:1010933404324
Bussoli, C., Caputo, V., & Conte, D. (2020). Macroeconomic and bank-specific determinants of NPLs in Europe: The role of branches and bank size. Bancaria, 1, 22-43.
Chai, T., & Draxler, R. R. (2014). Root mean square error (RMSE) or mean absolute error (MAE)? Arguments against avoiding RMSE in the literature. Geoscientific Model Development, 7(3), 1247–1250.
https://doi.org/10.5194/gmd-7-1247-2014
Climent-Serrano, S. (2019). Effects of economic variables on NPLs depending on the economic cycle. Empirical Economics, 56(1), 325-340. https://doi.org/10.1007/s00181-017-1362-y
Defung, F., & Yudaruddin, R. (2022). Economic freedom on bank stability and risk-taking in emerging economy: Indonesian case study. Cogent Business & Management, 9(1), 2112816. https://doi.org/10.1080/23311975.2022.2112816
Dimitrios, A., Helen, L., & Mike, T. (2016). Determinants of non-performing loans: Evidence from Euro-area countries. Finance Research Letters, 18, 116-119. https://doi.org/10.1016/j.frl.2016.04.008
Doğan, M. A., & Dinçsoy, E. E. (2023). Shadow economy nexus of non-performing loans in emerging markets. Trakya Üniversitesi Sosyal Bilimler Dergisi, 25(Özel Sayı), 193-212. https://doi.org/10.26468/trakyasobed.1225074
Erdinç, D., & Abazi, E. (2014). The determinants of NPLs in emerging Europe, 2000-2011. Journal of Economics and Political Economy, 1(2), 112-125.
Ersoy, E. (2021). The determinants of the non-performing loans: The case of Turkish banking sector. International Journal of Insurance and Finance, 1(2), 1-11. https://doi.org/10.52898/ijif.2021.6
Eurostat. (2025). Eurostat database. European Commission. Retrieved December 15, 2025, from https://ec.europa.eu/eurostat
Foglia, M. (2022). Non-performing loans and macroeconomics factors: The Italian case. Risks, 10(1), 21. https://doi.org/10.3390/risks10010021
Gafsi, N. (2025). Machine learning approaches to credit risk: Comparative evidence from participation and conventional banks in the UK. Journal of Risk and Financial Management, 18(7), 345. https://doi.org/10.3390/jrfm18070345
Gashi, A., Tafa, S., & Bajrami, R. (2022). The impact of macroeconomic factors on non-performing loans in the Western Balkans. Emerging Science Journal, 6(5), 1032-1045. https://doi.org/10.28991/ESJ-2022-06-05-08
Ghosh, A. (2015). Banking-industry specific and regional economic determinants of non-performing loans: Evidence from US states. Journal of financial stability, 20, 93-104. https://doi.org/10.1016/j.jfs.2015.08.004
Goyal, S., Singhal, N., Mishra, N., & Verma, S. K. (2023). The impact of macroeconomic and institutional environment on NPL of developing and developed countries. Future Business Journal, 9(1), 45. https://doi.org/10.1186/s43093-023-00216-1
Hada, T., Bărbuță-Mișu, N., Iuga, I. C., & Wainberg, D. (2020). Macroeconomic determinants of nonperforming loans of Romanian banks. Sustainability, 12(18), 7533. https://doi.org/10.3390/su12187533
Han, S., Qian, C., Adam, N. A., Karimov, N., & Zhang, W. (2025). Understanding the relationship: Financial inclusion’s influence on bank stability in emerging economies. Energy Strategy Reviews, 61, 101791. https://doi.org/10.1016/j.esr.2025.101791
Hastie, T., Tibshirani, R., & Friedman, J. (2009). The elements of statistical learning: Data mining, inference, and prediction (2nd ed.). Springer. https://doi.org/10.1007/978-0-387-84858-7
International Monetary Fund. (2025). IMF data portal. Retrieved December 15, 2025, from https://data.imf.org
Kjosevski, J., Petkovski, M., & Naumovska, E. (2019). Bank-specific and macroeconomic determinants of non-performing loans in the Republic of Macedonia: Comparative analysis of enterprise and household NPLs. Economic research-Ekonomska istraživanja, 32(1), 1185-1203.https://doi.org/10.1080/1331677X.2019.1627894
Klein, N. (2013). Non-performing loans in CESEE: Determinants and impact on macroeconomic performance (IMF Working Paper, No. 13/72). International Monetary Fund.
Konstantakis, K. N., Michaelides, P. G., & Vouldis, A. T. (2016). Non performing loans (NPLs) in a crisis economy: Long-run equilibrium analysis with a real time VEC model for Greece (2001–2015). Physica A: Statistical Mechanics and its applications, 451, 149-161. https://doi.org/10.1016/j.physa.2015.12.163
Kupčinskas, K., & Paškevičius, A. (2017). Key factors of non-performing loans in Baltic and Scandinavian countries: Lessons learned in the last decade. Ekonomika, 96(2), 43–55. https://doi.org/10.15388/Ekon.2017.2.10994
Kuzucu, N., & Kuzucu, S. (2019). What drives non-performing loans? Evidence from emerging and advanced economies during pre-and post-global financial crisis. Emerging Markets Finance and Trade, 55(8), 1694-1708. https://doi.org/10.1080/1540496X.2018.1547877
Louzis, D. P., Vouldis, A. T., & Metaxas, V. L. (2012). Macroeconomic and bank-specific determinants of non-performing loans in Greece: A comparative study of mortgage, business and consumer loan portfolios. Journal of banking & finance, 36(4), 1012-1027. https://doi.org/10.1016/j.jbankfin.2011.10.012
Lubis, D. D., & Mulyana, B. (2021). The macroeconomic effects on non-performing loan and its implication on allowance for impairment losses. Journal of Economics, Finance, and Accounting Studies, 3(2), 13-22. https://doi.org/10.32996/jefas.2021.3.2.2
Makri, V., Tsagkanos, A., & Bellas, A. (2014). Determinants of non-performing loans: The case of Eurozone. Panoeconomicus, 61(2), 193-206. https://doi.org/10.2298/PAN1402193M
Milenković, N., Kalaš, B., Mirović, V., & Andrašić, J. (2024). Static and dynamic modeling of non-performing loan determinants in the Eurozone. Mathematics, 12(21), 3323. https://doi.org/10.3390/math12213323
Mileris, R. (2014). Macroeconomic factors of non-performing loans in commercial banks. Ekonomika, 93(1), 22–39. https://doi.org/10.15388/Ekon.2014.0.3024.
Morgan, P. J., & Pontines, V. (2018). Financial stability and financial inclusion: The case of SME lending. The Singapore Economic Review, 63(01), 111-124. https://doi.org/10.1142/S0217590818410035
Ozili, P. K. (2020). Non-performing loans in European systemic and non-systemic banks. Journal of Financial Economic Policy, 12(3), 409-424. https://doi.org/10.1108/JFEP-02-2019-0033
Ozili, P. K. (2021). Has financial inclusion made the financial sector riskier?. Journal of Financial Regulation and Compliance, 29(3), 237-255. https://doi.org/10.1108/JFRC-08-2020-0074
Salman Abdou, D. M. S., Farrag, K., & Ali, L. (2025). Detecting credit risk in Egyptian banks: Does machine learning matter?. Ekonomika, 104(2), 78-94. https://doi.org/10.15388/Ekon.2025.104.2.5
Sharma, H., Andhalkar, A., Ajao, O., & Ogunleye, B. (2024). Analysing the influence of macroeconomic factors on credit risk in the UK banking sector. Analytics, 3(1), 63-83. https://doi.org/10.3390/analytics3010005
Škarica, B. (2014). Determinants of non-performing loans in Central and Eastern European countries. Financial Theory and Practice, 38(1), 37-59. https://doi.org/10.3326/fintp.38.1.2
Staehr, K., & Uusküla, L. (2021). Macroeconomic and macro-financial factors as leading indicators of non-performing loans: Evidence from the EU countries. Journal of Economic Studies, 48(3), 720-740. https://doi.org/10.1108/JES-03-2019-0107
The Heritage Foundation. (2025). Index of economic freedom. Retrieved December 15, 2025, from https://www.heritage.org/index
Węgrzyn, P. & Mróz, M. (2023). Beyond inflation: The impact of energy prices on non-performing loans in the EU. http://dx.doi.org/10.2139/ssrn.4645430
World Bank. (2025). World development indicators. World Bank Group. Retrieved December 15, 2025, from https://databank.worldbank.org/source/world-development-indicators
Zhang, P., Zhang, M., Zhou, Q., & Zaidi, S. A. H. (2022). The relationship among financial inclusion, non-performing loans, and economic growth: insights from OECD countries. Frontiers in Psychology, 13, 939426. https://doi.org/10.3389/fpsyg.2022.939426