Knygotyra ISSN 0204–2061 eISSN 2345-0053
2022, vol. 78, pp. 111–139 DOI: https://doi.org/10.15388/Knygotyra.2022.78.108
Culturomic Explorations of Literary Prominence Using Google Books: A Pilot Study
Jukka Tyrkkö
Linnaeus University
Voimakatu 1 A 19, 33100 Tampere, Finland
Email: jukka.tyrkko@lnu.se
Ilkka Mäkinen
Information Studies and Interactive Media,
Faculty of Communication Sciences
FI-33014 University of Tampere, Finland
E-mail: ilkkajmakinen@gmail.com
Summary. The availability of databases of digitised literary materials, such as Google Books, Europeana and historical newspaper databases, has revolutionised many disciplines, e.g., linguistics and history. So far, the use of digitised materials has not been very frequent in the history of books and the history of reading. This article presents tools, methodologies and practices that offer new possibilities in the study of book history and the history of reading. The use of these tools makes it possible to study vast amounts of data quickly and effectively, to present results in helpful visualisations, to make it possible to follow the line of reasoning and, if necessary, to check the reliability of the research by presenting the data for control. The examples presented are drawn from the Google Books database using a simple piece of software that exploits the API of the Google Books Ngram Viewer tool that is available free of charge.
Keywords: Literary prominence, literary history, Google Books, quantitative analysis
Kultūriniai-skaitmeniniai literatūros žinomumo tyrinėjimai pasitelkiant „Google knygas“: bandomasis tyrimas
Santrauka. Suskaitmenintų literatūros duomenų bazių tokių kaip „Google knygos“, „Europeana“ ir istorinių laikraščių duomenų bazių prieinamumas sukėlė revoliuciją daugelyje disciplinų, pvz., kalbotyroje ir istorijoje. Iki šiol knygų istorijoje ir skaitymo istorijoje suskaitmenintos medžiagos naudojimas nebuvo ypač dažnas. Šiame straipsnyje pristatomos priemonės, metodikos ir praktikos, kurios suteikia naujas knygų istorijos ir skaitymo istorijos tyrimo galimybes. Šių įrankių naudojimas leidžia greitai ir efektyviai ištirti didžiulius duomenų kiekius, pateikti rezultatus pasitelkiant naudingas vizualizacijas, suteikia galimybę remtis argumentavimu ir, prireikus, nustatyti tyrimo patikimumą pateikiant duomenis patikrinimui. Surinkti pavyzdžiai yra paimti iš duomenų bazės „Google knygos“, naudojant paprastą programinę įrangą ir pasitelkiant nemokamo „Google Books Ngram Viewer“ įrankio aplikacijų programavimo sąsają (angl. API).
Reikšminiai žodžiai: literatūros žinomumas, literatūros istorija, „Google knygos“, kiekybinė analizė.
Received: 2021 11 07. Accepted: 2022 04 06
Copyright © 2022 Jukka Tyrkkö, Ilkka Mäkinen. Published by Vilnius University Press. This is an Open Access journal distributed under the terms of the Creative Commons Attribution Licence, which permits unrestricted use, distribution, and reproduction in any medium, provided the original author and source are credited.
1. Introduction1
Almost 30 years ago Robert Darnton voiced his frustrations over the lack of generalisations in the study of history of reading: ‘For the last 10 years, we’ve been hitting our heads against a wall. We have a few really good studies of individual readers, but we don’t know where to go from there.’2 While it goes without saying that the history of reading has seen many advances since then, the fact is that there is still a great need for studies that would look beyond the individual reader or a limited group of readers, or that would extend their reach beyond national and linguistic boundaries. Indeed, there is still a tendency to approach the history of reading, as well as the history of the book, as a primarily nationalistic endeavour instead of as a European, or, in the end, as a global endeavour, which is of course what they ideally ought to be. Consequently, while all new research is useful, even if narrowly focused, we should not shy away from new approaches and perspectives that may allow us to broaden our horizons and reveal common threads and universal patterns.
The vast progress made in the digitisation of books, journals and newspapers over the last two decades is one of the new developments that offers novel opportunities for research that have yet to be fully exploited. The many digital book repositories, archives and databases developed and maintained by academic institutions, national libraries and other heritage organisations, as well as commercial actors, give access to massive resources that make it possible to study the history of reading, books and the marketplace of books across national and linguistic boundaries. Today, it is entirely feasible to carry out rapid textual searches of millions of documents to discover references to individuals, places, topics and even linguistic structures or features of rich metadata. The paradigm shift that this entails is real. As Christof Schöch noted in 2013, few traditional humanities scholars would have described their objects of study as data, but today, ‘in the humanities just as in other areas of research, we are increasingly dealing with “data”.’3 The use of vast digitised literary databases, precise automated searches, and computational and statistical methods of analysis means a transition to an empirical mode of research. In previous decades, readers usually had to rely solely on the competence or the authority of the researcher and trust the conclusion they drew without any realistic possibility of checking the soundness of the conclusions. Empirical, data-based modes of study can augment the ‘hermeneutic tradition of text interpretation’, as described by Kuhn (2019), with data drawn from (more or less) methodologically constructed databases or corpora, which make it, in principle, possible for anybody to rerun the queries and quantitative analyses for themselves in order to verify the conclusions of the original author.4 This does not mean that expertise based on personal scholarship, reading, and introspection will now be outdated, but rather that the data to which the expertise is applied can be more expansive, more rigorously collected, and more verifiable.
Virtually all fields of humanities scholarship are currently readjusting to the possibilities and challenges of the digital transformation, with some fields being further along in the process than others. The methods discussed above, and used for this pilot study, are conceptually close to quantitative approaches used in corpus linguistics,5 even if the databases, such as Google Books, still lack the rigour of methodologically constructed linguistic corpora. And while we are very aware of the inaccuracies of the optical reading of documents, the inclusion of duplicates in large digitised archives, as well as of the inferiority of metadata in these databases, we would claim that the strengths of Google Books and other similar databases, as well as the tools based on them, such as the Google Books Ngram Viewer, easily outweigh the weaknesses. Moreover, tools like the Ngram Viewer are easy and quick to use, and they bring the analysis of vast textual masses within reach of anyone who knows how to use an internet browser. It is now possible to make parallel searches in multiple language areas over long periods of time. All can and should be made better, but even now this is a vast leap forward compared with what we had only a few decades ago.
There have already been some tentative efforts in the use of digitised materials in the history of reading.6 However, these studies have until now tended to rely on the manual gathering of data, which naturally means much smaller datasets than those that computational queries of digitised collections can facilitate. Furthermore, it has generally been impossible to carry out simultaneous searches in data representing multiple language regions which, as discussed earlier, has the effect of limiting the scope of the study to national contexts.
In this article, our aim is to describe and present examples of methodologies and practices using digital data sources that may be helpful for book historians and historians of reading, even for those who do not possess advanced knowledge of data processing methodologies. The pilot study makes use of six subcorpora of Google Books in order to examine the trajectories of literary prominence of 100 well-known authors who flourished in the nineteenth and twentieth centuries in Europe and the United States (see Appendix for list of authors). Our aim was to include both international literary giants and authors that we believed had more regional influence; Nobel laureates and authors of bestselling children’s fiction; authors from the language regions covered by the Google Books subcorpora are well as European authors from the Nordic, Baltic and other regions. The list is neither comprehensive nor systematic, and thus the findings of the study should be taken as tentative, rather than conclusive.
2. Literary prominence in brief
Literary prominence is, of course, difficult to define. On the one hand, the most straightforward way to approach the concept would be to look at the sales figures of books: the more books sold, the more prominent the author. On the other hand, prominence can also be measured by references to the author in contemporaneous critical and later public discourse (see Heilbrun 1997). A writer can attract attention based on positive responses to their work from literary critics and academic researchers without achieving exceptional sales. Their work may be discussed in academic research and become a part of the literary canon, and there may be intermedial translations of their work in the form of music and film, in which contexts the author’s name is also mentioned (see Verboord 2003). Thus, whilst the best-selling author and the highly esteemed author may coincide in the same person, that is often not the case, as shown by Algee-Hewitt & McGurl (2015).
We adopt the latter definition of literary prominence in this paper, defining the concept as the prominence of the writer’s name in public discourse, which is operationalised quantitatively as mentions of their name in contemporary and subsequent written texts. Our working definition of prominence is thus rather simple: the more a given writer’s name appears in books and journals7, the more prominent they are. Importantly, our approach measures prominence, not prestige, as we make no difference between the two types of authors mentioned above: both bestselling and critically acclaimed authors attract attention in printed media. The same method could be used to look at the prominence of individual books by searching for titles (and their translations), which is something we may explore in follow-up studies.
Since our principal source of data is Google Books, we concentrate on printed publications and leave aside electronic and digital media. Although it would be ideal to be able to make a distinction between the two, the current method of accessing Google Books does not facilitate the types of textual and topical analyses that are used in corpus linguistics or machine learning.8 However, while a more focused corpus would expand the range of techniques used (see Underwood & Sellers 2016), the sheer magnitude of data available on Google Books makes up for the shortcomings and opens up a ‘cultural’ perspective on the question at hand.
Likewise, it would be ideal if we could combine the print runs of books and journals with the number of times the author’s name appears in the digitised copies, but this is also not yet possible.
Yet the problem remained of choosing the authors to be included in our examination. There is, at this moment, no simple method of compiling a list of all authors and arranging them by presumed prominence (see English 2016), and thus our approach was to handpick a selection of authors from the worldwide literary market by relying on our definition of literary prominence, the sales figures of the books, and the esteem that they have been afforded by literary institutions.
Our sample of bestselling authors was initially selected from the international list of bestselling books presented by Wikipedia9. The list includes both individual authors and book series written by anonymous clusters of writers (such as the Nick Carter series). This time we chose only individual authors and limited ourselves to authors publishing in European languages. Our measuring stick and selection criterion for prominence was the Nobel Prize in Literature, the most revered literary institution in the world. The names of the Nobel laureates in Literature can be found listed on a WWW-page of the Nobel Prize Organization or in a Wikipedia article10. There are other possible ways to gather a list of esteemed authors, e.g., picking names from books on literary history, or using an expert panel, but for the uses of this pilot study, the Nobel laureates fulfil our needs. The list was supplemented by a few additional authors whose prominence we were curious to examine.
3. Google Books
The overall diachronic visibility of literary authors was examined using six subcollections of Google Books from the 2019 version: American English, British English, French, German, Italian, and Spanish. Google Books and its proprietary search tool, Google Ngram Viewer, are products compiled by Google through a massive digitisation project with the stated purpose of digitising and making searchable all published books. The project now covers multiple languages and over a trillion words, making Google Books easily one of the largest digital book collections available (see Figure 1).11 At the present time in the (northern) summer of 2021, users are given limited access to the digitised books through the Google Books platform, and curated access to the entire corpora through the Google Ngram Viewer. The Viewer is essentially a custom corpus tool that returns a diachronic trend line for any term or terms queried, with some limited options for more specialised queries using Google’s own part-of-speech annotation.
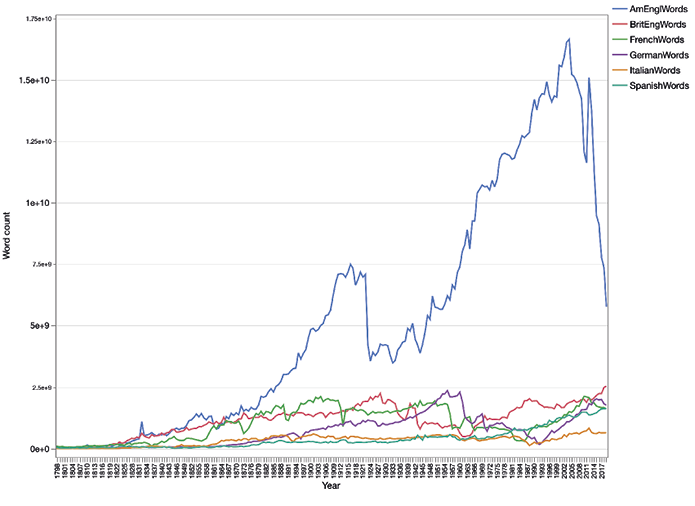
Figure 1. Word counts in Google Books Ngram Viewer per language region
The cumulative word counts of the six subcorpora are given in Table 1.
Table 1. Total word counts of the six language regions
|
Subcorpus (2019) |
Word count (1800-2019) |
|
American English |
1.16 trillion |
|
British English |
257.3 billion |
|
French |
229.9 billion |
|
German |
156.4 billion |
|
Spanish |
85.8 billion |
|
Italian |
73.7 billion |
Google Books was introduced as a resource for humanities research by Michel et al. (2010)12, who coined the term culturomics to describe research paradigms that exploit Big Data and methods of distant reading for the purposes of exploring cultural trends13. Although both Google Books as a resource and the general approach have received their fair share of criticism over the years14, the diagnostic insights made possible by the dataset have made significant contributions to studies in many fields including history and culture15, book history and the history of reading16, and historical linguistics17. The approach adopted in the present study is based on the premise that regardless of a small but manageable number of inaccuracies in the digitisation process, the underlying metadata, and the precision and recall of the queries, the sheer magnitude of the dataset makes the observations of trendlines and tendencies obtained valuable indicators of cultural developments.
In the present study, we used a custom query tool, written by the second author in Livecode18, which exploits the Google Ngram Viewer API essentially to automate multiple queries on more than one subcorpus of Google Books.19 For the present pilot study, we first compiled a large representative list of popular eighteenth- and nineteenth-century novelists, and then used the query tool to search for the annual frequencies — natively expressed in proportional terms by Google — over the period 1800–2000. Each individual query was passed by the tool to the Ngram Viewer structured according to the API format. The tool would then wait for the Viewer server to reply with a html page displaying the requested information, and then parse the html file sent back by the Ngram Viewer extracting the frequency information and saving it for future reference. At present the Ngram Viewer only allows queries to one subcorpus at a time, so our query tool would send the same query to the six subcorpora of interest.
The precision and recall of the queries were complicated by the variable spellings of the authors’ names. Consequently, the fact that query tools like the Google N-gram Viewer typically treat accented characters separately means that, for example, queries for ‘Selma Lagerlöf’ and ‘Selma Lagerlof’ produce different frequency trends, which need to be compensated for either by running multiple queries for the same name or, when available, running the queries using regular expressions or wild cards, as appropriate. Another thing to take into account is that many proper names also have established spellings in various languages, particularly in the historical context. Thus, for example, the family name of the Russian playwright Антон Чехов is written as Chekhov in English, Tchékhov in French, Tschechow in German, Chéjov in Spanish, and Čechov in Italian.20
While the names could be expected to be spelled correctly in their native context, there were many cases where especially English books would feature the names without an accent or an umlaut. This was a problem that primarily concerned French and German names, and the solution was to run queries for the same names with and without the accented character. The problem of false positives by way of hits that did not in fact refer to the famous author was essentially unavoidable given that Google Books does not give access to the individual hits; however, we conjecture that in virtually all the cases the vast majority of the hits are likely to be references to the correct person. We excluded from the present study any authors whose combination of first and last name was likely to be very common and thus lead to excessive numbers of false positives. It goes without saying that since the queries were always for the first name and last name of the author, references to an author by only their last name, a nickname or a personal pronoun could not be included.
Google books quantifies search results as a proportion of all ngrams of the same length per year: i.e., the normalised frequency of the pair first name + last name is expressed as a proportion of all sequences of two words, or in other words of two uninterrupted sequences of characters. Thus, for example, the normalised frequency of the name ‘Charles Dickens’ in the year 1900 is 1.52E-06 in British English and 7.58E-07 in American English;21 the scientific annotations natively used by the Ngram Viewer translate to 0.00000152 and 0.000000758, respectively.22 Because the overall word counts of each year in each corpus are not known, we use the proportional frequencies provided. Notably, the Ngram Viewer imposes a minimum threshold of 40 books per year for a word to register at all; if a given query term occurs in 39 or fewer books in any given year, the proportional frequency returned is 0.
The standard user interface of Google Books provides a line visualisation of the frequency trend. The trend line can be adjusted using a smoothing function, which applies a moving average algorithm to the year-by-year frequencies in order to produce either a more general representation of the trend (high smoothing) or a more accurate one (low smoothing). The former may be more desirable for seeing overall developments, but the downside is that sudden peaks and valleys in the data, which may be of particular historical or cultural interest, may be hidden. Figure X is a screenshot of the Ngram viewer graph for the query terms ‘Charles Dickens’ in the British English 2019 dataset with the smoothing set to the default value of 3.
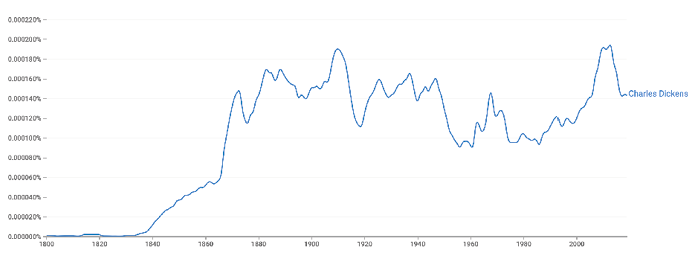
Figure 2. Output of Google Ngram Viewer for the query terms “Charles Dickens” in
the British English 2019 dataset with the smoothing set to the default value of 3.
Since we processed the data following the procedure described above, we produced our own visualisations, which also gave us more flexibility to combine data from multiple subcorpora and carry out further statistical analyses. As an example, Figure 2 shows the frequency curves for ‘Charles Dickens’ in all six language regions. By superimposing the curves for books in each of the six subcorpora we can visually explore correlations between the trendlines (Figure 3). Here, we see that references to Charles Dickens increase dramatically in both British and American books from the 1840s to about 1870, at which point American interest in Dickens appears to wane rapidly whilst British books appear to show a sustained, if somewhat fluctuating interest in Dickens for the next century.
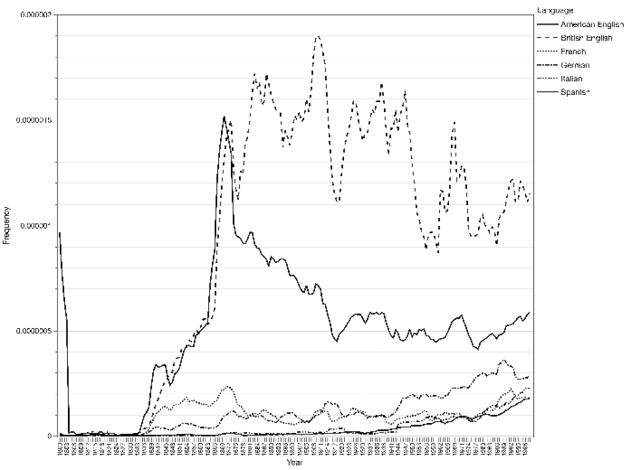
Figure 3. Trend lines for Charles Dickens in six of the Google Books datas ets.
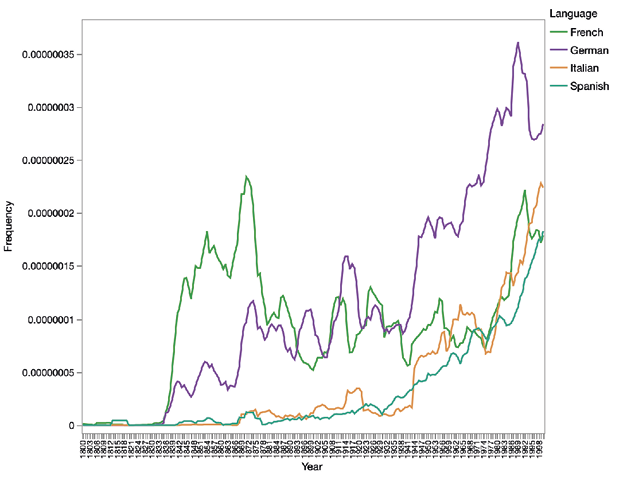
Figure 4. Trend lines for Charles Dickens, excluding English regions.
However, because the scale of the y-axis accommodates the much higher frequencies found in the American and British subcorpora, the variation in the subcorpora that show lower frequencies becomes more difficult to assess visually. To illustrate this effect, we remove the two English-language subcorpora from the data and plot the figure again (Figure 4):
What previously looked like almost flat lines are now revealed to show much more nuanced diachronic variation. The trend lines now show that interest in Dickens peaked in the French context during the same period it did in British and American books and periodicals, and re-emerged in the latter half of the twentieth century; in German books interest in Dickens has been rising steadily all the way since the 1830s; and in the Italian and Spanish contexts Dickensian studies and references to Dickens appear to have emerged only from the 1930s onward in apparent sync with the French.
Whilst the visual exploration of the trend lines is already informative and a perfectly legitimate analytical method,23 it would be beneficial also to examine the correlations using more explicitly quantitative methods. A classic method of exploring similarities between two sets of continuous variables such as frequencies is to study their linear correlation. However, due to the nature of our data, the magnitudes of frequencies can be very different between the different subcorpora and different authors, rendering straightforward correlations of frequencies misleading, especially if the intention is to compare correlations across different sections of the dataset. Given that our primary interest is in identifying trends instead of frequency differences, we transform the year-by-year frequencies of each author and language into standard scores.24 This is done by first calculating the mean and standard deviation of each sequence of frequencies, and then iterating over the sequence, calculating the difference between each frequency and the mean, and then dividing the resulting value by the standard deviation. Because standard deviation is a measure of the spread of a data specific to each sequence of frequencies, the standard scores allow us to meaningfully compare deviations from the mean across frequency lists that were originally of very different magnitudes. When the scores have been standardised, we can plot a scatterplot matrix and examine the correlations between the five subcorpora (Figure 5). The correlations are calculated using Pearson correlations.25 In the scatterplot matrix, the correlation between two specific subcorpora can be found at the horizontal and vertical intersection between the two labelled boxes.
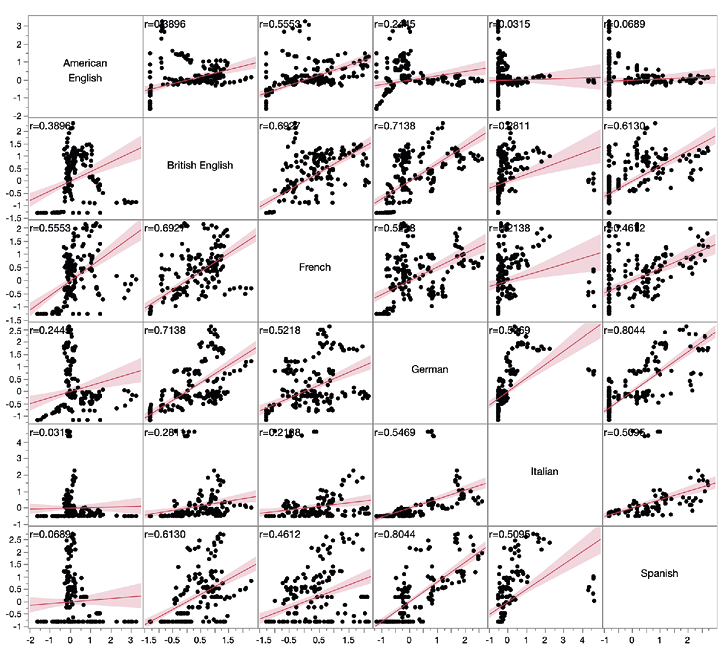
Figure 5. Scatter plot matrix of correlation between language regions for Charles Dickens
The line of best fit is a visual representation of the correlation between two sets of datapoints.26 Looking at the data for Charles Dickens, we see that the correlation between American English and British English is fairly weak (r=0.38), which matches with our earlier observation that the trendlines diverged around 1870 (Figure 3). On the other hand, as we saw in Figure 3, interest in Dickens peaked in French literature around the same time as it did in Britain, and then declined for a fairly long period of time. The similarity between British and French data is seen in the higher correlation coefficient (r=0.69). However, the most strongly correlated subcorpora are German and Spanish (r=0.80). All the pairwise correlations are statistically significant except Italian and Spanish.
What do the correlation coefficients contribute to our understanding of the rate at which authors gained prominence in the regions under investigation? Firstly, the quantitative analysis allows us to confirm whether our reading of a visualisation is accurate, or to examine the strengths of correlations that are not easy to assess from a plot. Secondly, and more importantly for the present study, the correlation coefficients can be used to assess and identify more universal trends in the overall dataset.
4. Patterns of literary prominence
Comparing the visualisations of all the authors across the six subcorpora allowed us to identify typical correlation patterns in the trendlines. As noted previously, our primary objective was not to focus on the absolute prominence of authors in specific language regions, but rather to explore the extent to which the authors’ rise to prominence co-occurred in different regions, which regions showed the most apparent correlations of trendlines, and whether specific subtypes of the above could be identified. We have been so far able to discern a number of types of international literary prominence.
4.1. Early giants. Given the constraints of the book market, changing linguistic competencies, availability of translations and many other factors, it was generally much more difficult for an author to become internationally prominent in the nineteenth century.
The most prominent example of a true early bestselling author is Sir Walter Scott. A poet in his earlier days, the Scottish author became an international literary giant through his historical novels, such as Waverley, Rob Roy and Ivanhoe. The trend lines reveal a remarkably uniform pattern more or less across the six language regions, especially up to the early twentieth century. However, we can also see that while interest in Scott’s novels continued more or less uninterrupted in continental Europe from the 1850s to the end of the timeline, it decreased steadily in the English-speaking world throughout the same period.
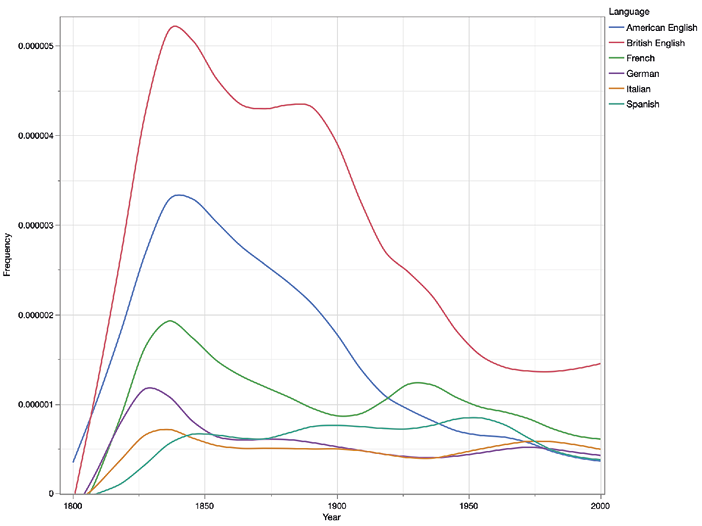
Figure 6. Trend lines for Walter Scott
Another author with a very similar pattern is Alexandre Dumas, whose popularity rose tremendously not only in France but across the regions following the 1844 serialised publication of Les Trois Mousquetaires (The Three Musketeers). Interestingly, the data shows that Dumas has generally been more popular in the Anglophone world than in Germany, Italy or Spain. Likewise, the American frontier novelist James Fenimore Cooper shows a sustained, if slightly declining popularity throughout the timeline.
4.2. Regional giants. The second subtype of literary prominence identified is the regional giant, that is, an author who is extraordinarily popular in their own language region but apparently fails to make a big mark elsewhere. Given the selection of authors we chose for this pilot study, authors falling into this category were relatively rare. In general, authors who gained a popular following in the domestic market or a strong foothold in their national intellectual arena were generally translated into other languages, often surprisingly quickly. Examples of this pattern include the British children’s novelist Enid Blyton (Figure 7) and the German-language novelist Franz Kafka (Figure 8).
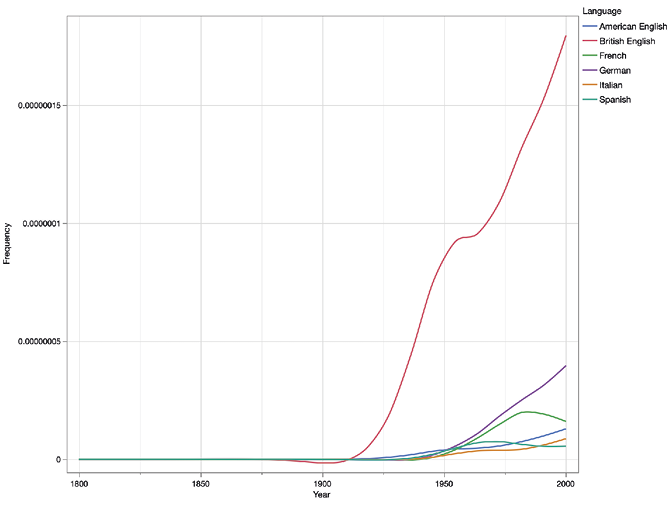
Figure 7. Trend lines for Enid Blyton
Blyton is an interesting example of an English-language novelist who was tremendously popular in her own country but never achieved great prominence in America. Indeed, the trend lines show that when Blyton started becoming more well-known outside the UK after the Second World War, she aroused more interest in Germany and France than in the United States. The magnitude of her popularity in Britain makes the correlations difficult to determine visually; in fact, the correlation coefficients are generally high: British and French r=0.962, British and Spanish r=0.962, British and American r=0.93.
Figure 8. Trend lines for Franz Kafka
In the case of Kafka, we likewise have a world-renowned author who nevertheless is much more prominent in his own region than internationally. Kafka’s trend lines correlate very strongly between German and American English (r=0.97) and between French and Italian (r=0.98). Similar patterns of regional popularity are found in association with, for example, Alberto Moravia, Anatole France, George Sand, Herman Hesse, etc.
Due to the current limitations of the Google Books data, it is impossible to study the domestic trend lines of authors originating from outside the selected few language regions. However, we turn our attention to two Nordic authors to exemplify how their works were received outside their native region. First, we have the Finnish novelist Mika Waltari, who is most famous for his historical novel Sinuhe egyptiläinen (The Egyptian), published in 1945 in Finnish and in quick succession in the Scandinavian languages, French, English and many other languages. The English translation in 1949 inspired a motion picture adaptation in 1954. As the trend lines suggest (Figure 9),27 the book was an instant success in all the language regions investigated, and secured Waltari a steady, if declining following. Waltari’s correlation coefficients are generally very low due to the fact that the instant success was followed by very different trajectories of fame in the different language regions.
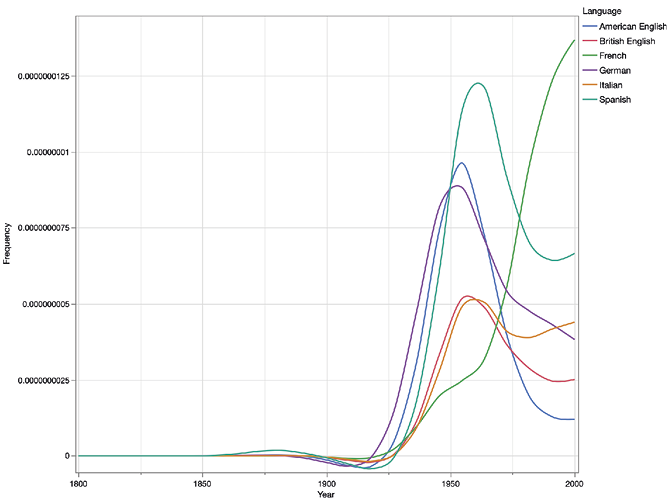
Figure 9. Trend lines for Mika Waltari
The second Nordic author we wanted to highlight is the Norwegian playwright and director Henrik Ibsen, who became most famous for Peer Gynt, Et Dukkehjem (A Doll’s House), and Gengangere (Ghosts). Like Waltari, Ibsen’s works gained international fame through translations, but unlike Waltari, Ibsen as a playwright was known through theatrical productions of his plays, rather than novels and short stories. As the trend lines show, Ibsen was particular well-received in the German market, somewhat less so in the Anglophone world, and to some extent in French. In Italian and Spanish, his prominence was relatively small to begin with, but it has been growing steadily (Figure 10). However, it looks like all three Romance languages follow a relatively similar pattern, with fairly high correlation coefficients (French and Spanish 0.93, French and Italian 0.90).
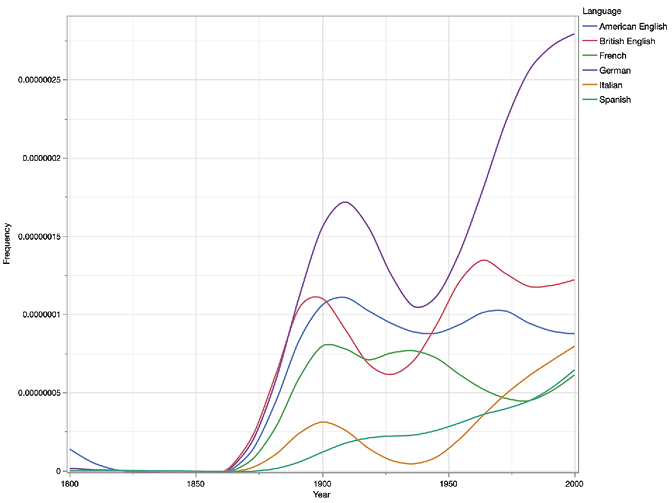
Figure 10. Trend lines for Henrik Ibsen
4.3. An Anglophone pattern. As would be expected, authors who wrote in English often tended to follow the Anglophone pattern, gaining popularity in American English and British English, but remaining relatively much less prominent in continental Europe. The trend lines of several authors reveal remarkable synchronicity across the Atlantic, with the trendlines in American and British English books resembling one another very closely. To give two illustrative examples, we highlight the American Henry James, the author of The Portrait of a Lady, which was first serialised and then published as a novel in 1881. The novel shot James into literary prominence in both the United States and Britain. Notably, the trend lines reveal that James was not widely read at all in the continental European market until the Second World War and thereafter. Another interesting detail is James’ apparently growing popularity in the Italian market during this time.
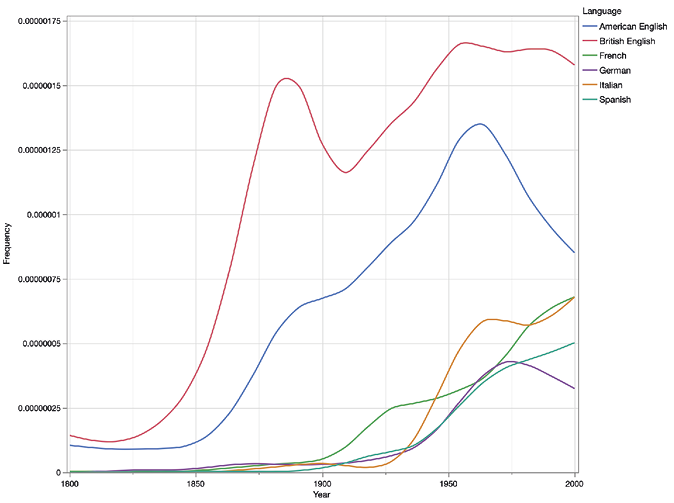
Figure 11. Trend lines for Henry James
4.4. A Modernist pattern. The modernist pattern is a term we use for authors who rose to prominence during the decades following the World Wars and whose trend lines show a uniform pattern of increase in more or less all the regions. As exemplified here by Milan Kundera (Figure 12), the Czech author of Nesnesitelná lehkost bytí (The Unbearable Lightness of Being), authors in this category can come from any country. It seems very likely that internationalisation of the literary marketplace and its responsiveness to local successes by rapidly translating the works to other languages contributes to this pattern. Literary prizes and successful intermedial translation to film and television naturally also add to an author’s positive trajectory of prominence. Kundera became particularly noted in French, and the correlations between French and American English (r=0.94) and French and German (0.99) are particularly strong. Similar patterns are found in association with Albert Camus, Czeslaw Milosz, Bertolt Brecht, Gabriel García Márquez, Karen Blixen, etc.
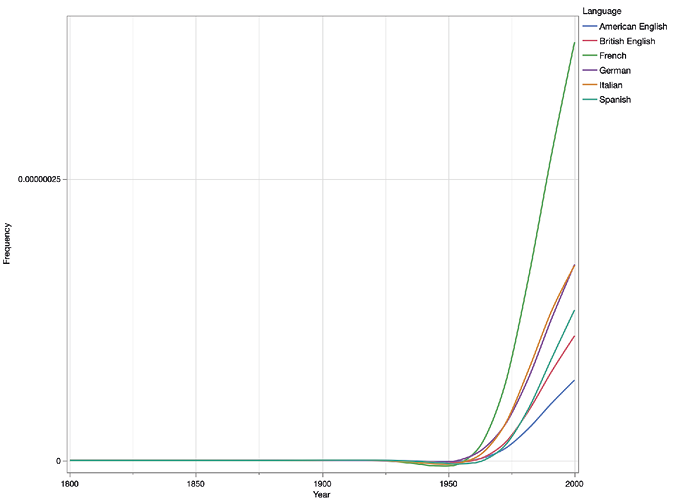
Figure 12. Trend lines for Milan Kundera
The American authors of the so-called Lost Generation, e.g., Ernest Hemingway, F. Scott Fitzgerald, Gertrude Stein and William Faulkner, all fall into the same pattern. As Figures 13 and 14 show, Faulkner and Hemingway quickly gained popularity not only in the United States and Britain, but also across the European continent — in fact, Faulkner in particular was more prominent in France and Germany than in the British market.
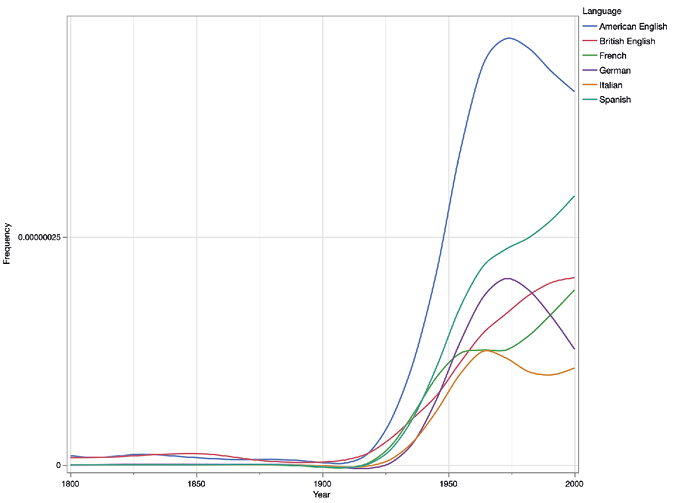
Figure 13. Trend lines for William Faulkner
Ernest Hemingway is an example of an author whose popularity underwent a meteoric rise. The trend lines reveal that since the early 1910s, Hemingway’s prominence has seemingly increased in all six markets year after year.
However, it is important to note that not all authors in this modernist category belong to intellectual literary movements. Authors of children’s literature, adventure fiction and other lighter reading also show similar patterns, such as J.R.R. Tolkien, Edgar Rice Burroughs and Frank Baum. Consequently, we suggest that the newly emerging pattern is perhaps primarily explained by the changing conditions of the book market — and perhaps also by underlying issues to do with the Google Books archive itself, such as the increasing proportion of periodicals in the latter decades, which may artificially increase references to specific authors. More research is needed.
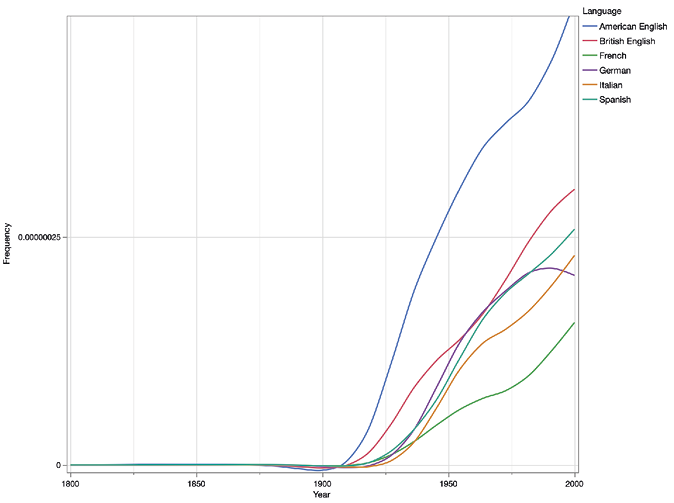
Figure 14. Trend lines for Ernest Hemingway
5. Discussion
The early findings of this pilot study have shown that nineteenth- and twentieth-century authors achieved prominence in the literary world following a number of different trajectories when examined from multilingual and transnational perspectives. It goes without saying that the different trajectories identified and the reasons that explain them deserve more in-depth study than we had space for here, but we feel that these observations already demonstrate that there is a place for quantitative studies of this type. Our next step will be to correlate findings from Google Books with similar queries using digitised newspaper archives from across Europe, focusing on authors whose patterns of prominence were discovered to be particularly intriguing.
The biggest challenge in the use of data driven research is to pose the right questions. In our case, it is difficult to shake off the intellectual constraints posed by the concept of national literatures. From this perspective, the Google Books Ngram Viewer and the Google Books data that it gives access to help us move forward, because they (currently) focus on large language areas: we cannot immediately know in which particular country the literary discussion takes place, e.g., what proportion of books written in German represent German, Austrian, or Swiss references to a particular author. The lack of precision and transparency can be seen as having both positive and negative consequences. Whilst the broad transnational perspective will afford a general overview of how authors were received in different linguistically defined cultural spheres, it goes without saying that it would be ideal if we could start with the real national literatures, and gradually and transparently work through the steps that lead to broader perspectives. If there was a similar tool for Europeana, it would be wonderful, but that is only a distant dream at the moment. Still, even with all the limitations, we should not overlook the great perspectives that the present tools already afford us.
We hasten to add here that we are very aware of the fact that this pilot study has concentrated on the literary world of Western Europe and the United States, which is close to us conceptually. A truly global perspective should be our goal, but there the linguistic and conceptual challenges grow exponentially.28
The second challenge is, at the moment at least, the limitations of using automated tools in the study of smaller European languages as well as of the very large non-European language areas (except Chinese).29 The world is multilingual, but only a few language areas are currently available on Google Books Ngram Viewer. However, even when more languages are added and the important objective of studying books and periodicals in more and more languages becomes a reality, there will be new challenges to be tackled. Answering more complicated research questions will require good proficiency in all the languages involved, and it goes without saying that no one can claim to really know all the European national languages, let alone the languages of the whole world. Even here, emerging new computational methods will be helpful, but there is no doubt that new transnational research projects using multilingual data will require expert participants from a wide range of language regions.
Finally, commenting briefly on the methodology adopted in the present study, a methodological shortcoming of the quantitative analysis that we will be ready to acknowledge is that the correlations analysis focused on the contemporaneity of the trends, rather than the shapes of the trends. In other words, if the trendlines for two language regions had the exact same shape but the trends occurred ten or twenty years apart, our method would probably score the correlation as a relatively weak one. Although this issue is somewhat addressed by means of visual data exploration, it would be preferable to use a statistical method for identifying similarities in trends, especially if the research question concerned how literary prominence emerges or develops. In future studies, we aim to explore more complex statistical methods for this, such as variable clustering30 and dynamic time warping.
6. Conclusions
The research we reported on in this article may appear conceptually different from traditional book historical research, and it is true that some basic knowledge of statistics and computer science is necessary for carrying out culturomics-style analyses. However, the methodological and technical challenges are by no means insurmountable and even if they are somewhat new in orientation, they do not exceed the demands of methodological exactitude inherent to scholarship in modern book history and the history of reading.31 We would argue that these and similar computational methods can help elevate the study of book history and history of reading to a new level by providing massive amounts of primary data that may reveal entirely new patterns of reference and discourse, and consequently confirm or challenge previously held understandings from an empirical standpoint. This pilot study did not explore more complex statistical methods for identifying relevant patterns in the data, which is a topic the authors are looking forward to discussing in follow-up studies.
Traditionally, the study of manuscripts and incunabula has self-evidently been a pan-European field of research, and we posit that the same should be the goal in book history and history of reading in general, with a global view as the final goal. This kind of research presents us with great challenges, but, as we hope to have been able to show in this article, they can be overcome with new technical, methodological and conceptual tools.
Reference list
ALGEE-HEWITT, Mark; MCGURL Mark. Between Canon and Corpus: Six Perspectives on Twentieth-Century Novels. Stanford Literary Lab Pamphlet Series, 2015. Access through Internet: http://litlab.stanford.edu/LiteraryLabPamphlet8.
DILLER, Hans-Jürgen. Words for Feelings: Studies in the History of the English Emotion Lexicon. Heidelberg: Universitätsverlag Winter, 2014. 446 p. ISBN 978-3-8253-6359-8.
ENGLISH, James F. Prestige, Pleasure, and the Data of Cultural Preference: “Quality Signals” in the Age of Superabundance. Western Humanities Review, 2016, vol 70 (3). Access through Internet: <http://www.westernhumanitiesreview.com/fall-2016-70-3/prestige-pleasure-and-the-data-of-cultural-preference-quality-signals-in-the-age-of-superabundance/>
HEILBRUN, James. 1997. The competition between high culture and popular culture as seen in the New York Times. Journal of Cultural Economics, 1997, vol. 21, p. 29–40. ISSN 1573-6997.
Hiltunen, Turo; Räikkönen, Jenni; Tyrkkö, Jukka. Investigating colloquialization in the British parliamentary record in late 19th and early 20th century. In Hiltunen,Turo; Loureiro Porto, Lucía (eds.). Language Sciences 79, 2020, Special Issue on “New perspectives on democratization: Evidence from English(es)”. ISSN (Print) 0388-0001.
How and what did people of past ages read. Researchers encounter a host of scholarly puzzles. The Chronicle of Higher Education, July 14, 1993, A8. ISSN 1931-1362.
Keim, Daniel; Ward, Matthew. Chapter 11. Visualization. In Michael R. Berthold & David J Hand (eds.) Intelligent Data Analysis: An Introduction. Berlin & London: Springer, 2007, 403–427.
Koplenig, Alexander. 2017. The impact of lacking metadata for the measurement of cultural and linguistic change using the Google Ngram data sets—Reconstructing the composition of the German corpus in times of WWII. Digital Scholarship in the Humanities, 2017, vol. 32 (1), p. 169–188. ISSN 2055-7671.
Kuhn, Jonas. Computational text analysis within the Humanities: How to combine working practices from the contributing fields? Language Resources & Evaluation, 2019, vol. 53, p. 565–602. ISSN 1574-020X.
Laitinen, Mikko; Säily, Tanja. Google Books: a shortcut to studying language variability? In Nevalainen, Terttu; Palander-Collin, Minna; Säily, Tanja (eds.). Patterns of Change in 18th-century English: A sociolinguistic approach. Amsterdam: John Benjamins, 2018, p. 223–233. ISBN 90-272-0103-X.
Mäkelä, Eetu; Tolonen, Mikko; Marjanen, Jani; Kanner, Antti; LAHTI, Leo. 2019. Interdisciplinary collaboration in studying newspaper materiality. In Krauwer, S.; Fišer, D. (eds.). Proceedings of the twin talks workshop at DHN 2019, co-located with digital humanities in the Nordic countries. CEUR Workshop Proceedings, 2019, vol. 2365, p. 55–66 [accessed 9 October 2021]. Access through Internet: <http://ceur-ws.org/Vol-2365/>.
MÄKINEN, Ilkka. Leselust, Goût de la Lecture, Love of Reading: Patterns in the discourse on reading in Europe from the 17th until the 19th century. In Navickienė, Aušra; Mäkinen, Ilkka; Torstensson, Magnus; Dyrbye, Martin; Reimo, Tiiu (eds.). Good Book, Good Library, Good Reading. Studies in the History of the Book, Libraries and Reading from the Network HIBOLIRE and Its Friends. Tampere: TUP, 2013 [accessed 9 October 2021]. 315 p. ISBN 978-951-44-9142-9. Access through Internet: <http://urn.fi/URN:NBN:fi:uta-201404021299>.
MÄKINEN, Ilkka. From Literacy to Love of Reading: The Fennomanian Ideology of Reading in the 19th-century Finland. Journal of Social History, 2015, t. 48, p. 287–299. ISSN 0204-2061.
MÄKINEN, Ilkka. Love of Reading Meets PISA Assessments: Historical Insights in the Discourse on Reading Motivation. Knygotyra, 2018, t. 70, p. 57–77. ISSN 0204-2061.
MÄKINEN, Ilkka. Diffusion of the Discourse on the Love of Reading in Europe from the 18th to the 20th Centuries. Knygotyra, 2019, t. 73, p. 203-229. ISSN 0204-2061.
Mäkinen, Ilkka; Tyrkkö, Jukka. Collocates and phraseologies associated with the concept of reading in early and late modern printed texts in English. Unpublished conference presentation at SHARP 2014, Antwerp, Sept. 17–20, 2014.
Marjanen, Jani; Vaara, Ville; Kanner, Antti; Roivainen, Hege; Mäkelä, Eetu; Lahti, Leo; Tolonen, Mikko. 2019. A National Public Sphere? Analysing the Language, Location and Form of Newspapers in Finland, 1771–1917. Journal of European Periodical Studies, 2019, vol. 4: 1, p. 54–77. ISSN 2506-6587.
MICHEL, Jean-Baptiste et al. Quantitative Analysis of Culture Using Millions of Digitized Books. Science, 2011, vol. 331, issue 6014, p. 176–182. ISSN 0036-8075. DOI: https://www.science.org/doi/10.1126/science.1199644.
Moretti, Franco. Distant Reading. London and New York: Verso, 2013. ISBN 978-1-78168-112–1.
Nevala, Minna; Tyrkkö, Jukka. From Criminal Lunacy to Mental Disorders: The changing lexis of mental health in the British Parliament. In Korhonen Minna; Kotze, Haidee; Tyrkkö, Jukka (eds.). Exploring Language and Society with Big Data: Parliamentary discourse across time and space. Amsterdam: John Benjamins. [Forthcoming.]
Oberbichler, Sarah; Boroş, Emanuela; Doucet, Antoine; Marjanen, Jani; Pfanzelter, Eva; Rautiainen, Juha; Toivonen, Hannu; Tolonen, Mikko. Integrated interdisciplinary workflows for research on historical newspapers: Perspectives from humanities scholars, computer scientists, and librarians. Journal of the Association for Information Science and Technology, E-pub ahead of print – 18 Aug 2021 [accessed 9 October 2021]. ISSN 2330-1635. Access through Internet: <https://doi.org/10.1002/asi.24565>, Online Version of Record before inclusion in an issue.
Rütten Ellen; Fedor, Julie; Zvereva, Vera. Memory, Conflict and New Media: Web Wars in Post-Socialist States. Abingdon UK: Routledge, 2013. ISBN 978-0-415-63921-7.
Schöch, Christof. Big? Smart? Clean? Messy? Data in the Humanities. Journal of Digital Humanities, 2013, vol. 2 (3), p. 2–13. ISSN 2165-6673.
UNDERWOOD, Ted; SELLERS, Jordan. 2016. The Longue Durée of Literary Prestige. Modern Language Quarterly, 2016, vol. 77 (3), p. 321–344. ISSN 1527-1943.
VERBOORD, Marc. Classification of authors by literary prestige. Poetics, 2003, vol. 31 (3–4), June–August, p. 259–281. ISSN 0304-422X.
Appendix
List of the 100 authors included in the pilot study
Agatha Christie, Albert Camus, Alberto Moravia, Alexandre Dumas, Edgar Allan Poe, Anatole France, Antoine de Saint-Exupéry, Arnold Bennett, Arthur Conan Doyle, Astrid Lindgren, August Strindberg, Beatrix Potter, Benjamin Disraeli, Bertolt Brecht, Bram Stoker, Percy Bysshe Shelley, C.S. Lewis, Charles Baudelaire, Charles Dickens, Charlotte Brontë, Czeslaw Milosz, Hans Christian Andersen, Honoré de Balzac, Guy de Maupassant, Dean Howell, Edgar Wallace, Émile Zola, Emily Brontë, Enid Blyton, Ernest Hemingway, F. Scott Fitzgerald, Frank Baum, Franz Kafka, Franz Werfel, Gabriel García Márquez, George Eliot, George Meredith, George Sand, Gertrude Stein, Gustave Flaubert, H.G. Wells, Hedwig Courths-Mahler, Henri Bordeaux, Henrik Ibsen, Henry James, Herman Melville, Hermann Hesse, Italo Calvino, Jack London, James Fenimore Cooper, James Joyce, Jan Neruda, Jane Austen, Jaroslaw Hasek, Jean Paul Sartre, John Keats, John Steinbeck, Joseph Conrad, Jules Verne, Karen Blixen, Karl May, Leo Tolstoy, Lewis Carroll, Lord Byron, Louis Stevenson, Lucy Aikin, Luis Borges, Marcel Proust, Margaret Mitchell, Maria Remarque, Marie Corelli, Mark Twain, Mary Shelley, Maxim Gorky, Mika Waltari, Milan Kundera, Nathaniel Hawthorne, Oscar Wilde, P.G. Wodehouse, Edgard Rice Burroughs, Rudyard Kipling, Selma Lagerlöf, Simone de Beauvoir, Somerset Maugham, Stanislav Lem, Stefan Zweig, Stendhal, Thomas Hardy, Thomas Mann, J.R.R. Tolkien, Tove Jansson, Umberto Eco, Victor Hugo, Virginia Woolf, Vladimir Nabokov, Walter Scott, Washington Irving, William Butler Yeats, William Faulkner, William Wordsworth.
1 The authors wish to express their gratitude to the anonymous referees for their constructive comments.
2 How and what did people of past ages read. Researchers encounter a host of scholarly puzzles. The Chronicle of Higher Education, July 14, 1993, A8.
3 Schöch, Christof. Big? Smart? Clean? Messy? Data in the Humanities. Journal of Digital Humanities, 2013, vol. 2 (3), p. 2-13.
4 Kuhn, Jonas. Computational text analysis within the Humanities: How to combine working practices from the contributing fields? Language Resources & Evaluation, 2019, vol. 53, p. 565–602.
5 The textual content of the Google Books corpora can be downloaded as lists of n-grams of various lengths, but the full text cannot be queried using computational methods.
6 E.g., MÄKINEN, Ilkka. Leselust, Goût de la Lecture, Love of Reading: Patterns in the discourse on reading in Europe from the 17th until the 19th century. In Navickienė, Aušra; Mäkinen, Ilkka; Torstensson, Magnus; Dyrbye, Martin; Reimo, Tiiu (eds.). Good Book, Good Library, Good Reading. Studies in the History of the Book, Libraries and Reading from the Network HIBOLIRE and Its Friends. Tampere: TUP, 2013; MÄKINEN, Ilkka. From Literacy to Love of Reading: The Fennomanian Ideology of Reading in the 19th-century Finland. Journal of Social History, 2015, t. 48, p. 287–299; MÄKINEN, Ilkka. Love of Reading Meets PISA Assessments: Historical Insights in the Discourse on Reading Motivation. Knygotyra, 2018, t. 70, p. 57–77; MÄKINEN, Ilkka. Diffusion of the Discourse on the Love of Reading in Europe from the 18th to the 20th Centuries. Knygotyra, 2019, t. 73, p. 203–229; Mäkinen, Ilkka; Tyrkkö, Jukka. Collocates and phraseologies associated with the concept of reading in early and late modern printed texts in English. Unpublished conference presentation at SHARP 2014, Antwerp, Sept. 17–20, 2014.
7 Google Books digitises copies of periodicals such as journals and magazines, but not daily newspapers.
8 The online version of the Ngram Viewer does allow the user to jump to random examples drawn from the books, but these cannot be systematically studied.
9 https://en.wikipedia.org/wiki/List_of_best-selling_books .
10 https://www.nobelprize.org/prizes/lists/all-nobel-prizes-in-literature/;
https://en.wikipedia.org/wiki/List_of_Nobel_laureates_in_Literature .
11 All visualisations and statistical analyses were produced from Google Books data using the statistics tool JMP. The word count data is freely available from the Google Ngram Viewer website, though the data needs to be manually compiled from multiple documents.
12 MICHEL, Jean-Baptiste et al. Quantitative Analysis of Culture Using Millions of Digitized Books. Science, 2011, vol. 331, Issue 6014, p. 176–182.
13 See also Moretti, Franco. Distant Reading. London and New York: Verso, 2013.
14 E.g., Koplenig, Alexander. 2017. The impact of lacking metadata for the measurement of cultural and linguistic change using the Google Ngram data sets—Reconstructing the composition of the German corpus in times of WWII. Digital Scholarship in the Humanities, 2017, vol. 32 (1), p. 169–188.
15 Rütten Ellen; Fedor, Julie; Zvereva, Vera. Memory, Conflict and New Media: Web Wars in Post-Socialist States. Milton Park, Abingdon UK: Routledge, 2013.
16 See footnote 4.
17 DILLER, Hans-Jürgen. Words for Feelings: Studies in the History of the English Emotion Lexicon. Heidelberg: Universitätsverlag Winter, 2014; Laitinen, Mikko; Säily, Tanja. Google Books: a shortcut to studying language variability? In Nevalainen, Terttu; Palander-Collin, Minna; Säily, Tanja (eds.). Patterns of Change in 18th-century English: A sociolinguistic approach. Amsterdam: John Benjamins, 2018, p. 223–233.
18 LiveCode is a cross-platform rapid application development runtime system inspired by Apple’s HyperCard. The LiveCode software creates applications that run in many supported environments.
19 API stands for Application Programming Interface. APIs are rules-governed programming interfaces that allow two computers or computer systems to communicate with each other. A common type of API is the web API, which looks like a long html address that has a specific structure which communicates to a host computer what information it should send in return. The Ngram Viewer’s API includes slots for the query term, choice of subcorpus, time period, etc.
20 Morever, in Russian a person’s name is typically written with the patronym between the first name and the family name (here Павлович, or Pavlovich), a practice that is only rarely observed in foreign literature. Since the queries are strings of characters, optimal accuracy would require either running queries for the language-specific established spellings both with and without the patronym, or using a wild card character indicating an optional word in-between the first name and last name.
21 The so-called scientific E-notation of numbers gives very large numbers as a decimal followed the number of zeroes expressed as a power of 10. In the case of the Ngram Viewer, the frequencies are proportions of all ngrams for the given year and consequently the E-number indicates the number of decimal points; for example, 1.52E-06 translates to 0.00000152.
22 To complicate matters a bit more, the graph produced by the Ngram Viewer (Figure 1) expresses the proportional frequencies as percentages, so 0.00000152 becomes 0.000152. This is presumably done to make the numbers somewhat shorter. It goes without saying that there is no one correct way to present these frequencies.
23 In the field of data visualisation, visual data exploration is considered a crucial first step in all analysis regardless of whether or not other methods are also used (see e.g., Keim & Ward 2007).
24 The transformation of frequencies into standard scores, or z scores, is a common step in many statistical machine learning methods, such as hierarchical clustering and principal component analysis. Because the distributional properties of normally distributed data are known, standard scores can also be used to assess the probabilities of outcomes; for example, in normally distributed data, 95.5% of the data points fall within 2 standard deviations of the mean.
25 The Pearson correlation coefficient r indicates the strength and direction of the correlation with standardised values ranging between -1 and 1, with 0 indicating no correlation at all. The statistical significance of each pairwise correlation indicates whether the sample is sufficient to allow us to make reliable inferences about the population. The typical reasons for lack of statistical significance in correlation analyses are lack of data points or strong fluctuation in the data, which means that the linear trend line explains less of the variation in the data.
26 It is important to remember here that the correlations do not directly show the progress of time, but rather each datapoint reflects the standardised deviations from the mean of two frequencies at a given point of time. The line of best fit is a first degree polynomial equation, also known as a least-squares regression line. It is the line from which the sum of the squared distances to each individual data point is as small as possible.
27 Note that when polynomial trend lines are drawn, it may sometimes look as though there is period of time of growing popularity, when in fact the success was almost instant. Waltari was more or less unknown in the international book market prior to the late 1940s.
28 The challenges stem in large part from the fact that literature as media and the structures of the literary markets are conceptually western.
29 As of 2021, the Ngram Viewer also gives access to publication in Russian and Hebrew in addition to the languages already discussed.
30 See Hiltunen, Turo; Räikkönen, Jenni; Tyrkkö, Jukka. Investigating colloquialization in the British parliamentary record in late 19th and early 20th century. In Hiltunen, Turo; Loureiro Porto, Lucía (eds.). Language Sciences 79, 2020, Special Issue on “New perspectives on democratization: Evidence from English(es)”; Nevala, Minna; Tyrkkö, Jukka. From Criminal Lunacy to Mental Disorders: The changing lexis of mental health in the British Parliament. In Korhonen Minna; Kotze, Haidee; Tyrkkö, Jukka (eds.). Exploring Language and Society with Big Data: Parliamentary discourse across time and space. Amsterdam: John Benjamins. [Forthcoming.]
31 The authors invite correspondence from colleagues interested in these and related methods.