Organizations and Markets in Emerging Economies ISSN 2029-4581 eISSN 2345-0037
2024, vol. 15, no. 2(31), pp. 356–377 DOI: https://doi.org/10.15388/omee.2024.15.17
Examining the Impact of Bank Cost Efficiency on Non-Performing Loans in a Dollarised Economy: Evidence from Zimbabwe
Blessing Katuka (corresponding author)
University of the Free State, South Africa
blessingkatuka@gmail.com
https://orcid.org/0000-0003-4716-8399
https://ror.org/009xwd568
Calvin Mudzingiri
University of the Free State, South Africa
MudzingiriC@ufs.ac.za
https://orcid.org/0000-0002-1186-4109
https://ror.org/009xwd568
Edson Vengesai
University of the Free State, South Africa
VengesaiE@ufs.ac.za
https://orcid.org/0000-0002-9088-2603
https://ror.org/009xwd568
Juniours Marire
Rhodes University, South Africa
j.marire@ru.ac.za
https://orcid.org/0000-0002-6648-7582
https://ror.org/016sewp10
Abstract. This paper investigates the effects of cost efficiency on non-performing loans (NPLs) in Zimbabwe during dollarisation. The research applies the random effects and bootstrap quantile regression models using the full dollarisation era dataset for 13 banks from 2009 to 2017. The obtained results revealed that: (i) the average cost efficiency score for the Zimbabwean banking industry is 81.36%, (ii) improvement in cost efficiency leads to an increase in NPLs but begins to fall for a cost inefficiency level of 7.14% and below, (iii) the effect of bank cost efficiency on NPLs is prominent and highly significant at a higher quantile (90th), (iv) the interaction effect between cost efficiency and bank size on NPLs is negative and significant. According to these results, NPLs tend to fall when large banks are more cost-efficient. Thus, the present study recommends that banks employ strategies that simultaneously improve the asset base and cost efficiency.
Keywords: non-performing loans, cost efficiency, skimping hypothesis, dollarisation, quantile regression, quadratic regression
Received: 8/3/2024. Accepted: 20/6/2024
Copyright © 2024 Blessing Katuka, Calvin Mudzingiri, Edson Vengesai, Juniours Marire. Published by Vilnius University Press. This is an Open Access article distributed under the terms of the Creative Commons Attribution Licence, which permits unrestricted use, distribution, and reproduction in any medium, provided the original author and source are credited.
Introduction
Non-performing loans are a big challenge in most developing economies. The dominance of non-performing loans (NPLs) reduces the capacity of banks to lend to economic agents, thus lowering the credit multiplier effect (Chen & Lee, 2023). More so, growth in non-performing loans stock has broader ramifications on the banking industry’s performance, and authorities should endeavour to keep them under control since resolving NPLs that have reached systemic levels is costly and complex (Baudino & Yun, 2017; Bellotti et al., 2021). NPLs can lead to bank failures and bank runs, which precipitates financial crisis that stifles economic growth. The severity of the impact of bank failure on the economy has been witnessed by the collapse of Banco Popular in Spain in 2017, Lehman Brothers in USA in 2008 and Northern Rock in the UK in 2007. Also, a more recent case is the collapse of Silicon Valley Bank in the US which significantly shakened the US banking industry (Vo & Le, 2023).
The connection between non-performing loans and bank cost efficiency is a subject of substantial interest in the banking sector. While the relationship between non-performing and bank cost efficiency loans is multidimensional, existing studies posit that the two are interlinked (Büyükoğlu et al., 2021; Khan et al., 2020). As defined by Kocisova (2014), cost efficiency measures how close a bank’s expenditure is to a best-practice bank’s cost for producing the same output bundle under the same conditions. Thus, a cost-efficiency test is essential because it indicates whether the bank’s inputs should be reduced or increased. In their extensive work in the US, Berger and DeYoung (1997) discovered that declining cost-efficiency causes NPLs to rise, and they termed this the bad management hypothesis. In the same paper, the authors also noted that high cost-efficiency results in high NPLs, and they referred to this condition as the skimping hypothesis. In addition to these hypotheses, Berger and DeYoung (1997) also propounded the bad luck hypothesis, which postulates that external events instigate an increase in NPLs, which leads to deteriorating cost efficiency.
In the Zimbabwean context, NPLs were prevalent before and after dollarisation. As a result, the growth in NPLs eroded banks’ solvency and profitability (Masunda, 2014). The increase in NPLs had system-wide implications that stopped the banking system from performing its normal mandate, thus distorting the financial intermediation process.
Concerning industry’s efficiency, the cost-efficiency ratio (measured by the cost-to-income ratio) was highly volatile during dollarisation. The industry’s cost-to-income ratio worsened to 185% in 2011 from 94.38% in 2009. By the end of the dollarisation era in 2017, the ratio had improved to 75.36% (Reserve Bank of Zimbabwe, 2018). However, the fluctuations in the cost-efficiency ratio affect banks’ NPLs position as assumed by bad management and skimping hypotheses (Mamonov, 2013). Low and high cost-efficiency periods may have triggered a rise in NPLs in Zimbabwe. To examine the effect of cost efficiency on NPLs in Zimbabwe, the researchers resorted to empirical analysis for the entire dollarisation period. Concomitantly, banks were reported to be profiteering from charging exorbitant rates and fees to bank customers (Abel, 2018). This raised questions on whether Zimbabwean banks are efficient or inefficient in their operations. Following the notion that Zimbabwean banks follow a traditional banking model where lending is their main activity that creates assets and generates most of their income, it is imperative to empirically examine how cost-efficiency trends influenced NPLs.
The paper’s main goal is to investigate the effect of bank cost efficiency on NPLs formation. The paper adds to the existing literature in the following ways. While previous studies have explored various factors that contribute to non-performing loans formation, to the best of the authors’ knowledge, none examined the interaction effect of cost efficiency and bank size and capitalisation on NPLs in the literature. Moreover, little has been done to test for the possibility of both positive and negative effects of cost efficiency on NPLs. First, the novelty of this study lies in examining the combined role of cost efficiency, bank size, and capitalisation on NPL formation, thus providing new insights into the nexus between efficiency and non-performing loans. Second, the study will test for the possibility of cost efficiency having both positive and negative effects on NPLs through the use of a quadratic function. Third, while other studies have focused on generalising the impact of cost efficiency on NPLs, this article advances the current literature by examining the influence of bank cost efficiency on NPLs across different quantiles. Understanding the relationship between non-performing loans formation and bank cost efficiency is crucial for banks and policymakers, as it aids in decision making concerning operational efficiency and risk management (Liu & Huang, 2022). For example, if banks can improve their cost efficiency, they may be better equipped to mitigate the risk of non-performing loans, benefiting both the bank and the broader economy. The rest of the study is organised as follows: literature review, data and methodology, empirical findings and conclusions.
2. Literature Review
2.1 Theoretical Review
Several theories in literature explain the sources of non-performing loans. The institutional theory suggests that banks’ non-performing loan (NPL) rates and operational efficiency may be affected by the institutional environment in which they operate (Adegboye et al., 2020; Weber, 2016). Banks in countries with poor legal and regulatory systems may have higher non-performing loan (NPL) levels and worse cost efficiency. The information asymmetry hypothesis suggests that bank–borrower information asymmetry may raise NPL levels and reduce cost efficiency. When borrowers know more about their credit worthiness and capacity to repay loans than banks do, banks may make suboptimal lending decisions that raise NPL ratios (Kingu et al., 2018).
The discussion about bank cost efficiency and NPLs nexus is primarily based on Berger and DeYoung (1997) three theories: the bad management hypothesis (BMH), the skimping hypothesis (SH), and the bad luck hypothesis (BLH). In their version, they proposed the bad management hypothesis, which states that a decrease in cost efficiency causes an increase in NPLs. Based on the theory, managerial inefficiencies in loan underwriting and monitoring result in high NPLs. The theory, therefore, predicts a negative relationship between NPLs and cost efficiency.
The second hypothesis proposed by Berger and DeYoung (1997) is the skimping hypothesis which suggests a positive relationship between cost efficiency and NPLs. Due to high-profit motives, managers allocate inadequate resources that improve bank cost efficiency in the short run but compromise the long-term quality of the loan portfolio.
Berger and DeYoung (1997) also proposed the bad luck hypothesis (BLH), which stipulates that the increase in NPLs arises from external factors that cause a decline in cost efficiency. For example, external events such as regional recessions harm borrowers’ repayment capacity, resulting in high default rates and rising non-performing loans. Furthermore, banks incur high costs in their efforts to recover defaulted loans, including expenses for workout arrangements, monitoring defaulted borrowers, and seizing, maintaining, and disposing of assets (Ahmad & Bashir, 2013). As a result, more managerial effort and expense lead to a decrease in bank cost efficiency. In brief, Berger and DeYoung (1997) concluded that the BLH predicts that an increase in NPLs causes a reduction in cost efficiency.
2.2 Empirical Review
Close scrutiny of the existing empirical literature revealed that NPLs are indeed a cause for concern for banking industry stability (Atoi, 2019; Foglia, 2022; Khairi et al., 2021; Khan et al., 2020; Yitayaw et al., 2023; Katuka et al., 2023). In the US, Phung, Van Vu, and Tran (2022) examined the impact of NPLs on bank efficiency and the mitigating effects of bank capitalisation. The study applied data envelopment analysis (DEA) on panel data from 1994–2018. Findings suggested a negative relationship between bank efficiency and NPLs. Furthermore, their study also indicated that highly capitalised banks could reduce the effect of NPLs on bank efficiency.
A study by Mataba, Aikaeli and Kirama (2016) applied an explanatory sequential research design to examine the linkage between cost efficiency and NPLs using a panel of 9 Tanzanian community banks from 2002 to 2014. Data envelopment analysis was employed to estimate cost efficiency scores for banks. The Tobit simultaneous equation regression method suggested that bad management and bad luck contributed to NPLs formation in the Tanzanian study. However, bad luck was identified as the primary source behind growth in NPLs and cost inefficiencies among banks. The study deduced dependent and independent bad luck variables, namely, cost efficiency score relative to the best bank in the year and yearly NPLs, respectively. However, these two variables cannot precisely account for the external environment. Bad luck stems from the outside environment; therefore, there is a need to introduce a more appropriate proxy for external events. Differently put, it is inappropriate to proxy for external events using a bank-level variable.
Cascading down to the Zimbabwean context, Abel (2018) analysed the relationship between NPLs and cost efficiency in 11 commercial banks using bi-annual data from 2009–2014. The study utilised DEA under the constant returns to scale (CRS) assumption to examine cost efficiencies. Abel (2018) concluded that the average cost efficiency for banks during 2009–2014 was 81%. This finding translates to 19% inefficiency in the banking sector. Furthermore, the granger causality test results pointed out that cost inefficiency granger causes NPLs, thus supporting the bad management hypothesis. The results are consistent with van Benthem (2017) in the worldwide and EU commercial banks dataset. Van Benthen (2017) concluded that the bad management hypothesis was leading in the overall sample and all sub-samples.
Although Abel (2018) made substantial progress in investigating the relationship between NPLs and cost efficiency, the study lacks several essential aspects. Firstly, due to market imperfections and other market frictions, applying the CRS assumption subjected the study findings to criticism since CRS only produces reliable results when there are no market frictions, and banks operate on the efficient frontier. This is most unlikely in developing economies’ banking industries, such as Zimbabwe. An improvement in the present study is the application of the variable returns to scale (VRS) DEA model. Secondly, Abel’s (2018) study partly covered the dollarisation period, thus failing to account for changes in the behaviour of variables of interest for the entire dollarisation era. Our study closed the literature void by covering Zimbabwe’s full dollarisation era. This is an essential step in the literature as it provides a clear picture of the relationship between NPLs and cost efficiency during the official dollarisation period.
Previous literature also emphasised the direct effect of cost efficiency on NPLs, focusing less on the potential interaction effects between cost efficiency and other key variables. As a deviation from previous studies, the present research enriched the literature by examining the potential interaction effect between cost efficiency, bank size and capitalisation with NPLs, which is a new perspective in the literature. The motivation for examining the interaction terms is to assess how the changes in bank size and capitalisation when interacting with cost efficiency levels influence NPLs. Several studies have argued that size and capitalization influence both NPLs and cost efficiency, but the examination of the interaction effects between these variables has remained understudied.
3. Data and Methodology
3.1 Data Description
The study analysed data from a panel of 13 banks from 2009 to 2017, covering Zimbabwe’s official dollarisation era. The rationale for selecting the dollarisation era was due to a fully functional credit market and a stable currency as opposed to the hyperinflationary data that existed before and after full dollarisation. Data compiled from annual bank reports and bank supervision publications were used in the study. The sample constituted six local banks and seven foreign-owned banks. Table A1 in the Appendix lists variables used in the analysis and expected relationships as well as the supporting literature. The analysis branches into two stages. The first stage focuses on estimating cost efficiency by banks, and the final step examines its effect on NPLs.
3.2 Estimating Cost Efficiency
The paper assumed an intermediation approach where banks transform inputs such as labour, capital, and deposits to produce a given set of outputs such as loans and income. Similarly, under the intermediation approach, banks serve as a conduit through which surplus-spending units lend to deficit-spending units. The study applied DEA, a non-parametric method, assuming variable returns to scale because the CRS assumption only produces reliable estimates when banks operate on an optimal scale (Roman et al., 2011). However, such scenarios are less likely in most third-world countries due to market imperfections and other frictions in the market, such as financial constraints. Therefore, input-oriented DEA was applied to estimate the cost efficiency scores for banks assuming VRS.
In the analysis, three inputs, namely labor (x1), capital (x2) and deposits (x3) were assumed. Total loans (y1) and total income (y2) were treated as model outputs. The use of inputs by banks generates a cost, and the price of each input is the cost ratio to each selected input. The price of deposits was estimated as the ratio of total interest expenses to gross deposits (d). Furthermore, the price of capital is expressed as the ratio of operating expenses to fixed assets (k). Like Rossi, Schwaiger and Winkler (2011) and Abel (2018), the paper used total assets data to proxy the number of employees due to data unavailability. Thus, the price of labour was computed as the ratio of labour cost to total assets (w). All inputs and outputs are expressed in dollar terms. Given p decision ecision making units (DMUs) and that the jth DMU uses m inputs  to produce s outputs
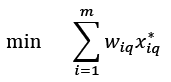
  , the cost-efficient model, based on Kocisova (2014) and Abel (2018), becomes:
 (1)
(1)
subject to:
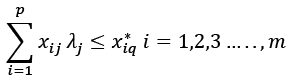 (2)
(2)
 (3)
(3)
 (4)
(4)
Equation (1) specifies cost efficiency estimation using DEA, where wiq represents the input price of a decision-making unit (DMU)q, x*iq denotes cost minimizing inputs for DMUq provided that the inputs price (wiq ) and output (yrq) are specified. We defined overall cost efficiency as follows:
 (6)
(6)
The numerator in equation (6) is the minimum cost of production, while the denominator is the observed cost of output. In using the DEA method, the cost efficiency variable (CE) ranges from 0 to 1. The efficiency score for the most efficient bank is 1 or 100%, implying that the bank is operating on the efficient frontier. When a bank is located on the efficient frontier (efficiency score of 1), it also means that it is impossible to expand output without increasing the inputs (Řepková, 2015). On the contrary, a bank with an efficiency score below 1 is considered inefficient and can afford to increase its output without necessarily increasing its inputs. In other words, the bank can achieve the current output using fewer inputs mix. The study estimated nine distinct annual cost frontiers instead of a single cost frontier for the entire dollarisation period. This is so because the bank that is most efficient one year may not be efficient the following year.
3.3 Panel Regression Models
In the second stage of the analysis, the effect of cost efficiency on non-performing loans formation was examined using the random effects regression models, which are more efficient in estimating the variance components of the data than fixed effects and pooled OLS regression models (Kanters, 2022). Guided by the Hausman test results, the paper first applied the random effects panel regression model without control variables to understand the effect of cost efficiency on NPLs. This simple bivariate analysis provides an in-depth understanding of the relationship between cost efficiency and non-performing loans. The following parsimonious random effect panel regression model was estimated (Khan, Siddique & Sarwar, 2020):
 (7)
(7)
where:
NPLSit = non-performing loans ratio for bank i in period t
CEit = cost efficiency score for bank i in period t
β0 = Constant
εit = Error term
Further to identifying the effect of cost efficiency on NPLs, the paper investigated whether there is a turning point where NPL starts to decrease as cost efficiency increases. To achieve this, the study applied the feasible generalized least squares (FGLS) regression model by adding squared cost efficiency to equation (7) so that it becomes a quadratic model of the form:
 (8)
(8)
To find the turning points where NPLs will start decreasing as cost efficiency increases, the paper differentiated  with subject to CEit to get:
 (9)
(9)
then solved CEit to identify the turning point.
To ensure the results are robust, we estimated equation (7) using a random effects model and a random effects model with Driscoll Kraay standard errors. Random effects model with Driscoll Kraay standard errors and FGLS were selected for their ability to better handle the problem of heteroskedasticity and autocorrelation in the error terms. Furthermore, the Random Effects model with Driscoll Kraay standard errors was chosen due to its capacity to provide robust standard errors.
Equation (7) primarily analyses the effect of cost efficiency at the mean. Thus, the present study further analysed the effect of cost efficiency on NPLs at different parts of the distribution (quantiles), allowing for potentially differing effects depending on the selected part within that entire distribution. The study estimated the Bootstrap quantile regression for the 10th, 25th, 50th, 75th and 90th quantiles to compare the effect of bank cost efficiency across the NPLs distribution. The motivation for using quantile regression lies in its ability to capture heterogeneity and its robustness. The model is more robust to handling extreme values and outliers (Korkmaz & Chesneau, 2021; Staffa et al., 2019). Assuming a linear relationship with respect to the explanatory variable (CE), the estimated model becomes (Marrocu et al., 2015):
 (10)
(10)
where:
β is the coefficient associated with CE variable for the qth quantile
q is the specific quantile considered, with 0 < q < 1.
To avoid overestimating the influence of cost efficiency on NPLs, the paper introduced some control variables and evolved the following random effects panel regression model:
 (11)
(11)
In the above equations, Cit denotes bank specific control variables, namely loans-to-deposit ratio (LTD) and return on assets (ROA), whilst GDP is the real GDP growth rate. The motivation for incorporating LTD, ROA and GDP is to account for bank liquidity, profitability and economic performance, respectively. Extending from previous studies, the study examined the interaction terms between cost efficiency and bank size and capitalisation with NPLs to understand the efficiency–NPLs nexus. By definition, interaction effect refers to the effect on one independent variable being contingent on the level of another independent variable (Mize, 2019). Interacting variables offers several benefits in regression analysis, inter alia, improving model fit and uncovering complex relationships (Long & Mustillo, 2021; Mize, 2019). Thus, in equation (11), θit denotes a vector of interaction terms:
CE*SIZE = the interaction between cost efficiency and bank size,
CE* ETA= the interaction between cost efficiency and capitalisation.
The interaction terms between bank size and cost efficiency capture these two variables’ combined impact on NPLs. These two variables reflect whether it is more beneficial for large-sized banks to be more cost-efficient in curbing NPLs than for smaller ones. Additionally, these interaction terms help reveal whether economies of scale exist within banking institutions – that is, larger banks experience reduced average costs per unit as they increase their scale of operation due to cost efficiency experience reduction in NPLs. In the same vein, the interaction terms between cost efficiency and capital were incorporated to examine if improved capitalisation of cost-efficient banks is more beneficial in curbing NPLs than in less capitalised ones and vice-versa.
The study utilised the VIF approach to detect multicollinearity problems, and the results are in Table 1.
Table 1
Multicollinearity Test
|
Variance Inflation Factor |
||
|
VIF |
1/VIF |
|
|
CE |
1.21 |
0.829 |
|
LTD |
1.07 |
0.936 |
|
ROA |
1.66 |
0.601 |
|
SIZE |
3.06 |
0.327 |
|
ETA |
1.85 |
0.539 |
|
GDP |
1.39 |
0.718 |
|
Mean VIF = 1.71 |
||
Based on Table 1 results, the VIF threshold for all variables, namely CE, LTD, ROA, SIZE, ETA and GDP, is less than 5 but close to 1, indicating the absence of multicollinearity problem among explanatory variables (Chang & Mastrangelo, 2011; Marcoulides & Raykov, 2019; Vörösmarty & Dobos, 2020).
Before panel regression analysis, it is crucial to examine whether the variables are stationary or non-stationary. Otherwise, failure to account for data stationarity may result in spurious regression results. Therefore, the study employed Harris-Tzavalis and Fisher-type unit root testing methods, and the panel stationarity test results are presented in Table 2.
Table 2 indicates that NPL, CE, ROA and ETA are stationary at level. While LTD is stationary at level using the Harris-Tzavalis approach, it becomes stationary after first differencing in the Fisher-type method. The GDP variable became stationary after first differencing in both methods; hence the variable is integrated of order 1. Finally, SIZE is stationary at level using the Fisher-type method but becomes stationary after first differencing in the Harris-Tzavalis approach. After correcting for stationarity, that is after first differencing, all variables were incorporated into the regression analysis using their respective orders of integration.
Table 2
Panel Unit Root Test
|
Harris-Tzavalis Criteria |
Fisher-type Criteria |
||||
|
Statistic |
Order of integration |
Statistic |
Order of |
||
|
Inverse χ2 |
Modified inv. χ2 |
||||
|
NPL |
0.139*** |
I(0) |
42.054** |
2.226** |
I(0) |
|
CE |
0.149*** |
I(0) |
165.283*** |
19.315 *** |
I(0) |
|
ETA |
0.156*** |
I(0) |
147.523*** |
16.852*** |
I(0) |
|
LTD |
0.416*** |
I(0) |
93.272*** |
9.329 *** |
I(I) |
|
GDP |
-0.427 *** |
I(I) |
174.294*** |
20.565*** |
I(I) |
|
ROA |
0.423*** |
I(0) |
101.781*** |
10.5089 *** |
I(0) |
|
SIZE |
0.295*** |
I(I) |
248.171*** |
30.81*** |
I(0) |
Note. Asterisks *, **, ** denote significance levels 10%, 5%, 1%, respectively.
4. Results and Discussion
4.1 Zimbabwean Banking Industry Cost Efficiency
Using input-oriented DEA model, the paper estimated yearly cost efficiency scores for all banks during the formal dollarisation period. Furthermore, efficiency scores were estimated for distinct groups of banks based on ownership, that is, foreign and local banks, and the descriptive statistics are presented in Table 3. Foreign banks refer to those with foreign ownership, while local banks are owned by local companies, individuals, or the government. The first finding suggests that the average Zimbabwean banking industry’s cost efficiency is 81.36% against the benchmark of 100%. The estimated efficiency score translates to an 18.64% level of inefficiency or wasted inputs.
Table 3
Cost Efficiency by Bank Ownership
|
Variable |
Observation |
Mean |
Standard |
Minimum |
Maximum |
|
All banks |
|||||
|
117 |
0.8136 |
0.1955 |
0.213 |
1 |
|
|
Local Banks |
|||||
|
54 |
0.7865 |
0.1933 |
0.396 |
1 |
|
|
Foreign Banks |
|||||
|
63 |
0.8368 |
0.1958 |
0.213 |
1 |
|
One possible implication of such an inefficiency level is that customers will pay for an additional input mix that banks employ because of inefficiency. High inefficiency may result in banks charging customers high service fees and interest rates. However, in relation to existing literature, Zimbabwean banks are efficient during the period under study compared to most banks in Asian countries. Sari et al. (2022) and Miah et al. (2019) reported average costs efficiency score of 71.23% and 79% in Indonesia and Bangladesh, respectively. Comparing the results to those concluded in previous studies conducted in Zimbabwe, the paper found that bank cost efficiency remained unchanged beyond 2014 as Abel (2018) reported that the average cost efficiency level during 2009–2014 was 81%. The present paper, therefore, suggests that banks may cut their input mix by 18.64% to raise efficiency and move toward operating on the efficient frontier. Descriptive statistics further revealed that foreign banks are more cost efficient (83.67%) than local banks (78.65%). This empirical finding suggests that local banks should devise strategies to enhance cost efficiency, thereby promoting industry-wide efficiency that benefits the entire banking sector and the economy.
4.2 Regression Results
The random effects (REM) panel regression model was first used to study the effect of bank cost efficiency on non-performing loans without control variables. Random effects panel regression with Driscoll-Kraay standard errors (REMD) was then used for robustness-checking purposes, and the results appear in Table 4. More so, the FGLS quadratic regression model results appear in Table 4. Regarding model selection, the Hausman test was used to select the most appropriate model between the fixed-effects, pooled panel regression, and random-effects models. The results show that the random effects model is superior to the fixed effects model since the Hausman test p-value is insignificant (Androniceanu & Georgescu, 2023; Rüttenauer & Ludwig, 2023). Following the Hausman test, the Breusch/Pagan LM test was performed to determine the best model between random effects and pooled OLS models. The test results suggest that the random effects model is superior to the pooled OLS model. Moreover, the Woodridge test indicates the absence of serial autocorrelation in the panel data (Saravanakumar et al., 2022).
Table 4
Random Effects Parsimonious Regressions
|
Dependent variable = NPL |
Model 1 |
Model 2 |
Model 3 |
|
REM |
REMD |
FGLS |
|
|
CE |
0.13** (0.055) |
0.13** (0.049) |
0.39*** (0.056) |
|
CE2 |
-0.21*** (0.037) |
||
|
Constant |
-0.011 (0.047) |
-0.011 (0.018) |
-0.080*** (0.021) |
|
N |
117 |
117 |
117 |
|
Prob > Chi2 |
0.0213 |
0.0102 |
0.0000 |
|
Woodridge test (Prob > F) |
0.8110 |
0.8110 |
0.8175 |
|
Hausman test (Prob>chi2) |
0.2021 |
||
|
Breusch/Pagan test (Prob > chibar2 |
0.0001 |
Note. *, **, *** denote significance levels at 10%, 5%, 1%, respectively. Standard errors are in parentheses.
Regression results in Table 4 correspond to equation (7) and suggest that increases in bank cost efficiency trigger growth in NPLs in both parsimonious models. The results showed that bank efficiency was positively related to NPLs. The variable is statistically significant at 5% in both models in Table 4. Furthermore, the findings show that a unit change in cost efficiency increases NPLs by 0.13%. These findings support the view that highly cost-efficient banks are more likely to experience growth in NPLs, which aligns with the skimping hypothesis, which predicts positive association between bank cost efficiency and non-performing loans. This shows that banks commit fewer resources when issuing loans due to cost minimisation behaviour, which gives rise to NPLs in the Zimbabwean banking industry. Model 3 shows the coefficients obtained from quadratic regression model presented as equation (8). After applying differentiation process presented in equation (8), the obtained turning point is 92.86%. The results imply that NPLs tend to fall when cost efficiency improves beyond 92.86%. More so, the results show that a decrease in inefficiency below 7.14% will lead to a reduction in NPLs. To investigate how NPLs were impacted by cost efficiency across different quantiles, the study further estimated Bootstrap quantile regression for the 10th to 90th quantiles (Marrocu et al., 2015). The results in Table 5 show no significant impact of bank cost efficiency on NPLs from the 10th to the 75th quantiles.
Table 5
Bootstrap Quantile Regression
|
Dependent variable = NPL |
q0.1 |
q0.25 |
q0.5 |
q0.75 |
q0.9 |
|
CE |
0.016 (0.012) |
0.033 (0.024) |
0.033 (0.042) |
-0.013 (0.090) |
0.33*** (0.111) |
|
Constant |
-0.0039 (0.010) |
-0.0034 (0.021) |
0.028 (0.038) |
0.10* (0.058) |
-0.028 (0.069) |
|
N |
117 |
117 |
117 |
117 |
117 |
Note. *, **, *** denote significance levels at 10%, 5%, 1%, respectively. Standard errors are in parentheses.
The findings further confirm the significant effect of CE on NPLs in the 90th quantile. According to the results, the coefficient for the 90th percentile (median) is 0.33, indicating that for every 1% increase in cost efficiency, NPLs increase by 0.33% at the median of the NPLs distribution. Furthermore, the results imply that at a higher quantile (90th), the impact of bank cost efficiency on NPLs is prominent and highly significant, thus the results indicate a stronger relationship between cost efficiency and NPLs at the upper end of the NPLs distribution. Therefore, the study concludes that cost efficiency impacts NPLs differently across quantiles.
Preceding parsimonious analysis, the paper examined the interaction effect of bank cost efficiency, bank size and capital on NPLs status, and findings appear in Table 6.
Table 6
Interaction Effect Regressions
|
Dependent variable = NPL |
Model 4 |
Model 5 |
|
REM |
REMD |
|
|
CE |
0.1297* (0.078) |
0.1297*** (0.031) |
|
LTD |
0.03911 (0.043) |
0.03911 (0.040) |
|
ROA |
-1.1882*** (0.363) |
-1.1882** (0.420) |
|
CE*SIZE |
-0.1511*** (0.052) |
-0.1511** (0.046) |
|
CE*ETA |
0.2930 (0.234) |
0.2930 (0.283) |
|
GDP |
0.04275 (0.168) |
0.04275 (0.130) |
|
Constant |
-0.0028 (0.062) |
-0.0028 (0.028) |
|
N |
104 |
104 |
|
Prob > Chi2 |
0.0000 |
0.0000 |
|
Woodridge test (Prob > F) |
0.7913 |
0.7913 |
|
Hausman test (Prob>chi2) |
0.6252 |
|
|
Breusch/Pagan test (Prob > chibar2 |
0.0037 |
Note. *, **, *** denote significance levels at 10%, 5%, 1%, respectively. Standard errors are in parentheses.
Similar to the findings in models 1 and 2, the coefficient of the bank cost efficiency variable is positive and statistically significant at the 10% and 1% level in models 4 and 5, respectively. The findings show that a unit change in cost efficiency increases NPLs by 0.13% in both models. This suggests that high-cost efficiency, usually achieved through cost-cutting measures, increases NPLs. The findings are consistent with those of Benthem (2017). As Berger and DeYoung (1997) point out, the positive relationship exists because banks allocate fewer funds for loan underwriting and monitoring to boost short-term profitability, which leads to an increase in NPLs. These findings support the skimping hypothesis, which states that high-cost efficiency results in rising NPLs.
In addition, the study observed that the interaction term between cost efficiency and bank size negatively associates with NPLs, and the variable is statistically significant at 1% and 5% in Models 3 and 4. The findings suggest that NPLs tend to fall when large-sized banks are more cost-efficient. This is so because banks tend to benefit from economies of scale when they grow in size, that is the asset base, being contingent to high efficiency resulting in reduction in NPLs. The finding is new evidence in the literature as most studies primarily focused on exploring the influence of bank size and cost efficiency on NPLs in isolation (Akhter, 2023; Almaskati, 2022; Alnabulsi et al., 2022). The research findings emphasise the importance of bank size in curbing NPLs. Put differently, the study suggests that an increase in assets base offers NPLs mitigation effect through cost efficiency. More so, the study emphasises that improvement in cost efficiency alone does not cause NPLs to fall. This implies banks need to enhance bank size to eliminate extreme cost minimisation behaviour. The finding that NPLs negatively associate with bank size aligns with Anastasiou et al. (2019). Furthermore, the study documents that the interaction between cost efficiency and bank capital is statistically insignificant in Models 3 and 4. The findings imply that bank cost efficiency does not influence NPLs even if bank capitalisation is altered.
The study concluded a negative affiliation between return on assets and non-performing loans, and the variable is significant at 1% and 5% in Models 3 and 4. According to the findings, a 1% increase in ROA can cause NPL to decrease by 1.188%. The interpretation of this finding is that banks are tempted to issue high-risk loans that cause NPLs to rise when the return on asset ratio decreases. More so, the study asserts that profitable banks are less likely to have a higher NPL rate. The negative relationship between ROA and NPLs conforms to the work of Khan et al. (2020) and Obeid (2022). Khan et al. (2020) suggested that profitability has a negative relationship with NPLs in Pakistan, which is also among developing countries in the world.
The regression results suggest that the loans to deposit ratio has an insignificant influence on NPLs formation in Zimbabwe. The findings conform to the work of Stefano and Dewi (2022). In a nutshell, the findings suggest that bank liquidity during formal dollarisation in Zimbabwe did not influence the NPLs trends. Furthermore, the results imply that policymakers’ efforts to alternate bank liquidity do not significantly influence growth or reduction in NPLs; thus, the variable is not vital when determining policies to curb NPLs.
The findings suggest that the external environment (GDP) does not influence NPLs in Zimbabwe. The results are identical to those reported by Msomi (2022) and Apan and İslamoğlu (2019) from studies conducted in western African countries and Turkey’s banking sectors, respectively.
5. Conclusions
The study’s objective was to examine the effect of bank cost efficiency on NPLs in Zimbabwe during the dollarisation era. This study contributes to the existing literature by examining the interaction effect of cost efficiency, bank size, and capitalization on non-performing loans (NPLs). While previous research has explored various factors contributing to NPL formation, this study’s novelty lies in investigating the combined role of cost efficiency and bank characteristics. Specifically, it sheds light on how cost efficiency impacts NPLs across different quantiles, providing new insights into the efficiency and non-performing loans nexus.
The cost efficiency scores were estimated through the application of DEA using yearly data generated from a panel of 13 commercial banks from 2009 to 2017. The random effects panel regression model was utilised to examine the influence of bank cost efficiency on NPLs. At the same time, Bootstrap quantile regression was estimated to determine the effect of cost efficiency on NPLs across the NPLs distribution. The DEA results show that the average cost efficiency score for the Zimbabwean banking industry is 81.36% against a benchmark of 100%. In addition, the study also observed that local banks are significantly more inefficient than foreign-owned banks.
The regression results indicate that high-cost efficiency increases NPLs in Zimbabwe, and the findings coincide with the skimping hypothesis proposed by Berger and DeYoung (1997). However, the paper suggests that NPLs tend to fall as cost efficiency increases beyond 92.86%. The results also show that a decrease in inefficiency below 7.14% will lead to a reduction in NPLs. These findings demonstrate that the impact of cost efficiency on NPLs is not uniform. It can have a positive effect up to 92.86% cost efficiency level and a negative effect beyond that point. This is a novel insight in the literature, suggesting that both bad management and skimping hypotheses can coexist in a banking industry.
Interestingly, the findings reveal that the effect of cost efficiency on NPLs is significant at a higher quantile, that is, the 90th quantile, implying a stronger relationship between cost efficiency and NPLs at the upper end of the NPLs distribution. Furthermore, the study documents evidence that the interaction term between cost efficiency and bank size negatively associates with NPLs. In contrast, the interaction between bank capital and cost efficiency with NPLs is insignificant.
The key recommendation of the study is that banks must periodically monitor cost–efficiency ratios to avoid cost-cutting measures compromising loan portfolio quality. The practical significance of this study lies in its potential to inform banking policy and operational strategies in Zimbabwe and other similar economies. The findings highlight the importance of cost efficiency in managing NPLs, particularly in larger banks. This suggests that banks could potentially reduce NPLs by improving their cost efficiency, thereby enhancing their financial stability and contributing to the overall health of the economy. Furthermore, the study’s policy implications suggest that banks should align their short-term profit motives with loan portfolio quality to prevent an increase in NPLs. This could lead to more sustainable banking practices and contribute to economic stability.
Limitations associated with this study are that it focused only on the formal dollarisation period in the Zimbabwean banking industry. More comprehensive results may be obtained by extending the study period to include periods beyond the official dollarisation era and on regional economies. Future studies may also attempt to understand the intersection between policy uncertainty, bank cost efficiency and NPLs in Zimbabwe.
References
Abel, S. (2018). Cost efficiency and non-performing lo ans: An application of the Granger causality test. Journal of Economic and Financial Sciences, 11(1), 1–8. https://doi.org/10.4102/jef.v11i1.170
Adegboye, A., Ojeka, S., & Adegboye, K. (2020). Corporate governance structure, Bank externalities and sensitivity of non-performing loans in Nigeria. Cogent Economics & Finance, 8(1), 1816611. https://doi.org/10.1080/23322039.2020.1816611
Ahmad, F., & Bashir, T. (2013). Explanatory power of bank specific variables as determinants of non-performing loans: Evidence form Pakistan banking sector. World Applied Sciences Journal, 22(9), 1220–1231. https://doi.org/10.5829/idosi.wasj.2013.22.09.1908
Akhter, N. (2023). Determinants of commercial bank’s non-performing loans in Bangladesh: An empirical evidence. Cogent Economics & Finance, 11(1). https://doi.org/10.1080/23322039.2023.2194128
Alihodžić, A. (2022). Internal and External Factors of Non-Performing Loans: The Example of the Banking Sector in Bosnia and Herzegovina. Balkans Journal of Emerging Trends in Social Sciences, 5(2), 93–104. https://doi.org/10.31410/Balkans.JETSS.2022.5.2.93-104
Almaskati, N. (2022). The determinants of bank profitability and risk: A random forest approach. Cogent Economics & Finance, 10(1). https://doi.org/10.1080/23322039.2021.2021479
Alnabulsi, K., Kozarević, E., & Hakimi, A. (2022). Assessing the determinants of non-performing loans under financial crisis and health crisis: Evidence from the MENA banks. Cogent Economics & Finance, 10(1). https://doi.org/10.1080/23322039.2022.2124665
Anastasiou, D., Bragoudakis, Z., & Malandrakis, I. (2019). Non-Performing Loans, Governance Indicators and Systemic Liquidity Risk: Evidence From Greece. SSRN Electronic Journal. https://doi.org/10.2139/ssrn.3402414
Androniceanu, A., & Georgescu, I. (2023). The Impact of CO2 Emissions and Energy Consumption on Economic Growth: A Panel Data Analysis. Energies, 16(3), 1342. https://doi.org/10.3390/en16031342
Apan, M., & Islamoğlu, M. (2019). Determining the relationship between non-performing loans, economic growth, and asset size: An application in Turkish Participation Banking Sector. Afro Eurasian Studies, 8(1), 106–123. https://doi.org/10.33722/afes.494510
Atoi, N. V. (2019). Non-performing Loan and its Effects on Banking Stability: Evidence from National and International Licensed Banks in Nigeria. Central Bank of Nigeria Journal of Applied Statistics, 43–74. https://doi.org/10.33429/cjas.09218.3/6
Baudino, P., & Yun, H. (2017). Resolution of Non- Performing Loans – Policy Options. Bank for International Settlements.
Bellotti, A., Brigo, D., Gambetti, P., & Vrins, F. (2021). Forecasting recovery rates on non-performing loans with machine learning. International Journal of Forecasting, 37(1), 428–444. https://doi.org/10.1016/j.ijforecast.2020.06.009
Berger, A. N., & DeYoung, R. (1997). Problem loans and cost efficiency in commercial banks. Journal of Banking and Finance, 21(6), 849–870. https://doi.org/10.1016/S0378-4266(97)00003-4
Büyükoğlu, B., Şit, A., & Ekşi, H. İ. (2021). Governance matters on non-performing loans: Evidence from emerging markets. PSL Quarterly Review, 74(296), 75–91.
Chang, Y.-C., & Mastrangelo, C. (2011). Addressing multicollinearity in semiconductor manufacturing. Quality and Reliability Engineering International, 27(6), 843–854. https://doi.org/10.1002/qre.1173
Chen, S., & Lee, D. (2023). Small and vulnerable: SME productivity in the great productivity slowdown. Journal of Financial Economics, 147(1), 49–74. https://doi.org/10.1016/j.jfineco.2022.09.007
Cvetkoska, V., Fotova Čiković, K., & Tasheva, M. (2021). Efficiency of Commercial Banking in Developing Countries. Mathematics, 9(14), 1597. https://doi.org/10.3390/math9141597
Efendic, V. (2017). Efficiency of Islamic and Conventional Banks : Empirical Evidence from Bosnia and Herzegovina. Journal of Islamic Economics Banking and Finance, 13(4), 66–90. https://doi.org/10.12816/0051002
Foglia, M. (2022). Non-Performing Loans and Macroeconomics Factors: The Italian Case. Risks, 10(1), 21. https://doi.org/10.3390/risks10010021
Fotova Čiković, K., & Lozić, J. (2022). Application of Data Envelopment Analysis (DEA) in Information and Communication Technologies. Tehnički Glasnik, 16(1), 129–134. https://doi.org/10.31803/tg-20210906103816
Ghosh, A. (2015). Banking-industry specific and regional economic determinants of non-performing loans: Evidence from US states. Journal of Financial Stability, 20, 93–104. https://doi.org/10.1016/j.jfs.2015.08.004
Hafsal, K., Suvvari, A., & Durai, S. R. S. (2020). Efficiency of Indian banks with non-performing assets: Evidence from two-stage network DEA. Future Business Journal, 6(1), 26. https://doi.org/10.1186/s43093-020-00030-z
Jason Stefano, & Sofia Prima Dewi. (2022). Determinants of Non-Performing Loans: Banking Sector Listed in Indonesia Stock Exchange. Jurnal Ekonomi, 27(03), 119–138. https://doi.org/10.24912/je.v27i03.869
Katuka, B., Mudzingiri, C., & Vengesai, E. (2023). The effects of non-performing loans on bank stability and economic performance in Zimbabwe. Asian Economic and Financial Review, 13(6), 393–405. https://doi.org/10.55493/5002.v13i6.4794
Kanters, S. (2022). Fixed- and Random-Effects Models. In E. Evangelou, A. A. Veroniki, (Eds.), Meta-Research. Methods in Molecular Biology, vol 2345 (pp. 41–65). Humana, New York, NY. https://doi.org/10.1007/978-1-0716-1566-9_3
Karim, M. Z. A., Chan, S. G., & Hassan, S. (2010). Bank efficiency and non-performing loans: Evidence from Malaysia and Singapore. Prague Economic Papers, 19(2), 118–132. https://doi.org/10.18267/j.pep.367
Khairi, A., Bahri, B., & Artha, B. (2021). A Literature Review of Non-Performing Loan. Journal of Business and Management Review, 2(5), 366–373. https://doi.org/10.47153/jbmr25.1402021
Khan, M. A., Siddique, A., & Sarwar, Z. (2020). Determinants of non-performing loans in the banking sector in developing state. Asian Journal of Accounting Research, 5(1), 135–145. https://doi.org/10.1108/AJAR-10-2019-0080
Kingu, S. P., Macha, D. S., & Gwahula, D. R. (2018). Impact of Non-Performing Loans on Bank’s Profitability: Empirical Evidence from Commercial Banks in Tanzania. International Journal of Scientific Research and Management, 6(01). https://doi.org/10.18535/ijsrm/v6i1.em11
Kjosevski, J., & Petkovski, M. (2017). Non-performing loans in Baltic States: determinants and macroeconomic effects. Baltic Journal of Economics, 17(1), 25–44. https://doi.org/10.1080/1406099X.2016.1246234
Klein, N. (2013). Non-Performing Loans in CESEE: Determinants and Impact on Macroeconomic Performance. (IMF Working Papers, Vol. 13, Issue 72). https://doi.org/10.5089/9781484318522.001
Kocisova, K. (2014). Application of Data Envelopment Analysis to Measure Cost, Revenue and Profit Efficiency. Statistika, 94(3), 47–94.
Koju, L., Koju, R., & Wang, S. (2018). Macroeconomic and Bank-Specific Determinants of Non-Performing Loans: Evidence from Nepalese Banking System. Journal of Central Banking Theory and Practice, 7(3), 111–138. https://doi.org/10.2478/jcbtp-2018-0026
Korkmaz, M. Ç., & Chesneau, C. (2021). On the unit Burr-XII distribution with the quantile regression modeling and applications. Computational and Applied Mathematics, 40(1), 29. https://doi.org/10.1007/s40314-021-01418-5
Liu, H., & Huang, W. (2022). Sustainable Financing and Financial Risk Management of Financial Institutions—Case Study on Chinese Banks. Sustainability, 14(15), 9786. https://doi.org/10.3390/su14159786
Long, J. S., & Mustillo, S. A. (2021). Using Predictions and Marginal Effects to Compare Groups in Regression Models for Binary Outcomes. Sociological Methods & Research, 50(3), 1284–1320. https://doi.org/10.1177/0049124118799374
Makri, V., Tsagkanos, A., & Bellas, A. (2014). Determinants of non-performing loans: The case of Eurozone. Panoeconomicus, 61(2), 193–206. https://doi.org/10.2298/PAN1402193M
Mamonov, M. (2013). Bad Management, Skimping, or Both? The Relationship between Cost Efficiency and Loan Quality in Russian Banks. SSRN Electronic Journal. https://doi.org/10.2139/ssrn.2344685
Marcoulides, K. M., & Raykov, T. (2019). Evaluation of Variance Inflation Factors in Regression Models Using Latent Variable Modeling Methods. Educational and Psychological Measurement, 79(5), 874–882. https://doi.org/10.1177/0013164418817803
Marjanović, I., Stanković, J. J., & Popović, Ž. (2018). Efficiency Estimation of Commercial Banks Based on Financial Performance: Input Oriented DEA CRS/VRS Models. Economic Themes, 56(2), 239–252. https://doi.org/10.2478/ethemes-2018-0014
Marrocu, E., Paci, R., & Zara, A. (2015). Micro-economic determinants of tourist expenditure: A quantile regression approach. Tourism Management, 50, 13–30. https://doi.org/10.1016/j.tourman.2015.01.006
Masunda, C. (2014). Determinants of Non-Performing Loans in a Multicurrency Environment: A Case of Zimbabwe. University of Cape Town.
Mataba, L., Aikaeli, J., & Kirama, S. (2016). The Link Between Cost Efficiency and Non-Performing Loans of Community Banks in Tanzania. Tanzania Economic Review, 7(1&2).
Miah, M. D., Uddin, H., & Ahmed, N. N. (2019). Determinants of efficiency and stability: Evidence from private commercial banks in Bangladesh. International Journal of Accounting and Finance, 9(2/3/4), 152. https://doi.org/10.1504/IJAF.2019.106755
Milenković, N., Radovanov, B., Kalaš, B., & Horvat, A. M. (2022). External Two Stage DEA Analysis of Bank Efficiency in West Balkan Countries. Sustainability, 14(2), 978. https://doi.org/10.3390/su14020978
Mize, T. (2019). Best Practices for Estimating, Interpreting, and Presenting Nonlinear Interaction Effects. Sociological Science, 6, 81–117. https://doi.org/10.15195/v6.a4
Obeid, R. (2022). The Impact of the Over-indebtedness of the Household Sector on the Non-performing Loans in the Banking Sector in the Arab Countries. European Journal of Business and Management Research, 7(1), 51–60. https://doi.org/10.24018/ejbmr.2022.7.1.1229
Partovi, E., & Matousek, R. (2019). Bank efficiency and non-performing loans: Evidence from Turkey. Research in International Business and Finance, 48, 287–309. https://doi.org/10.1016/j.ribaf.2018.12.011
Phung, Q. T., Van Vu, H., & Tran, H. P. (2022). Do non-performing loans impact bank efficiency? Finance Research Letters, 46, 102393. https://doi.org/10.1016/j.frl.2021.102393
Řepková, I. (2015). Banking Efficiency Determinants in the Czech Banking Sector. Procedia Economics and Finance, 23, 191–196. https://doi.org/10.1016/S2212-5671(15)00367-6
Reserve Bank of Zimbabwe. (2018). Monetary Policy Statement.
Roman, M., Suciu, C., & Paul, R. (2011). The Analysis of the Efficiency of the Innovation Development Research Activity by the DEA method. The 7th International Conference on Management of Technological Changes.
Rosenkranz, P., & Lee, J. (2019). Nonperforming Loans in Asia: Determinants and Macrofinancial Linkages. SSRN Electronic Journal. https://doi.org/10.2139/ssrn.3357289
Rossi, S., Schwaiger, M. S., & Winkler, G. (2011). Managerial Behavior and Cost/Profit Efficiency in the Banking Sectors of Central and Eastern European Countries. SSRN Electronic Journal. https://doi.org/10.2139/ssrn.676365
Rüttenauer, T., & Ludwig, V. (2023). Fixed Effects Individual Slopes: Accounting and Testing for Heterogeneous Effects in Panel Data or Other Multilevel Models. Sociological Methods & Research, 52(1), 43–84. https://doi.org/10.1177/0049124120926211
Sahiti, A., & Sahiti, A. (2021). The commercial banks’ credit risk efficiency: Empirical evidence from Kosovo. Journal of Eastern European and Central Asian Research (JEECAR), 8(2), 240–254. https://doi.org/10.15549/jeecar.v8i2.635
Saravanakumar, V., Lohano, H. Das, & Balasubramanian, R. (2022). A district-level analysis for measuring the effects of climate change on production of rice: Evidence from Southern India. Theoretical and Applied Climatology, 150(3–4), 941–953. https://doi.org/10.1007/s00704-022-04198-y
Sari, S., Ajija, S. R., Wasiaturrahma, W., & Ahmad, R. A. R. (2022). The Efficiency of Indonesian Commercial Banks: Does the Banking Industry Competition Matter? Sustainability, 14(17), 10995. https://doi.org/10.3390/su141710995
Staffa, S. J., Kohane, D. S., & Zurakowski, D. (2019). Quantile Regression and Its Applications. Anesthesia & Analgesia, 128(4), 820–830. https://doi.org/10.1213/ANE.0000000000004017
Sthembiso Msomi, T. (2022). Factors affecting non-performing loans in commercial banks of selected West African countries. Banks and Bank Systems, 17(1), 1–12. https://doi.org/10.21511/bbs.17(1).2022.01
Sultana, I., & Rahman, M. M. (2020). Determinants of bank cost efficiency: Empirical evidence from Bangladesh. International Journal of Banking and Finance, 15(1). https://doi.org/10.32890/ijbf2020.15.1.9931
van Benthem, C. S. (2017). The Relation Among Non-performing Loans, Operating Efficiency, and Capitalization in Commercial Banking. University of Twente.
Vo, L. Van, & Le, H. T. T. (2023). From Hero to Zero. The Case of Silicon Valley Bank. SSRN Electronic Journal. https://doi.org/10.2139/ssrn.4394553
Vörösmarty, G., & Dobos, I. (2020). Green purchasing frameworks considering firm size: A multicollinearity analysis using variance inflation factor. Supply Chain Forum: An International Journal, 21(4), 290–301. https://doi.org/10.1080/16258312.2020.1776090
Weber, O. (2016). The Sustainability Performance of Chinese Banks: Institutional Impact. SSRN Electronic Journal. https://doi.org/10.2139/ssrn.2752439
Yitayaw, M. K., Mogess, Y. K., Feyisa, H. L., Mamo, W. B., & Abdulahi, S. M. (2023). Determinants of bank stability in Ethiopia: A two-step system GMM estimation. Cogent Economics & Finance, 11(1). https://doi.org/10.1080/23322039.2022.2161771
Appendix
Table A1
Data Description
|
Variable |
Name |
Description |
Expected relationship |
Supporting Literature |
|
Variables used in Cost DEA estimation |
||||
|
Inputs |
||||
|
x1 |
Labour |
Total assets (proxy for the number of employees) |
Rossi, Schwaiger and Winkler, 2011; Abel, 2018 |
|
|
x2 |
Capital |
Total fixed assets |
Hafsal et al., 2020; Milenković et al., 2022 |
|
|
x3 |
Deposits |
Total deposits |
Efendic, 2017; Sultana & Rahman, 2020 |
|
|
Input prices |
||||
|
w |
Price of labour |
Staff expenses/total assets |
Abel, 2018; Marjanović et al., 2018; Rossi et al., 2011 |
|
|
k |
Price of capital |
(Total expenses - labour expenses)/total assets |
Abel, 2018 |
|
|
d |
Price of deposits |
Total interest expenses / total deposits |
Partovi & Matousek, 2019 |
|
|
Output |
||||
|
y1 |
Loans |
Gross loans (performing and non-performing) |
Roman et al., 2011 |
|
|
y1 |
Total income |
Sum of interest income and non-interest income |
Berger & DeYoung, 1997; Cvetkoska et al., 2021; Fotova Čiković & Lozić, 2022; Karim et al., 2010 |
|
|
Variables used in panel regression |
||||
|
NPL |
Non-performing loans |
Non-performing loans/Total loans |
Jason Stefano & Sofia Prima Dewi, 2022; Rosenkranz & Lee, 2019; Sthembiso Msomi, 2022 |
|
|
LTD |
Loans-to-deposit ratio |
Total loans/total deposit |
+ |
Alnabulsi et al., 2022; Anastasiou et al., 2016; Katuka et al., 2018; Ribichini, 2018 |
|
CE |
Cost efficiency scores |
Estimated using Cost DEA |
+/- |
Abel, 2018; Berger & DeYoung, 1997; Mataba et al., 2016 |
|
ETA |
Equity ratio |
Total equity/total assets |
+/- |
Kjosevski & Petkovski, 2017; Klein, 2013; Makri et al., 2014 |
|
ROA |
Return on assets |
Net income/total assets |
- |
Khan, Siddique & Sarwar, 2020; Alnabulsi et al., 2022; |
|
GDP |
Gross domestic product |
Changes in real GDP (World Bank dataset) |
- |
Alihodžić, 2022; Ghosh, 2015; Koju et al., 2018 |
|
SIZE |
Bank size |
Natural logarithm of total bank assets |
+/- |
Anastasiou et al., 2019; Sahiti & Sahiti, 2021 |