Organizations and Markets in Emerging Economies ISSN 2029-4581 eISSN 2345-0037
2025, vol. 16, no. 1(32), pp. 155–192 DOI: https://doi.org/10.15388/omee.2025.16.7
Calendar Anomalies in African Stock Markets: Does the Effect of Covid-19 Pandemic Matter?
Fouzia Alloul (corresponding author)
Ibn Tofail University, Kénitra, Morocco
Faculty of Economics and Management,
fouziaalloul.97@gmail.com
https://ror.org/02wj89n04
El Mehdi Ferrouhi
Ibn Tofail University, Kénitra, Morocco
Faculty of Economics and Management,
elmehdiferrouhi@gmail.com
https://ror.org/02wj89n04
Abstract. The Covid-19 pandemic profoundly disrupted global economies and financial systems, altering investor behavior and challenging traditional market dynamics. Among these disruptions, calendar anomalies, which challenge the efficient market hypothesis, offer a unique lens to assess market efficiency during crises. The objective of this study is to examine the impact of Covid-19 on calendar anomalies in the main African stock markets, an area largely overlooked in existing research despite the region’s increasing importance in global financial systems. Using daily closing prices from January 1, 2009 to December 31, 2021, and employing a GJR-GARCH (1,1) model, the findings indicate that calendar anomalies exhibit temporal variation within the sample markets, influenced by trends that shift markets between periods of efficiency and inefficiency. Additionally, the study highlights the emergence of new calendar anomalies coinciding with the onset of the Covid-19 pandemic. These results offer lasting insights for investors, suggesting the need for dynamic trading strategies that can adapt to calendar anomalies during global crises. For policymakers, the research underscores the importance of reducing information asymmetry to enhance market resilience in times of crisis. The study also emphasizes the need for further research to explore how systemic shocks, such as Covid-19, can disrupt traditional market patterns and affect stock market behavior.
Keywords: calendar anomalies, African stock markets, Covid-19, GJR-GARCH, efficient market hypothesis
Received: 21/8/2024. Accepted: 27/1/2025
Copyright © 2025 Fouzia Alloul, El Mehdi Ferrouhi. Published by Vilnius University Press. This is an Open Access article distributed under the terms of the Creative Commons Attribution Licence, which permits unrestricted use, distribution, and reproduction in any medium, provided the original author and source are credited.
1. Introduction
The Efficient Market Hypothesis (EMH), introduced by Fama (1965), is a foundational and widely debated concept in financial market research. It posits that stock prices fully reflect all available public information and adjust instantly to new information, making it extremely difficult to predict short-term price movements based on historical data. Despite the theoretical appeal of EMH, empirical evidence regarding its validity remains inconclusive. Several studies have found compelling evidence supporting the hypothesis, indicating some degree of efficiency in stock markets (Blake, 2000; Chen & Metghalchi, 2012). However, alternative research has documented significant anomalies and irregularities in stock returns that challenge the core assertions of EMH (Ball, 1978; Cubbin et al., 2006; Kaniel et al., 2012; Goudarzi, 2013). These anomalies, characterized by atypical behavior in stock returns, have been a major focus of finance literature. Furthermore, calendar anomalies have been persistently investigated, as they manifest inconsistencies with the Efficient Market Hypothesis (Thaler, 1987; Floros & Salvador, 2014; Wuthisatian, 2022; Rohuma & Brijlal, 2023; Hasan & Al-Najjar, 2024).
The existence of calendar anomalies has been confirmed by numerous empirical studies. These calendar effects are time-related and rely on specific days, weeks, or months of the year (Floros & Salvador, 2014; Chikhi et al., 2019). Indeed, calendar effects suggest that stock returns vary (becoming higher or lower) on certain days, weeks, and months of the year compared to other days, weeks, and months of the year, respectively. Examples include the day of the week effect (Alagidede, 2008; Obalade & Muzindusti, 2019; Hasan et al., 2022; Bassiouny et al., 2023), the weekend effect (Jaffe & Westerfield, 1985; Hasan et al., 2022; Slamet et al., 2024), and the holiday effect (Silva, 2010; Milos et al., 2024). There are also effects observed in specific weeks, such as the turn of the year effect (Sikes, 2014; Tuyekar et al., 2023), and in specific months, such as the January effect (Stoica & Diaconaşu, 2011; Aleknevičienė et al., 2022; Ghallabi et al., 2024; Milos et al., 2024), the Ramadan effect (Bialkowski et al., 2013; Ferrouhi et al., 2021; Hasan et al., 2022; Ghallabi et al., 2024), and the Halloween effect (Kinateder & Papavassiliou, 2021; Hasan & Al-Najjar, 2024).
The primary motivation for this study stems from the need to deepen our understanding of calendar anomalies in the context of unprecedented global disruptions, with a specific focus on African stock markets. Calendar anomalies, which challenge the efficient market hypothesis, were initially explained by factors such as trading time frames (French, 1980), payment processes (Gibbons & Hess, 1981), and measurement errors in stock prices (Keim & Stambaugh, 1984). However, more recent research highlights the role of broader economic events and macroeconomic factors in driving these anomalies (Steeley, 2001; Urquhart & McGroarty, 2014; Chatzitzisi et al., 2021). This evolving understanding is particularly pertinent in the wake of the Covid-19 pandemic, which fundamentally reshaped global stock market behavior. Studies such as those by Baker et al. (2020) and Izzeldin et al. (2021) reveal that the pandemic had a more profound impact on financial markets than previous crises, potentially altering established patterns like calendar anomalies.
At the same time, African stock markets, though increasingly significant in global finance, remain underrepresented in the literature on calendar anomalies. While globalization, market integration, and technological advancements have enhanced their appeal for investment and diversification, most research in this area has focused on developed and international markets (Chia et al., 2007; Qiao et al., 2011; Zhang et al., 2017; Chikhi et al., 2019; etc.). The limited body of work on African markets (Alagidede, 2008; Alagidede & Panagiotidis, 2009; Derbali & Hallara, 2016; Gbeda & Peprah, 2018; Kinateder et al., 2019; Ferrouhi et al., 2021) underscores a critical gap, particularly in examining how global shocks influence these emerging financial systems.
By integrating these two dimensions—the unprecedented global disruption caused by Covid-19 and the unique characteristics of African stock markets—this study seeks to address a significant gap in the literature. It explores the impact of Covid-19 on calendar anomalies in major African stock markets, aiming to answer a pressing question: How has Covid-19 influenced calendar anomalies in African stock markets?
This study makes three significant contributions to the literature. First, it advances the understanding of calendar anomalies in African stock markets by exploring a previously unexamined aspect: the impact of the Covid-19 pandemic. To the best of our knowledge, this is the first empirical investigation into how Covid-19 has influenced calendar anomalies, specifically the Day of the Week (DOW) and Month of the Year (MOY) effects, across major African stock markets, including the BRVM Composite, Nairobi All Share, SEMDEX, MASI, FTSE NSX Overall, NSE All Share, Rwanda All Share, FTSE South Africa, Tanzania All Share, TUNINDEX, Uganda All Share, and LES All Share. These two anomalies are selected for their consistent presence and well-documented relevance in the literature, as they are widely regarded as robust and persistent patterns influencing stock market behavior (Zhang et al., 2017; Kinateder et al., 2019; Ferrouhi et al., 2021; Shehadeh & Zheng, 2023). Second, the study enriches the existing body of work by comparing the manifestation of these anomalies across diverse African stock markets, shedding light on regional variations and offering valuable insights into the unique dynamics of each market. Finally, the findings carry practical implications for a broad audience. For investors, it provides actionable insights, emphasizing the need for dynamic portfolio strategies that capitalize on calendar anomalies, especially during global crises. For policymakers, the research underscores the importance of reducing information asymmetry and understanding the effects of external shocks on market efficiency, supporting the development of targeted regulatory measures to enhance market resilience during crises. For academics, this study provides a solid foundation for understanding how calendar anomalies can be influenced by systemic shocks, such as the Covid-19 pandemic, and how these events can disrupt traditional market models, particularly in under-researched markets.
The rest of this paper is divided into five sections. The following section contains the literature review and hypotheses development. The third section presents the description of the data and the methodology. The fourth section summarizes the findings, and the final section provides the conclusions.
2. Literature Review and Hypotheses Development
The financial literature has extensively examined calendar anomalies, uncovering patterns in stock returns that challenge the Efficient Market Hypothesis. Notable anomalies include the Day of the Week (DOW), Month of the Year (MOY), Turn of the Month (TOM), Day of the Month, Half of the Month, and Holiday effects. These patterns have been widely studied across global and regional markets, providing insights into potential inefficiencies and informing trading strategies.
The Day of the Week (DOW) effect reflects systematic differences in stock returns on specific trading days, where returns are typically higher or lower on certain days. Researchers like Chia et al. (2007), Qiao et al. (2011) and Farooq et al. (2013) identified such patterns, while Alagidede (2008), Derbali and Hullara (2016), and Gbeda and Perpah (2018) confirmed these effects in African markets. A related phenomenon, the weekend effect, reveals atypical return patterns between Friday closing prices and Monday opening prices (Farooq et al., 2013; Hasan et al., 2022). These findings suggest persistent inefficiencies, often attributed to factors like market sentiment and settlement delays, though explanations vary by context. Similarly, the Month of the Year (MOY) effect, particularly the well-known January effect, highlights varying average returns across months. This anomaly, often attributed to the tax-loss selling hypothesis (Brown et al., 1983), suggests year-end price declines followed by rebounds in January. However, evidence remains mixed. Studies like Alagidede (2013) and Obalade and Muzindutsi (2020) revealed variations in the months affected, indicating that cultural, regulatory, and economic factors might shape the manifestation of MOY anomalies across markets. In addition to the DOW and MOY effects, other calendar anomalies have been documented. The Turn of the Month (TOM) effect demonstrates higher returns during the transition between months (Kunkel et al., 2003; Chen et al., 2019; Hasan et al., 2022; Chawla et al., 2023; Gadhavi, 2024; Ghallabi et al., 2024), while the Half of the Month effect shows stronger returns in the first half of the month (Tonchev & Kim, 2004; Shehadeh & Zheng, 2023; Tuyekar et al., 2023). Additionally, the Holiday effect, characterized by significant pre-holiday increases in returns, has been attributed to optimistic investor behavior (Silva, 2010; Yang, 2016; Milos et al., 2024).
Earlier studies primarily focused on DOW and MOY effects in international markets, consistently reporting abnormal returns on specific days of the week (Stoica & Diaconaşu, 2011; Qiao et al., 2011; Farooq et al., 2013) and months of the year (Worthington, 2010; Chikhi et al., 2019). Later research expanded to African stock markets. For example, Alagidede and Panagiotidis (2009) confirmed DOW and MOY effects in Ghana and Tunisia, while Alagidede (2013) documented January anomalies in several African markets. However, findings have been inconsistent, with variations in the affected days and months, reflecting the influence of regional characteristics and differing levels of market development.
These inconsistencies highlight the importance of contextual factors. Studies on the DOW effect in African markets reveal discrepancies, with some identifying patterns across all weekdays (Alagidede & Panagiotidis, 2009), while others find specific days, such as Monday and Friday, to be more significant (Obalade & Muzindutsi, 2019; Ferrouhi et al., 2021). Similarly, MOY effects show varying results, with affected months ranging from April (Alagidede & Panagiotidis, 2009) to January and March (Alagidede, 2013; Obalade & Muzindutsi, 2020), and even cultural factors like Ramadan influencing returns (Ferrouhi et al., 2021). Non-African markets also exhibit similar inconsistencies, with variations across contexts (Worthington, 2010). These differences, summarized in Tables 1 and 2, suggest that calendar effects are shaped by market-specific factors. The inconsistencies underline the need for more nuanced analyses to differentiate genuine market inefficiencies from potential methodological artifacts and to consider the impact of cultural, economic, and regulatory differences.
On the other hand, it is important to consider how this study fits into the rapidly expanding literature on the effects of Covid-19 on stock markets as well as how it contributes to it. Since Covid-19 was declared a global pandemic, numerous studies have examined market efficiency. Ngwakwe (2020) analyzed the effect of the coronavirus pandemic on selected stock indices for China, Europe, and the United States, finding that Covid-19 affected the stock markets differently. The Chinese stock market (CSECI) experienced a significant increase in average stock prices during the pandemic compared to pre-pandemic levels, while the New York stock market showed a significant decrease in average stock prices for the DJIA and a non-significant variation for the S&P 500 during the pandemic period. Conversely, the European stock market (Euronext 100 indexes) exhibited a non-significant variation in average stock price. According to Ozkan (2021), during the first year of the pandemic, stock markets became more speculative, causing changes in market efficiency in some of the largest international stock markets and enabling investors to make abnormal gains. Scherf et al. (2022) examined the stock market reactions to Covid-19 lockdowns in OECD and BRICS countries and found that while the pandemic initially had a detrimental influence on the efficiency of global stock markets due to lockdowns, these inefficiencies eventually disappeared. More recently, Yang et al. (2023) investigated the effect of Covid-19 on stock market liquidity in Japanese companies listed on the TOPIX 500 and found that Covid-19 has a strong negative effect on the liquidity of the stock market.
Similarly, the pandemic has intensified research on the interplay between calendar anomalies and market conditions. Studies have shown that Covid-19 disrupted traditional patterns of market efficiency, leading to both the persistence and emergence of calendar effects. Celik (2021) observed the emergence of a Friday effect due to heightened volatility during the pandemic, while Liew et al. (2022) reported the continued presence of DOW effects in the Malaysian stock market, linked to optimism about lockdown policies. Similarly, Tauseef (2023) highlighted pronounced herd behavior during January, further supporting the persistence of calendar effects in uncertain times. The pandemic also prompted broader shifts in market efficiency. Bassiouny et al. (2023) employed the Adaptive Market Hypothesis (AMH) to show that international stock markets transitioned from efficient to inefficient states during the pandemic, amplifying calendar anomalies. In the cryptocurrency market, Sahu (2024) and Kumar (2024) highlighted new anomalies, such as the Turn of Month effect, which emerged during the pandemic, challenging traditional notions of efficiency, but these findings raise concerns about whether these shifts were temporary or indicative of long-term changes. Overall, while these studies contribute valuable insights, they require further analysis to determine the lasting effects of Covid-19 on market behavior.
This literature review serves as the basis for developing the following hypotheses to examine calendar anomalies in African stock markets in the context of the Covid-19 pandemic.
H1: There are calendar anomalies in African stock markets during the pre-Covid-19 pandemic period.
H1.1: The DOW anomaly is present in African stock markets during the pre-Covid-19 pandemic period.
H1.2: The MOY anomaly is present in African stock markets during the pre-Covid-19 pandemic period.
H2: The Covid-19 pandemic has affected the existence and magnitude of calendar anomalies in African stock markets.
H2.1: The DOW anomaly was altered or disappeared in African stock markets during the Covid-19 pandemic period.
H2.2: The MOY anomaly was altered or disappeared in African stock markets during the Covid-19 pandemic period.
H3: There is a significant difference in calendar anomalies across African stock markets.
H3.1: The DOW anomaly differs across African stock markets, depending on the specific characteristics of each market.
H3.2: The MOY anomaly differs across African stock markets, depending on the specific characteristics of each market.
Table 1
Summary of the Day of the Week (DOW) and Month of the Year (MOY) Effect in African Stock Markets
|
References |
Sample |
Results |
|
Alagidede (2008) |
DOW for seven African stock markets from June 30, 1995 to June 30, 2006 |
There is no proof for DOW effect in African stock markets. |
|
Alagidede and Panagiotidis (2009) |
DOW and MOY for Ghana Stock Exchange from June 1994 to April 2004 |
Persistence of DOW (Monday-Friday) and MOY (April) effect in the Ghana Stock Exchange. |
|
Alagidede (2013) |
MOY for Seven African stock markets from the period 1990 to 2006 |
African stock returns frequently exhibit the Month of the Year effect. |
|
Derbali and Hallara (2016) |
DOW for the Tunisian stock market during the period from December 31, 1997 to April 07, 2014 |
The study documents a positive effect for Thursday and a negative effect for Tuesday on the Tunisian stock market. |
|
Gbeda and Peprah (2018) |
DOW for Ghana and Nairobi Stock Exchanges from 2005 to 2014 |
While there was no indication of a DOW effect in Ghana Stock Exchange, the study found a Friday effect anomaly in the Nairobi Stock Exchange. |
|
du Toit et al. (2018) |
DOW for the Johannesburg Stock Exchange for the period March 1995 to March 2016 |
The DOW effect is present in both Johannesburg stock returns and volatility. |
|
Kinateder et al. (2019) |
MOY and DOW for the BRICS from the period 1996 to 2018 |
There are positive abnormal returns on Mondays and negative abnormal returns on Tuesdays and weak evidence for April, May and December in the BRICS. |
|
Obalade and Muzindutsi (2019) |
DOW for five African Stock Exchanges from January 1998 to February 2018 |
The DOW effect appears to be stronger in Johannesburg, Mauritius and Tunisian stock exchanges, but weak in Nigerian and Casablanca stock exchanges. |
|
Obalade and Muzindutsi (2019) |
DOW for selected African stock markets for the period 1998 to 2017 |
The study documents the Monday and Friday effects in all selected African stock markets. |
|
Adaramola and Adekanmbi (2020) |
DOW for Nigerian Stock Exchange from the period 2000 to 2017 |
The study documents the Monday, Tuesday and Friday in the Nigerian Stock Exchange. |
|
Obalade and Muzindutsi (2020) |
MOY for five African stock markets from January 1998 to February 2018 |
According to the findings, the MOY behave in a cyclical rather than a persistent manner in African stock markets. |
|
Ferrouhi et al. (2021) |
DOW and MOY for thirteen African stock markets from January 2009 to December 2019 |
Monday, Friday, January, December and Ramadan have a strong effect on African stock markets. |
Table 2
Summary of the Day of the Week (DOW) and Month of the Year (MOY) Effect in Non-African Stock Markets
|
References |
Sample |
Results |
|
Chia et al. (2007) |
DOW for Taiwan, Singapore, Hong Kong and South Korea stock markets covering the period from January 1, 2000 to December 31, 2006 |
Stock markets in Taiwan, Singapore, and Hong Kong exhibit negative Monday and positive Friday influences. |
|
Worthington (2010) |
DOW and MOY for Australian stock markets from January 6, 1958 to December 30, 2005 |
The Australian stock market is very impacted by DOW (Tuesday) and MOY (December). |
|
Qiao et al. (2011) |
DOW for Chinese stock markets for the period January 3, 1994 to December 31, 2008 |
In the A-share and B-share stock exchanges of China, there are just Wednesday effects. |
|
Stoica and Diaconaşu (2011) |
DOW and MOY for CEE stock markets between 2000 and 2010 |
There is strong evidence for DOW (Thursday, Wednesday and Friday) and MOY (January) for CEE stock markets. |
|
Berument and Dogan (2012) |
DOW for US Stock Exchange from May 26, 1952 to September 29, 2006 |
The hypothesis that the return-volatility link is present and constant for each day of the week is not supported by actual data. |
|
Farooq et al. (2013) |
DOW for Saudi Stock Exchange during the period between January 7, 2007 and April 1, 2013 |
The volatility exhibits the DOW impact. On Saturdays and Sundays, there is the least volatility. |
|
Jamroz and Koronkiewicz (2014) |
DOW for Polish and 5 major world stock markets from the period of January 2003 to September 2013 |
The influence of the DOW on large established equity markets appears to be nonexistent. |
|
Zhang et al. (2017) |
DOW for 28 markets from 25 countries (emerging and developed) over the world from 1996 to 2016 |
Monday, Tuesday and Wednesday are prominent in the most selected stock markets. |
|
Chikhi et al. (2019) |
DOW and MOY for Paris stock market during the period from 1999 to 2015 |
The DOW and the MOY effects detected on volatility seem to improve the volatility forecasts. |
|
Munir and Sook Ching (2019) |
DOW and MOY for Malaysian stock market for the period January 1, 1997 to December 31, 2014 |
Strong evidence for DOW and MOY effect was found in the Malaysian stock market. |
|
Yardımcı and Erdem (2020) |
DOW for 19 stock markets with a predominantly Muslim population over the world from January 1, 2005 to January 1, 2015 |
In most of the stock markets examined, there was proof of the day of the week effect. |
|
Chatzitzisi et al. (2021) |
DOW for ten sectoral S&P500 from September 11, 1989 to January 6, 2017 |
Strong evidence of DOW effect was found in all sectors studied. |
|
Aleknevičienė et al. (2022) |
DOW and MOY for the Baltic stock markets from 2000 to 2017 |
Persistence of DOW effect (Friday) and MOY effect (January and July) was identified in the Baltic stock markets. |
|
Aslam et al. (2022) |
DOW and MOY for Islamic frontiers markets for the period of January 2006 to September 2019 |
The effect of calendar anomalies on Islamic frontiers markets is mixed between negative and positive. |
|
Elangovan et al. (2022) |
MOY for the Indian stock market from April 1, 2011 to March 31, 2021 |
The findings indicate that there is a significant March effect in the Indian stock market. |
|
Hsu et al. (2022) |
DOW effect for the Taiwan stock market from June 1, 2015 to December 31, 2019. |
The bull 2X LETFs that track the main stock indices of the Taiwan market saw noticeably higher returns on Wednesday. |
|
Khan et al. (2023) |
DOW for Emerging stock markets from Asia for the period July 2013 to March 2019 |
There is a considerable DOW influence on returns in China, South Korea, Taiwan, Thailand, Indonesia, and Pakistan. |
|
Shehadeh and Zheng (2023) |
DOW and MOY for Seven middle east countries span from 2000 to 2020 |
Strong evidence of DOW and MOY effect was found in the seven middle east countries. |
|
Singha and Kakaty (2023) |
MOY effect for the Indian stock market from April 2010 to March 2020 |
No evidence of MOY effect was found in the Indian stock markets indicating that during the study period, the market was informationally efficient. |
|
Ghallabi et al. (2024) |
DOW and MOY for both conventional and Islamic indices in Indonesia from October 6, 2000 to March 4, 2022 |
Only the conventional index experiences the January effect, whereas only the Islamic index experiences the Monday effect. The month of Ramadan has a favorable impact on the Islamic index and a negative impact on the conventional index. |
|
Milos et al. (2024) |
DOW and MOY for CEE stock markets from 2008 to 2019 |
Strong evidence of DOW effect and MOY effect (January) was found in CEE stock markets. |
|
Valadkhani and O‘Mahony (2024) |
MOY effect for nine sectors specific in the US equity market January 1999–December 2023 |
The findings indicate that in April, November, and/or December, eight of the nine sectoral ETFs regularly provide positive returns. |
3. Data and Methodology
This section presents a brief description of all the data employed in this study, in addition to the methodology, which describes the design and components of the empirical models used.
3.1 Data
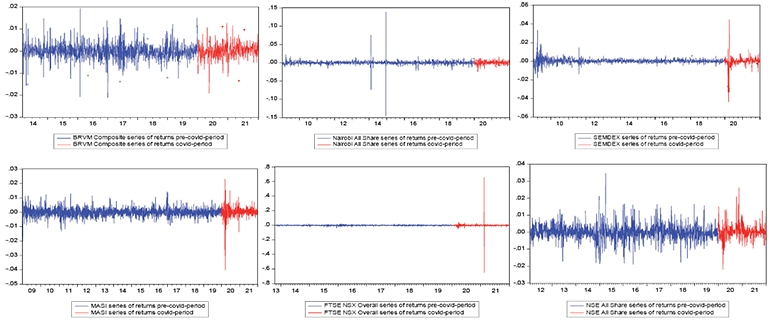
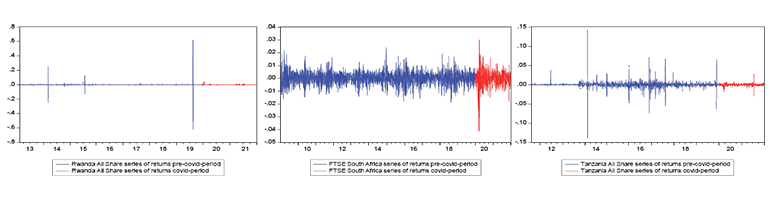
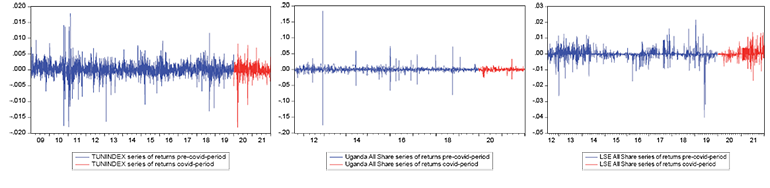
The dataset includes the daily closing prices of twelve stock market indices starting from a base date that corresponds to data accessible on the Investing.com database after the economic crisis and ending on December 31, 2021. These twelve indices correspond to the main African stock markets: BRVM, NGSEINDEX, SEM, CSE, NSX, RSE, JSE, Dar Es Salaam Stock Exchange, BVMT, USE, and LUSE. The selection of these indices is based on their status as the primary stock market indices of African markets, providing a comprehensive representation of the diverse economic landscapes across the continent. Table 3 presents the sample description.
Table 3
Sample Description
|
Country |
Name of stock exchange |
Index |
|
Cote d’Ivoire |
Bourse Régionale des Valeurs Mobilières „BRVM“ |
BRVM Composite |
|
Kenya |
Nairobi Securities Exchange „NGSEINDEX“ |
Nairobi All Share |
|
Mauritius |
Stock Exchange of Mauritius „SEM“ |
SEMDEX |
|
Morocco |
Casablanca Stock Exchange „CSE“ |
MASI |
|
Namibia |
Namibian Stock Exchange „NSX“ |
FTSE NSX Overall |
|
Nigeria |
Nigerian Stock Exchange „NGSEINDEX“ |
NSE All Share |
|
Rwanda |
Rwanda Stock Exchange „RSE“ |
Rwanda All Share |
|
South Africa |
Johannesburg Stock Exchange „JSE“ |
FTSE South Africa |
|
Tanzania |
Dar Es Salaam Stock Exchange |
Tanzania All Share |
|
Tunisia |
Bourse De Tunis „BVMT“ |
Tunindex |
|
Uganda |
Uganda Securities Exchange „USE“ |
Uganda All Share |
|
Zambia |
Lusaka Stock Exchange „LUSE“ |
LES All Share |
After obtaining the stock prices, it is crucial to calculate the returns to isolate the relative price variations and identify calendar anomalies, which influence market performance (Keim & Stambaugh, 1986). As is commonly done in return anomaly literature, we generate daily returns for each stock market index as the first difference in the logarithm of the closing index prices. More specifically, daily returns are calculated using the formula:
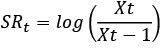
where SRt is the returns at the time t, Xt represents the prices at the time t and Xt-1 represents the prices at the time t–1. Statistically, due to the large sample size, employing daily frequency data in statistical analysis is often more valid. Additionally, a rising number of financial studies are starting to favor high-frequency data over low-frequency data.
3.1.1 Variables definition
This study identifies the Day of the Week and the Month of the Year as independent variables, while stock returns serve as the dependent variable, in line with established literature and financial and economic theories. Table 4 outlines the variables included in the analysis, accompanied by their descriptions, measurements, symbols, and sources.
Table 4
Variables Employed in the Study
|
Sr. no |
Variable |
Description |
Measurement |
Symbol |
Source |
|
Dependent variable |
|||||
|
01 |
Stock returns |
Daily stock returns |
Logarithmic variation between two consecutive prices |
SR |
Authors' calculation based on stock market prices obtained from Investing.com |
|
Independent variables |
|||||
|
02 |
Day of the Week |
Monday to Friday |
Dummy variables represent each day of the week, taking the value 1 for a specific day and 0 otherwise |
DOW |
Authors' assignment based on the series of stock market returns |
|
03 |
Month of the Year |
January to December |
Dummy variables represent each month of the year, taking the value 1 for a specific month and 0 otherwise |
MOY |
|
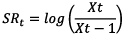
Table 5 presents the basic statistics for index returns during both the pre-Covid-19 and Covid-19 periods. The choice of tests applied to the data is motivated by the need to assess its distributional properties and ensure the validity of subsequent analyses. The Jarque-Bera test is employed to examine the normality of the distribution, as it is widely used in financial studies to detect deviations from normality, which can impact model assumptions (e.g., Bera & Jarque, 1981). The ARCH test (Engle, 1982) is chosen to evaluate the presence of heteroskedasticity, which is critical in financial time series analysis, as volatility clustering is a well-documented phenomenon in stock returns. The ADF test (Dickey & Fuller, 1979) is used to test for stationarity, as non-stationary data can lead to spurious regression results, a common issue in time series modeling. The results show that the Jarque-Bera test rejects normality, the ADF test confirms stationarity at level for all-time series, and the ARCH test detects significant heteroskedasticity in all stock market returns, indicating volatility clustering. These results are summarized in Table 6.
3.2 Model
The non-normality of the distribution of a variable/series results from its leptokurtic nature, higher-order autocorrelation, and volatility clusters, which are all properties of time series. These properties make traditional models of time series inadequate. All of these characteristics were present in our dataset. According to the Jarque-Bera test, the stock returns series is not normally distributed, and the data exhibited volatility clustering. Because of this, and in accordance with earlier studies (such as Urquhart & McGroarty, 2014; Adaramola et al., 2020; Aleknevičienė et al., 2022; Ghallabi et al., 2024), we employed GARCH models to account for heteroskedasticity during estimation and to capture the volatility clustering (Bollerslev, 1986). Specifically, we used the GJR-GARCH (1,1) model to examine calendar effects in African stock markets. This choice is justified by its ability to take into account volatility asymmetries (i.e., the stronger market response to negative news than to positive news), a property well documented in the financial literature (Glosten et al., 1993). The model in our article was set as follows:
3.2.1 For Day of the Week effect
SRi,t = α1D1t + α2D2t + α3D3t + α4D4t + α5D5t + εi,t (1)
3.2.2 For Month of the Year effect
SRi,t = α1M1t + α2M2t + α3M3t + α4M4t + α5M5t + α6M6t + α12M12t + εi,t (2)
σt2 = ω + αε(t – 1)2 + γε(t – 1)2I [ε(t – 1)<0] + βσ(t – 1)2 (3)
In equations (1) and (2), SRi,t is the daily stock returns on each market index (i) for day or month (t), D1t to D5t and M1t to M12t corresponding to daily dummy variables for each day of the week: Monday to Friday and each month of the year: January to December respectively, α1t to α5t and α1t to α12t are the needed coefficient for testing calendar anomaly for a particular trade day and trade month respectively, and εit is the error term. In Equation (3), σt2 represents the conditional volatility at time (t), ω is a constant term, α indicates the impact of positive past shocks ε(t – 1)2 on future volatility, γ captures the asymmetric effect of negative shocks ε(t – 1) < 0 in response to bad news, I[ε(t – 1) < 0 is an indicator function that equals 1 if the previous shock is negative and 0 otherwise, and β represents the persistence of volatility, showing how past volatility levels σ(t – 1)2 influence current volatility.
Table 5
Descriptive Statistics I
|
Descriptive statistics |
||||||||||
|
Index |
Base date |
Pre-Covid-19 period |
Base date |
Covid-19 period |
||||||
|
N |
Mean |
Std. Dev. |
Jarque-Bera |
N |
Mean |
Std. Dev. |
Jarque-Bera |
|||
|
BRVM Composite |
3/05/2014 |
1446 |
-0.000128 |
0.003469 |
1390.432*** |
1/03/2020 |
502 |
0.000217 |
0.003178 |
467.4527*** |
|
Nairobi All Share |
1/03/2009 |
2728 |
0.000129 |
0.005514 |
14248014*** |
1/03/2020 |
501 |
2.50E-06 |
0.004654 |
462.0628*** |
|
SEMDEX |
1/06/2009 |
2739 |
9.68E-05 |
0.002125 |
140717.5*** |
1/06/2020 |
502 |
-3.33E-05 |
0.004889 |
28739.25*** |
|
MASI |
1/03/2009 |
2738 |
2.23E-05 |
0.002701 |
1772.057*** |
1/03/2020 |
498 |
8.55E-05 |
0.004188 |
16223.81*** |
|
FTSE NSX Overall |
10/14/2013 |
1550 |
7.84E-05 |
0.005531 |
406.0703*** |
1/03/2020 |
500 |
0.000153 |
0.042061 |
1058171*** |
|
NSE All Share |
1/31/2012 |
1959 |
5.73E-05 |
0.004326 |
2193.072*** |
1/03/2020 |
496 |
0.000406 |
0.004134 |
1232.537*** |
|
Rwanda All Share |
2/13/2013 |
1687 |
2.77E-05 |
0.023436 |
24150681*** |
1/06/2020 |
493 |
6.12E-05 |
0.002200 |
3941956*** |
|
FTSE South Africa |
1/05/2009 |
2864 |
0.000141 |
0.004600 |
316.3068*** |
1/03/2020 |
520 |
7.85E-05 |
0.006804 |
2043.617*** |
|
Tanzania All Share |
8/16/2011 |
2053 |
0.000102 |
0.007766 |
1332536*** |
1/03/2020 |
494 |
-7.33E-05 |
0.003159 |
17278.39*** |
|
Tunindex |
1/05/2009 |
2732 |
0.000141 |
0.002264 |
16904.67*** |
1/03/2020 |
497 |
7.79E-07 |
0.002292 |
5718.068*** |
|
Uganda All Share |
8/15/2011 |
1985 |
0.000125 |
0.008794 |
2906744*** |
1/03/2020 |
497 |
-0.000216 |
0.004880 |
2617.611*** |
|
LES All Share |
7/10/2012 |
1811 |
2.13E-05 |
0.002978 |
98349.27*** |
1/03/2020 |
493 |
0.000315 |
0.003054 |
788.8301*** |
Note. *p < 5%; ** p < 1%; ***p < 0.1%.
Table 6
Descriptive Statistics II
|
Index |
ARCH |
ADF |
||||||
|
Lag[3] |
Lag[5] |
Lag[7] |
||||||
|
Pre-Covid |
Mid-Covid |
Pre-Covid |
Mid-Covid |
Pre-Covid |
Mid-Covid |
Pre-Covid |
Mid-Covid |
|
|
BRVM Composite |
50.94768*** |
3.318952** |
32.91590*** |
2.141182** |
24.16735*** |
1.629002 |
-42.50357*** |
-13.10327*** |
|
Nairobi All Share |
297.9184*** |
20.81131*** |
181.7297*** |
13.52991*** |
129.7636*** |
9.948494*** |
-62.91570*** |
-16.84678*** |
|
SEMDEX |
247.5956*** |
25.71366*** |
150.1209*** |
18.93113*** |
116.5686*** |
15.59279*** |
-40.34052*** |
-10.67546*** |
|
MASI |
67.57087*** |
83.01022*** |
43.50331*** |
55.13244*** |
31.23487*** |
49.35490*** |
-44.44159*** |
-18.64574*** |
|
FTSE NSX Overall |
29.81931*** |
18.32615*** |
20.28443*** |
10.94947*** |
16.73728*** |
7.762002*** |
-38.96916*** |
-17.27188*** |
|
NSE All Share |
48.06989*** |
14.38038*** |
31.55559*** |
8.616037*** |
22.48864*** |
7.872465*** |
-32.07910*** |
-11.33770*** |
|
Rwanda All Share |
68.33649*** |
0.002079 |
41.26507*** |
0.002190 |
29.42476*** |
0.002300 |
-20.29287*** |
-22.46786*** |
|
FTSE South Africa |
38.74623*** |
125.4417*** |
32.87072*** |
77.17934*** |
27.47194*** |
62.95489*** |
-53.97302*** |
-23.01514*** |
|
Tanzania All Share |
98.65314*** |
41.20883*** |
59.28856*** |
27.75557*** |
42.28606*** |
20.05877*** |
-36.01194*** |
-25.52603*** |
|
Tunindex |
225.6721*** |
97.61424 |
137.7003*** |
60.41934*** |
98.69932*** |
43.39026*** |
-39.99726*** |
-14.62673*** |
|
Uganda All Share |
97.25691*** |
60.57393*** |
58.27491*** |
37.59941*** |
41.54269*** |
26.73285*** |
-40.75146*** |
-19.57207*** |
|
LES All Share |
9.707453*** |
3.848257** |
6.085435*** |
2.886019** |
4.366729*** |
3.609272*** |
-42.32685*** |
-23.28885*** |
Note. *p < 5%; ** p < 1%; ***p < 0.1%.
Table 7
DOW Effect – Pre-Covid-19 Period
|
Cote d’Ivoire |
Kenya |
Mauritius |
Morocco |
Namibia |
Nigeria |
|
|
Monday |
-0.000858 (0.0000) |
-0.000447 (0.0000) |
-8.58E-05 (0.0845) |
-8.82E-05 (0.4031) |
0.000495 (0.1031) |
-0.000233 (0.1847) |
|
Tuesday |
-4.49E-05 (0.8158) |
-2.04E-06 (0.9864) |
-4.54E-05 (0.4010) |
-3.46E-05 (0.7436) |
0.000100 (0.7187) |
-0.000455 (0.0047) |
|
Wednesday |
0.000528 (0.0027) |
0.001236 (0.0000) |
6.55E-05 (0.1911) |
1.99E-05 (0.8473) |
-0.000261 (0.3333) |
-5.06E-05 (0.7407) |
|
Thursday |
-0.000635 (0.0007) |
3.25E-05 (0.8013) |
6.07E-05 (0.2583) |
-6.46E-05 (0.4977) |
-0.000176 (0.4944) |
-0.000112 (0.5041) |
|
Friday |
0.000186 (0.2972) |
0.000675 (0.0000) |
0.000106 (0.0505) |
3.87E-05 (0.6444) |
9.57E-05 (0.7297) |
0.000593 (0.0018) |
|
ω |
2.47E-06*** |
2.09E-06*** |
1.47E-07*** |
1.75E-06*** |
4.12E-07*** |
2.75E-06*** |
|
α |
0.179209*** |
0.422317*** |
0.213212*** |
0.227857*** |
0.019318*** |
0.286716*** |
|
β |
0.618850*** |
0.454803*** |
0.753564*** |
0.524263*** |
0.936793*** |
0.593734*** |
|
γ |
-0.032208 |
1.201105*** |
-0.007448 |
0.002963 |
0.060805*** |
-0.058650* |
|
Rwanda |
South Africa |
Tanzania |
Tunisia |
Uganda |
Zambia |
|
|
Monday |
0.001022 (0.8480) |
0.000195 (7.59E-05) |
0.000122 (0.0302) |
0.000108 (0.0892) |
-0.000399 (0.1240) |
0.000116 (0.3567) |
|
Tuesday |
0.003163 (0.7808) |
7.59E-05 (0.6315) |
3.86E-05 (0.6206) |
-7.41E-05 (0.2451) |
0.003013 (0.0000) |
-0.000170 (0.1045) |
|
Wednesday |
0.001146 (0.8661) |
-0.000124 (0.4295) |
0.000233 (0.0000) |
2.47E-05 (0.7175) |
-0.001194 (0.0006) |
2.92E-05 (0.8300) |
|
Thursday |
-6.09E-05 (0.9973) |
0.000118 (0.4549) |
-2.19E-05 (0.6689) |
0.000190 (0.0100) |
0.001003 (0.0000) |
6.27E-05 (0.5813) |
|
Friday |
-0.000280 (0.9902) |
-2.39E-05 (0.8914) |
4.26E-05 (0.5430) |
0.000279 (0.0001) |
1.66E-05 (0.9278) |
-0.000205 (0.0764) |
|
ω |
0.000338*** |
3.38E-07*** |
2.15E-08*** |
9.82E-07*** |
2.55E-05*** |
2.79E-07*** |
|
α |
0.105622*** |
-0.007620 |
0.335427*** |
0.290379*** |
0.213845*** |
0.114759*** |
|
β |
0.579989*** |
0.933417*** |
0.779908*** |
0.463385*** |
0.000312 |
0.879828*** |
|
γ |
-0.168225*** |
0.113265*** |
0.630235*** |
0.101901*** |
3.221745*** |
-0.035096*** |
Note. P-values for the DOW effect are reported in parentheses. Statistical significance of GARCH parameters is denoted by *p < 5%; ** p < 1%; ***p < 0.1%. Standard errors of the coefficients are presented in the Appendix (Table A1).
Table 8
DOW Effect – Covid-19 Period
|
Cote d’Ivoire |
Kenya |
Mauritius |
Morocco |
Namibia |
Nigeria |
|
|
Monday |
-0.000530 (0.0457) |
-0.000514 (0.1356) |
-5.94E-05 (0.7515) |
-0.000276 (0.1610) |
0.008856 (0.6168) |
-0.000494 (0.0290) |
|
Tuesday |
0.000308 (0.3656) |
-0.000776 (0.0489) |
0.000152 (0.5324) |
0.000295 (0.2948) |
0.004891 (0.8715) |
7.31E-06 (0.9795) |
|
Wednesday |
0.000373 (0.2100) |
0.000458 (0.2543) |
0.000452 (0.0170) |
0.000462 (0.0742) |
0.000619 (0.9839) |
5.54E-05 (0.8493) |
|
Thursday |
0.000329 (0.2622) |
0.000840 (0.0236) |
7.21E-05 (0.7226) |
0.000706 (0.0060) |
-0.000497 (0.9854) |
0.000405 (0.2251) |
|
Friday |
0.000692 (0.0286) |
0.000721 (0.0648) |
0.000160 (0.5258) |
0.000469 (0.0413) |
0.000547 (0.9856) |
-4.77E-05 (0.8436) |
|
ω |
2.82E-06*** |
1.93E-06*** |
4.17E-07*** |
5.81E-07*** |
0.001101 |
5.97E-06*** |
|
α |
0.244487*** |
0.181722*** |
0.192976*** |
0.145729*** |
0.123756*** |
1.041122*** |
|
β |
0.553820*** |
0.729188*** |
0.737188*** |
0.773464*** |
0.585673 |
0.105107** |
|
γ |
-0.166506** |
0.006980 |
0.167715*** |
0.052657 |
-0.201969*** |
-0.704967*** |
|
Rwanda |
South Africa |
Tanzania |
Tunisia |
Uganda |
Zambia |
|
|
Monday |
-0.000131 (0.0142) |
-0.000900 (0.0375) |
-0.000115 (0.6644) |
4.92E-05 (0.7043) |
-0.000130 (0.7748) |
-1.49E-05 (0.9516) |
|
Tuesday |
-8.50E-06 (0.9108) |
0.000431 (0.3641) |
-0.000349 (0.2565) |
-0.000435 (0.0005) |
-0.000263 (0.6001) |
-0.000196 (0.3832) |
|
Wednesday |
-3.94E-05 (0.5549) |
0.000765 (0.1032) |
-5.58E-05 (0.8496) |
3.80E-06 (0.9768) |
-0.000240 (0.6294) |
-5.19E-05 (0.7865) |
|
Thursday |
2.96E-05 (0.5256) |
-0.000522 (0.2288) |
-0.000324 (0.3432) |
0.000335 (0.0150) |
0.000565 (0.1727) |
-0.000162 (0.3703) |
|
Friday |
1.66E-05 (0.8130) |
-0.000181 (0.7053) |
0.000449 (0.1052) |
0.000489 (0.0004) |
-0.000118 (0.7849) |
-6.43E-05 (0.7234) |
|
ω |
2.48E-08*** |
1.96E-06*** |
3.78E-07*** |
5.77E-07*** |
5.45E-06*** |
2.64E-08*** |
|
α |
0.035521*** |
-0.021999 |
0.120980*** |
0.631332*** |
0.167099*** |
0.035587*** |
|
β |
0.874984*** |
0.833754*** |
0.871713*** |
0.381044*** |
0.544427*** |
0.980915*** |
|
γ |
-0.044106*** |
0.244533*** |
-0.037075 |
-0.148287 |
0.064344 |
-0.028428*** |
Note. P-values for the DOW effect are reported in parentheses. Statistical significance of GARCH parameters is denoted by *p < 5%; ** p < 1%; ***p < 0.1%. Standard errors of the coefficients are presented in the appendix (Table A1).
Table 9
MOY Effect – Pre-Covid-19 Period
|
Cote d’Ivoire |
Kenya |
Mauritius |
Morocco |
Namibia |
Nigeria |
|
|
January |
-0.001243 (0.0000) |
1.96E-06 (0.9909) |
8.64E-05 (0.3152) |
0.000151 (0.2835) |
-5.58E-05 (0.9124) |
0.000299 (0.4036) |
|
February |
0.000915 (0.0058) |
0.002337 (0.0000) |
5.28E-05 (0.5736) |
0.000313 (0.0447) |
0.000510 (0.2339) |
-2.54E-05 (0.9245) |
|
March |
0.000199 (0.4751) |
0.000558 (0.0000) |
-9.35E-05 (0.3227) |
-0.000261 (0.0902) |
-0.000131 (0.7201) |
-0.000312 (0.2011) |
|
April |
6.42E-05 (0.8158) |
0.000122 (0.5207) |
1.79E-05 (0.8479) |
0.000139 (0.3664) |
0.000367 (0.4787) |
9.02E-05 (0.6897) |
|
May |
-0.001119 (0.0000) |
-4.03E-05 (0.8157) |
1.49E-05 (0.8468) |
-0.000223 (0.1949) |
-0.001098 (0.0081) |
0.000329 (0.1930) |
|
June |
0.000218 (0.4956) |
0.000107 (0.6064) |
5.90E-05 (0.4788) |
-0.000362 (0.0231) |
-0.000222 (0.5795) |
-0.000107 (0.6437) |
|
July |
-0.000174 (0.6165) |
-0.000445 (0.0364) |
6.12E-05 (0.4920) |
-1.39E-05 (0.9317) |
0.000498 (0.1981) |
-0.000338 (0.2610) |
|
August |
-0.000344 (0.2979) |
-0.000586 (0.0000) |
-5.83E-05 (0.5154) |
2.14E-05 (0.9099) |
-0.000271 (0.4813) |
-0.000572 (0.0261) |
|
September |
-0.000497 (0.1068) |
0.000213 (0.1666) |
0.000185 (0.0229) |
-2.87E-05 (0.8734) |
-0.000463 (0.2240) |
0.000431 (0.1095) |
|
October |
-0.000792 (0.0004) |
-0.000240 (0.2145) |
-9.52E-05 (0.3116) |
0.000133 (0.3284) |
0.000411 (0.3190) |
-0.000531 (0.0506) |
|
November |
-0.000135 (0.5846) |
-8.62E-05 (0.5965) |
-0.000139 (0.1407) |
-4.06E-05 (0.8274) |
0.000189 (0.6006) |
-0.000250 (0.4582) |
|
December |
0.000639 (0.0067) |
0.002148 (0.0000) |
0.000166 (0.0377) |
-8.57E-05 (0.5677) |
0.000810 (0.0139) |
0.000951 (0.0000) |
|
ω |
1.97E-06*** |
6.62E-06*** |
1.48E-07*** |
1.76E-06*** |
4.13E-07*** |
2.61E-06*** |
|
α |
0.180913*** |
0.362905*** |
0.212382*** |
0.226765*** |
0.012276 |
0.277871*** |
|
β |
0.660788*** |
0.004867 |
0.751728*** |
0.522615*** |
0.936732*** |
0.603082*** |
|
γ |
-0.025221 |
1.924197*** |
-0.001953 |
0.001425 |
0.074788*** |
-0.041851 |
|
Rwanda |
South Africa |
Tanzania |
Tunisia |
Uganda |
Zambia |
|
|
January |
-9.34E-06 (0.9999) |
-0.000278 (0.2776) |
-0.000190 (0.0000) |
0.000407 (0.0000) |
-0.001369 (0.0000) |
6.38E-05 (0.6015) |
|
February |
0.000319 (0.9944) |
-8.89E-05 (0.7226) |
0.000332 (0.0000) |
0.000537 (0.0000) |
0.000917 (0.0056) |
0.000455 (0.0815) |
|
March |
0.008298 (0.1227) |
0.000221 (0.2947) |
1.13E-05 (0.8928) |
-9.48E-05 (0.3418) |
0.001980 (0.0000) |
0.000182 (0.5308) |
|
April |
-1.24E-05 (0.9999) |
0.000329 (0.1742) |
0.000346 (0.0000) |
0.000194 (0.1038) |
-0.000898 (0.0000) |
-0.000474 (0.0028) |
|
May |
0.000431 (0.9957) |
-0.000255 (0.2872) |
4.97E-05 (0.2840) |
0.000263 (0.0355) |
-0.002113 (0.0000) |
0.000163 (0.2559) |
|
June |
-9.21E-05 (0.9989) |
-0.000270 (0.2632) |
0.000617 (0.0000) |
0.000343 (0.0009) |
0.000133 (0.7086) |
-0.000164 (0.4558) |
|
July |
0.002143 (0.7001) |
0.000279 (0.2443) |
0.001172 (0.0000) |
0.000165 (0.1179) |
8.92E-05 (0.8608) |
7.65E-05 (0.7054) |
|
August |
0.025935 (0.0000) |
5.11E-05 (0.8276) |
0.000127 (0.0000) |
0.000184 (0.1446) |
-0.001015 (0.0000) |
-0.000274 (0.0848) |
|
September |
-6.82E-05 (0.9983) |
-0.000181 (0.4203) |
0.000217 (0.0000) |
-0.000338 (0.0168) |
-0.005293 (0.0000) |
-1.39E-05 (0.9511) |
|
October |
-0.000230 (0.9914) |
0.000265 (0.3014) |
0.000389 (0.0000) |
-8.07E-05 (0.4734) |
0.000203 (0.5426) |
-0.000128 (0.4993) |
|
November |
7.21E-05 (0.9979) |
0.000151 (0.4308) |
1.51E-05 (0.7061) |
-2.69E-05 (0.8547) |
0.000136 (0.7276) |
-0.000136 (0.4850) |
|
December |
-2.44E-05 (0.9997) |
0.000289 (0.1997) |
-3.80E-05 (0.2114) |
-0.000215 (0.0125) |
0.009014 (0.0000) |
-9.13E-05 (0.5137) |
|
ω |
0.000336*** |
3.19E-07*** |
1.31E-09 |
1.10E-06*** |
8.55E-06*** |
2.79E-07*** |
|
α |
0.150837*** |
-0.009064 |
0.229713*** |
0.341211*** |
0.751048*** |
0.113995*** |
|
β |
0.582669*** |
0.935328*** |
0.743824*** |
0.390873*** |
0.354096*** |
0.879440*** |
|
γ |
0.047844 |
0.114639*** |
1.038867*** |
0.117934*** |
0.304660** |
-0.034351*** |
Note. P-values for the MOY effect are reported in parentheses. Statistical significance of GARCH parameters is denoted by *p < 5%; ** p < 1%; ***p < 0.1%. Standard errors of the coefficients are presented in the Appendix (Table A2).
Table 10
MOY Effect – Covid-19 Period
|
Cote d’Ivoire |
Kenya |
Mauritius |
Morocco |
Namibia |
Nigeria |
|
|
January |
-0.000220 (0.6805) |
0.000129 (0.8601) |
-0.000211 (0.4265) |
0.000918 (0.0137) |
0.000691 (0.4098) |
0.000370 (0.4586) |
|
February |
-0.000532 (0.1824) |
0.000454 (0.5383) |
-0.000129 (0.5444) |
-0.000566 (0.1356) |
0.046572 (0.0000) |
-0.001558 (0.0001) |
|
March |
-0.000797 (0.0853) |
-0.003174 (0.0000) |
-0.001485 (0.0000) |
0.000131 (0.8007) |
1.63E-05 (0.9880) |
-0.001115 (0.0007) |
|
April |
0.000765 (0.1127) |
0.001751 (0.0008) |
-0.004811 (0.0000) |
0.000451 (0.4776) |
0.000505 (0.6688) |
0.000154 (0.7664) |
|
May |
-0.002233 (0.0000) |
-0.000489 (0.3992) |
-0.000703 (0.0041) |
0.000711 (0.0235) |
-0.000174 (0.8238) |
1.90E-05 (0.9770) |
|
June |
0.000399 (0.3771) |
0.000442 (0.5327) |
0.000957 (0.0234) |
0.000645 (0.0650) |
-0.000527 (0.5084) |
-0.000681 (0.0195) |
|
July |
-0.000409 (0.3613) |
-0.000246 (0.6358) |
-0.000310 (0.3893) |
-0.000121 (0.7772) |
-0.000498 (0.6140) |
0.000563 (0.1961) |
|
August |
0.000857 (0.0314) |
0.001232 (0.0630) |
0.000211 (0.4678) |
0.000279 (0.4116) |
-0.000221 (0.8375) |
0.000516 (0.3809) |
|
September |
0.000418 (0.3626) |
-8.53E-05 (0.8845) |
-5.19E-05 (0.8157) |
0.000234 (0.5279) |
-0.000715 (0.4510) |
0.000579 (0.2539) |
|
October |
0.000638 (0.0906) |
9.70E-05 (0.8761) |
0.000158 (0.6453) |
0.001109 (0.0000) |
-0.000761 (0.5065) |
0.001024 (0.1147) |
|
November |
0.000888 (0.0781) |
-0.000296 (0.6197) |
0.001814 (0.0000) |
-0.000206 (0.4667) |
0.000906 (0.1917) |
8.01E-06 (0.9894 |
|
December |
0.000470 (0.2383) |
0.000999 (0.1651) |
0.000582 (0.0517) |
0.000173 (0.6701) |
-3.19E-05 (0.9748) |
0.000137 (0.7029) |
|
ω |
1.81E-06*** |
2.75E-06*** |
1.06E-06*** |
4.25E-07*** |
2.11E-05*** |
4.96E-06*** |
|
α |
0.426483*** |
0.328802*** |
0.882600*** |
0.139037*** |
0.309247*** |
0.871246*** |
|
β |
0.585155*** |
0.612185*** |
0.304776*** |
0.798727*** |
0.149376*** |
0.194346*** |
|
γ |
-0.351727*** |
-0.111254 |
0.172949 |
0.056324 |
2.286272*** |
-0.584635*** |
|
Rwanda |
South Africa |
Tanzania |
Tunisia |
Uganda |
Zambia |
|
|
January |
0.003395 (0.0000) |
3.34E-05 (0.9541) |
-6.74E-05 (0.8575) |
-1.06E-05 (0.9664) |
-0.000260 (0.6955) |
-4.86E-05 (0.5628) |
|
February |
-8.94E-05 (0.5356) |
0.001132 (0.1780) |
-2.91E-05 (0.9349) |
0.000292 (0.2467) |
0.000720 (0.0996) |
1.71E-05 (0.8924) |
|
March |
-8.90E-05 (0.0000) |
0.000220 (0.7464) |
-0.001613 (0.0000) |
0.000822 (0.0001) |
-0.003819 (0.0000) |
1.57E-05 (0.8792) |
|
April |
3.58E-06 (0.9335) |
-0.000781 (0.3774) |
0.000585 (0.2181) |
-0.001192 (0.0000) |
0.0000 (0.7097) |
-0.001551 (0.0000) |
|
May |
-1.55E-05 (0.8960) |
0.000561 (0.4667) |
-5.73E-05 (0.8304) |
0.000669 (0.0052) |
0.001164 (0.0230) |
-0.000875 (0.0000) |
|
June |
-2.35E-05 (0.6225) |
-3.12E-05 (0.9588) |
0.000723 (0.0097) |
-0.000168 (0.5347) |
0.004316 (0.0000) |
-0.000781 (0.0000) |
|
July |
0.000619 (0.0000) |
0.000241 (0.6924) |
0.003250 (0.0000) |
1.73E-05 (0.9230) |
-0.000406 (0.5816) |
-2.31E-05 (0.9223) |
|
August |
5.74E-05 (0.0219) |
-0.000449 (0.5040) |
0.000241 (0.5858) |
0.000251 (0.2339) |
0.000949 (0.0184) |
3.82E-05 (0.8802) |
|
September |
-0.000469 (0.0000) |
-0.001270 (0.0226) |
-0.000469 (0.1622) |
-6.90E-05 (0.7113) |
-0.000537 (0.3896) |
-2.77E-05 (0.9224) |
|
October |
-2.30E-05 (0.7006) |
-0.000113 (0.8525) |
-0.000690 (0.0488) |
-0.000432 (0.1415) |
-0.000867 (0.1979) |
-8.13E-05 (0.5799) |
|
November |
-0.000411 (0.0000) |
-0.000277 (0.6486) |
-0.000388 (0.3363) |
0.000441 (0.0609) |
-0.000379 (0.3755) |
-0.001490 (0.0000) |
|
December |
-0.000160 (0.0000) |
-0.000322 (0.7084) |
0.000192 (0.5920) |
-0.000210 (0.2368) |
0.000395 (0.3966) |
0.001424 (0.0343) |
|
ω |
4.39E-09*** |
1.55E-06*** |
6.50E-07*** |
7.56E-07*** |
1.45E-06*** |
9.77E-09*** |
|
α |
0.408653*** |
-0.060507*** |
0.192442*** |
0.607174*** |
0.221297*** |
0.176866*** |
|
β |
0.713910*** |
0.875405*** |
0.699027*** |
0.319506*** |
0.701988*** |
0.903274*** |
|
γ |
0.190755* |
0.265790*** |
0.151080* |
-0.124338 |
0.072312 |
-0.127972*** |
Note. P-values for the MOY effect are reported in parentheses. Statistical significance of GARCH parameters is denoted by *p < 5%; ** p < 1%; ***p < 0.1%. Standard errors of the coefficients are presented in the Appendix (Table A2).
4. Results
The results regarding the existence of calendar effects are analyzed in the subsequent subsections using a GJR-GARCH (1,1) technique (Equation 3) to estimate the first equation for the Day of the Week effect and the second equation for the Month of the Year effect for each stock index in both periods: pre-Covid-19 and mid-Covid-19.
4.1 Day of the Week Effect
The results of the Day of the Week effect are presented in detail in Tables 7 and 8 for the pre-Covid-19 and mid-Covid-19 periods, respectively. For the pre-Covid-19 period, the significant statistics in the table clearly indicate that the vast majority of African stock markets exhibit the Day of the Week effect. The empirical findings demonstrate evidence of a Monday effect with negative stock returns in Côte d’Ivoire, Kenya, Mauritius, and Tanzania, and positive stock returns in Tunisia. A Tuesday effect is observed with negative stock returns in Nigeria and positive stock returns in Uganda. A Wednesday effect is seen with positive stock returns in Côte d’Ivoire, Kenya, and Tanzania, and negative stock returns in Uganda. A Thursday effect is noted with negative stock returns in Côte d’Ivoire and positive stock returns in Tunisia and Uganda. The findings also show a Friday effect with positive stock returns in Kenya, Mauritius, Nigeria, and Tunisia, and negative stock returns in Zambia. Meanwhile, stock indices in Morocco, Namibia, Rwanda, and South Africa show no evidence of the DOW effect.
During the Covid-19 period, the findings demonstrate evidence of a Monday effect in Côte d’Ivoire, Nigeria, Rwanda, and South Africa, and a Tuesday effect in Kenya and Tunisia, all associated with negative stock returns. A Wednesday effect is detected in Mauritius and Morocco, a Thursday effect in Kenya, Morocco, and Tunisia, and a Friday effect in Côte d’Ivoire, Kenya, Morocco, and Tunisia, all associated with positive stock returns. Meanwhile, the stock indices of Namibia, Tanzania, Uganda, and Zambia show no evidence of the DOW effect during the Covid-19 period.
To sum up, the results clearly confirm the presence of the DOW anomaly across all the stock markets analyzed. These findings indicate that certain days of the week exhibit significantly lower or higher average returns compared to most other days (Derbali & Hullara, 2016; Gbeda & Perpah, 2018). For the majority of markets in our sample, across both periods examined, a notable Monday effect was observed: the average return on Mondays is considerably lower than on other days of the week. In fact, it was found that average Monday returns are often negative. A plausible explanation for this Monday effect lies in various behavioral and structural factors. These may include the accumulation of negative news over the weekend, which shapes investors’ expectations at the start of the week, or a general decline in optimism during the initial trading sessions (Kinateder et al., 2019). These observations are consistent with existing literature on calendar anomalies, which frequently highlights that average returns on Mondays, when they mark the first trading day of the week, are typically lower compared to those on other days (Alagidede & Panagiotidis, 2009; Zhang et al., 2017; du Toit et al., 2018; Yardımcı & Erdem, 2020; Aslam et al., 2022; Qadan et al., 2022). At the same time, the Friday effect is clearly noticeable in our data. Across the markets and the time frame included in our sample, Friday, as the final trading day of the week, demonstrates an average return considerably higher than that of most other weekdays for the majority of stock markets. It has been observed that average returns on Fridays are consistently positive. This trend aligns with existing literature on the day of the week effect, which indicates that the last trading day of the week often records significantly higher average returns in many international stock markets (Stoica & Diaconaşu, 2011; Gbeda & Peprah, 2018; Obalade & Muzindutsi, 2019; Ferrouhi et al., 2021; Khan et al., 2023).
Additionally, the analysis shows that African stock markets underwent significant changes during Covid-19, with some anomalies appearing and others disappearing. In Côte d’Ivoire, Wednesday and Thursday anomalies disappeared, and a Friday anomaly appeared. In Kenya, Monday and Wednesday anomalies disappeared, and Tuesday and Thursday anomalies appeared. In Mauritius, Monday and Friday anomalies disappeared, and a Wednesday anomaly appeared. In Nigeria, Tuesday and Friday anomalies disappeared, and a Monday anomaly appeared. In Tunisia, a Tuesday anomaly appeared, and a Monday anomaly disappeared. On the other hand, some markets that were totally efficient before Covid-19 lost their efficiency with the emergence of certain anomalies. Morocco experienced the appearance of anomalies on Wednesday, Thursday, and Friday. Rwanda and South Africa saw the emergence of a Monday anomaly. Conversely, other markets that were inefficient before Covid-19 established their efficiency during the pandemic. Tanzania benefited from the disappearance of anomalies on Monday and Wednesday. Uganda saw the disappearance of anomalies on Tuesday, Wednesday, and Thursday. Zambia experienced the disappearance of a Friday anomaly. Meanwhile, Namibia underwent no change, remained totally efficient, and maintained its efficiency throughout the period.
These results are in perfect alignment with existing literature, which has shown that crises, such as the one triggered by Covid-19, disrupt market efficiency due to increased volatility, behavioral biases, and investor uncertainty (Malkiel, 2003). Studies (Çelik, 2021; Liew et al., 2022; Bassiouny et al., 2023; Tauseef, 2023, Sahu et al., 2024; Kumar, 2024) suggest that these anomalies can emerge or disappear depending on investor reactions to exceptional conditions, thus explaining the changes observed in African markets. Emerging markets, like those studied, are particularly vulnerable to such fluctuations, which may account for the variations in efficiency observed during the pandemic.
4.2 Month of the Year Effect
The results of the Month of the Year effect are presented in Tables 9 and 10 for the pre-Covid-19 and mid-Covid-19 periods, respectively. During the pre-Covid-19 period, based on the significant statistics in the table, it is clear that all African stock markets, with the exception of South Africa, exhibit the Month of the Year effect. Additionally, it is observed that every month of the year, except November, has an effect on African stock markets. The empirical findings demonstrate evidence of a January effect with negative stock returns in Côte d’Ivoire, Tanzania, and Uganda, and positive stock returns in Tunisia. A February effect is observed with positive stock returns in Côte d’Ivoire, Kenya, Morocco, Tanzania, Tunisia, Uganda, and Zambia. A March effect is seen with positive stock returns in Kenya and Uganda, and negative stock returns in Morocco. An April effect is noted with positive stock returns in Tanzania, and negative stock returns in Uganda and Zambia. A May effect is observed with negative stock returns in Côte d’Ivoire, Namibia, and Uganda, and positive stock returns in Tunisia. A June effect is seen with negative stock returns in Morocco, and positive stock returns in Tanzania and Tunisia. A July effect is noted with negative stock returns in Kenya, and positive stock returns in Tanzania. An August effect is observed with negative stock returns in Kenya, Nigeria, Uganda, and Zambia, and positive stock returns in Rwanda and Tanzania. A September effect is seen with positive stock returns in Mauritius and Tanzania, and negative stock returns in Tunisia and Uganda. An October effect is detected with negative stock returns in Côte d’Ivoire and Nigeria, and positive stock returns in Tanzania. Additionally, a December effect is observed with positive stock returns in Côte d’Ivoire, Kenya, Mauritius, Namibia, Nigeria, and Uganda, and negative stock returns in Tunisia.
During the Covid-19 period, it is clear from the table that all twelve months of the year have a significant effect on African stock markets, and all African stock markets exhibit this effect. The empirical findings demonstrate evidence of a January effect with positive stock returns in Morocco and Rwanda. A February effect is observed with positive stock returns in Namibia and Uganda, and negative stock returns in Nigeria. A March effect is detected with negative stock returns in Côte d’Ivoire, Kenya, Mauritius, Nigeria, Rwanda, Tanzania, and Uganda, and positive stock returns in Tunisia. An April effect is noted with positive stock returns in Kenya, and negative stock returns in Mauritius, Tunisia, and Zambia. A May effect is seen with negative stock returns in Côte d’Ivoire, Mauritius, and Zambia, and positive stock returns in Morocco, Tunisia, and Uganda. A June effect is observed with positive stock returns in Mauritius, Morocco, Tanzania, and Uganda, and negative stock returns in Nigeria and Zambia. A July effect is noted with positive stock returns in Rwanda and Tanzania. An August effect is seen with positive stock returns in Côte d’Ivoire, Kenya, Rwanda, and Uganda. A September effect is observed with negative stock returns in Rwanda and South Africa. An October effect is detected with positive stock returns in Côte d’Ivoire and Morocco, and negative stock returns in Tanzania. A November effect is seen with positive stock returns in Côte d’Ivoire, Mauritius, and Tunisia, and negative stock returns in Rwanda and Zambia. Lastly, a December effect is detected with positive stock returns in Mauritius and Zambia, and negative stock returns in Côte d’Ivoire.
To sum up, the results provide significant evidence of the Month of the Year (MOY) anomaly across all stock markets, demonstrating that a specific month tends to exhibit significantly higher or lower mean returns compared to most other months (Alagided, 2013; Chiki et al., 2019; Obalade & Muzindutsi, 2020). In our sample, the December effect and the March effect are the most frequently observed anomalies. Several studies suggest that the December effect may be attributed to window dressing. Before the end of the year, fund managers adjust their portfolios to present better performance. This may involve selling underperforming stocks and buying higher-performing ones, which leads to an increase in prices (Worthington, 2010; Kinateder et al., 2019; Ferrouhi et al., 2021). The March effect, on the other hand, is particularly pronounced in African markets due to region-specific dynamics. In many countries, March marks the fiscal year-end for governments and corporations, prompting investors to adjust portfolios to optimize financial statements or position themselves strategically ahead of annual reporting. Additionally, low market liquidity in the region amplifies the impact of these movements on asset prices, making the March effect more significant (Obalade & Muzindutsi, 2020; Elangovan et al., 2022).
Additionally, the analysis shows that African stock markets underwent significant changes during Covid-19, with some anomalies appearing and others disappearing. In Côte d’Ivoire, January, February, and December anomalies disappeared, and March, August, and November anomalies appeared. In Kenya, February, July, and December anomalies disappeared, and an April anomaly appeared. In Mauritius, March, April, May, June, and November anomalies appeared, while a September anomaly disappeared. In Morocco, February and March anomalies disappeared, and Monday, May, and October anomalies appeared. In Namibia, May and December anomalies disappeared, and a February anomaly appeared. In Nigeria, August, October, and December anomalies disappeared, and February, March, and June anomalies appeared. In Rwanda, January, March, July, September, November, and December anomalies appeared. South Africa was totally efficient before Covid-19 but lost its efficiency with the appearance of a September effect. In Tanzania, January, February, April, August, and September anomalies disappeared, and a March anomaly appeared. In Tunisia, January, February, June, September, and December anomalies disappeared, and March, April, and November anomalies appeared. In Uganda, January, April, September, and December anomalies disappeared, and a June anomaly appeared. In Zambia, February and August anomalies disappeared, and May, June, November, and December anomalies appeared.
Overall, these findings underscore the dynamic nature of market efficiency and the influence of global crises on investor behavior, supporting the notion that stock markets are not always efficient and can experience significant changes during periods of economic turmoil, as evidenced by the Covid-19 pandemic aligning with findings in the literature (Ngwakwe, 2020; Ozkan, 2021; Scherf et al., 2022; Yang et al., 2023; Bassiouny et al., 2023; Kumar, 2024).
Table 11 presents a systematic comparison of our results with previous studies on calendar anomalies, including the most pronounced Day of the Week (Monday and Friday) and Month of the Year (December and March) effects in our sample. It also highlights the impact of Covid-19 on these anomalies, emphasizing disruptions to traditional patterns across the sample markets.
Table 11
Systematic Comparison of Study Results with Previous Literature
|
Effect |
Our results |
Consistent studies |
Explanation/Theories |
|
DOW |
|||
|
Monday |
Negative/low returns across most markets |
Alagidede and Panagiotidis, 2009; Zhang et al., 2017; du Toit et al., 2018; Yardımcı and Erdem, 2020; Aslam et al., 2022; Qadan et al., 2022 |
Accumulation of negative news over the weekend; pessimism |
|
Friday |
Positive/high returns across most markets |
Stoica and Diaconaşu, 2011; Gbeda and Peprah, 2018; Obalade and Muzindutsi, 2019; Ferrouhi et al., 2021; Khan et al., 2023 |
Positive sentiment; end-of-week optimism |
|
MOY |
|||
|
December |
Positive/high returns across most markets |
Worthington, 2010; Kinateder et al., 2019; Ferrouhi et al., 2021 |
Window dressing |
|
March |
Negative/low returns across most markets |
Obalade and Muzindutsi, 2020; Elangovan et al., 2022 |
Fiscal year-end adjustments; low market liquidity |
|
Covid-19 |
|||
|
DOW and MOY |
Disrupted market efficiency in African emerging markets |
Ngwakwe, 2020; Çelik, 2021; Ozkan, 2021; Liew et al., 2022; Bassiouny et al., 2023; Tauseef, 2023, Sahu et al., 2024; Kumar, 2024; Scherf et al., 2022; Yang et al., 2023 |
Increased volatility; behavioral biases; investor uncertainty during crises |
Based on these results, our initial hypotheses regarding the presence and variability of calendar anomalies in African stock markets were partially validated (Table 12). For H1, the Day of the Week (DOW) anomaly (H1.1) was confirmed in eight countries, including Côte d’Ivoire, Kenya, and Tunisia, but rejected in markets like Morocco, Namibia, and South Africa, highlighting that this anomaly is not universally observed across the continent. Similarly, the Month of the Year (MOY) anomaly (H1.2) was validated in eleven countries but rejected in South Africa, indicating some regional heterogeneity in investor behavior. Regarding H2, the Covid-19 pandemic significantly affected the existence and magnitude of these anomalies, with the DOW anomaly (H2.1) being altered or disappearing in most markets except Namibia, while the MOY anomaly (H2.2) was universally impacted. Finally, H3 was fully confirmed, showing significant differences in the manifestation of both anomalies (H3.1 and H3.2) across the twelve markets, likely influenced by their specific structural and behavioral characteristics. These findings emphasize the localized nature of calendar anomalies and their sensitivity to external shocks such as the Covid-19 pandemic.
Table 12
Hypotheses Validation
|
Hypothesis |
Sub-Hypothesis |
Confirmed |
Rejected |
|
H1 |
H1.1 |
Cote d’Ivoire, Kenya, Mauritius, Nigeria, Tanzania, Tunisia, Uganda, Zambia |
Morocco, Namibia, Rwanda, and South Africa |
|
H1.2 |
Cote d’Ivoire, Kenya, Mauritius, Morocco, Namibia, Nigeria, Rwanda, Tanzania, Tunisia, Uganda, Zambia |
South Africa |
|
|
H2 |
H2.1 |
Cote d’Ivoire, Kenya, Mauritius, Morocco, Nigeria, Rwanda, South Africa Tanzania, Tunisia, Uganda, Zambia |
Namibia |
|
H2.2 |
All twelve countries |
- |
|
|
H3 |
H3.1 |
All twelve countries |
- |
|
H3.2 |
All twelve countries |
- |
5. Conclusion
This study investigates two of the most popular calendar anomalies: Day of the Week and Month of the Year for twelve African stock markets using daily closing prices of their main stock indices (BRVM composite, Nairobi All Share, SEMDEX, MASI, FTSE NSX Overall, NSE All Share, Rwanda All Share, FTSE South Africa, Tanzania All Share, TUNINDEX, Uganda All Share and LES All Share) over the period from January 1, 2009 to December 31, 2021. The objective is to examine the impact of Covid-19 on calendar anomalies in the main African stock markets.
The findings of this study reveal a profound impact of the Covid-19 pandemic on calendar anomalies in African stock markets, significantly altering the Day of the Week (DOW) and Month of the Year (MOY) effects. Specifically, the pandemic disrupted the relationship between these calendar anomalies and market dynamics, resulting in notable shifts across various markets. For the DOW effect, anomalies either emerged or disappeared during the pandemic in Côte d’Ivoire, Kenya, Mauritius, Nigeria, and Tunisia, reflecting changing patterns of market behavior. In contrast, Tanzania, Uganda, and Zambia exhibited increased efficiency as all anomalies disappeared, suggesting these markets adapted to the crisis effectively. Conversely, Morocco, Rwanda, and South Africa experienced a loss of market efficiency during the pandemic, highlighting vulnerabilities in their market structures. Namibia stood out as an exception, maintaining its efficiency throughout the period. Similarly, the MOY effect showed widespread changes across all examined markets due to the pandemic. All markets, except South Africa, were inefficient before the pandemic and experienced further deterioration during the crisis. South Africa, initially efficient, also lost its efficiency, underscoring the pandemic’s destabilizing influence on market dynamics.
This study contributes to the literature on market anomalies and efficiency by offering empirical evidence of how external shocks, such as the Covid-19 pandemic, reshape established patterns in financial markets. The findings provide practical implications for investors, policymakers, and academics. Investors can leverage these findings to refine their strategies, adjusting their trading habits to exploit periods when anomalies emerge. For instance, during times of crises, understanding the shifts in DOW and MOY effects can guide more informed decision-making, mitigating risks and identifying opportunities. Policymakers are encouraged to address the role of investor sentiment and market behavior during crises by implementing policies aimed at reducing information asymmetry, enhancing market transparency, and mitigating short-term volatility. These measures can foster more resilient financial systems capable of withstanding external shocks. For academics, this study offers valuable insights into the specific impact of the Covid-19 pandemic on market efficiency and calendar anomalies in African stock markets, emphasizing how external disruptions can lead to shifts in market behavior and efficiency, thereby contributing to a deeper understanding of the dynamics at play in financial markets during crises.
While highlighting the added value of this work, the study also acknowledges its limitations, which simultaneously pave the way for future research. The study focused exclusively on two calendar anomalies: the Day of the Week and the Month of the Year. Future research could explore additional calendar anomalies, such as the Turn of the Month, Day of the Month, Half of the Month, and Holiday effects, for a more in-depth examination of calendar anomalies. Moreover, the study was limited to African countries. Future studies could expand to international stock markets for a broader analysis and generalization of results across different countries. Alternatively, they could compare African countries with other regions to uncover broader patterns and highlight the convergences and divergences between regions. Finally, to demonstrate the impact of Covid-19, this study focused solely on comparing calendar anomalies before and during the pandemic. However, as market structures have changed significantly post-Covid-19, future studies could compare conditions before and after the pandemic to provide a more comprehensive analysis.
Acknowledgments
The authors acknowledge the use of ChatGPT-4 to improve the readability and language.
References
Adaramola, A. O., & Adekanmbi, K. O. (2020). Day-of-the-week effect in Nigerian stock exchange: Adaptive market hypothesis approach. Investment Management & Financial Innovations, 17(1), 97.
Alagidede, P. (2008). Day of the week seasonality in African stock markets. Applied Financial Economics Letters, 4(2), 115–120. https://doi.org/10.1080/17446540701537749
Alagidede, P., & Panagiotidis, T. (2009). Calendar anomalies in the Ghana stock exchange. Journal of Emerging Market Finance, 8(1), 1–23.
Alagidede, P. (2013). Month of the year and pre-holiday effects in African stock markets. South African Journal of Economic and Management Sciences, 16(1), 64–74.
Aleknevičienė, V., Klasauskaitė, V., & Aleknevičiūtė, E. (2022). Behavior of calendar anomalies and the adaptive market hypothesis: Evidence from the Baltic stock markets. Journal of Baltic Studies, 53(2), 187–210.
Aslam, F., Hunjra, A. I., Tayachi, T., Verhoeven, P., & Mohmand, Y. T. (2022). Calendar Anomalies in Islamic Frontier Markets. SAGE Open, 12(2). http://doi.org/10.1177/21582440221097886
Baker, S. R., Bloom, N., Davis, S. J., Kost, K., Sammon, M., & Viratyosin, T. (2020). The unprecedented stock market reaction to COVID-19. The Review of Asset Pricing Studies, 10(4), 742–758.
Ball, R. (1978). Anomalies in relationships between securities’ yields and yield-surrogates. Journal of Financial Economics, 6(2–3), 103–126.
Białkowski, J., Bohl, M. T., Kaufmann, P., & Wisniewski, T. P. (2013). Do mutual fund managers exploit the Ramadan anomaly? Evidence from Turkey. Emerging Markets Review, 15, 211–232.
Bassiouny, A., Kiryakos, M., & Tooma, E. (2023). Examining the adaptive market hypothesis with calendar effects: International evidence and the impact of COVID-19. Global Finance Journal, 56, 100777.
Bera, A. K., & Jarque, C. M. (1981). Efficient tests for normality, homoscedasticity and serial independence of regression residuals: Monte Carlo evidence. Economics Letters, 7(4), 313–318.
Berument, M. H., & Dogan, N. (2012). Stock market return and volatility: day-of-the-week effect. Journal of Economics and Finance, 36, 282–302.
https://doi.org/10.1007/s12197-009-9118-y
Blake, D. (2000). Financial market analysis. Chichester, England: John Wiley & Sons Ltd.
Bollerslev, T. (1986). Generalized autoregressive conditional heteroskedasticity. Journal of Econometrics, 31(3), 307–327.
Brown, P., Keim, D. B., Kleidon, A. W., & Marsh, T. A. (1983). Stock return seasonalities and the tax-loss selling hypothesis: Analysis of the arguments and Australian evidence. Journal of Financial Economics, 12(1), 105–127.
Chatzitzisi, E., Fountas, S., & Panagiotidis, T. (2021). Another look at calendar anomalies. The Quarterly Review of Economics and Finance, 80, 823–840.
Çelik, A. (2021). Volatility of BIST 100 returns after 2020, calendar anomalies and COVID-19 effect. BDDK Bankacılık ve Finansal Piyasalar Dergisi, 15(1), 61–81.
Chen, C. P., & Metghalchi, M. (2012). Weak-form market efficiency: Evidence from the Brazilian stock market. International Journal of Economics and Finance, 4(7), 22–32.
Chen, J., Frijns, B., Indriawan, I., & Ren, H. (2019). Turn of the Month effect in the New Zealand stock market. New Zealand Economic Papers, 53(3), 288–306.
Chia, R. C. J., Liew, V. K. S., & Syed Khalid Wafa, S. A. W. (2007). Day-of-the-week effects in Selected East Asian stock markets. MPRA paper, 7299.
Chikhi, M., Bendob, A., & Siagh, A. R. (2019). Day-of-the-week and month-of-the-year effects on French Small-Cap Volatility: the role of asymmetry and long memory. Eastern Journal of European Studies, 10(2), 221.
Chawla, V, Garg, V. & Tripathi, G. C. (2023). A Study of Turn of Month Effect for BRICS Stock Markets. Finance India, 37(3).
Cubbin, E., Eidne, M., Firer, C., & Gilbert, E. (2006). Mean reversion on the JSE. Investment Analysts Journal, 35(63), 39–47.
Derbali, A., & Hallara, S. (2016). Day-of-the-week effect on the Tunisian stock market return and volatility. Cogent Business and Management, 3 (1), 1147111. https://doi.org/10.1080/23311975.2016.1147111
Dickey, D. A., & Fuller, W. A. (1979). Distribution of the estimators for autoregressive time series with a unit root. Journal of the American Statistical Association, 74(366a), 427–431.
Du Toit, E., Hall, J. H., & Pradhan, R. P. (2018). The day-of-the-week effect: South African stock market indices. African Journal of Economic and Management Studies, 9(2), 197–212. https://doi.org/10.1108/AJEMS-07-2017-0163
Elangovan, R., Irudayasamy, F. G., & Parayitam, S. (2022). Month-of-the-Year Effect: Empirical Evidence from Indian Stock Market. Asia-Pacific Financial Markets, 29(3), 449–476. https://doi.org/10.1007/s10690-021-09356-2
Engle, R. F. (1982). Autoregressive conditional heteroscedasticity with estimates of the variance of United Kingdom inflation. Econometrica: Journal of the Econometric Society, 987–1007.
Fama, E. F. (1965). The behavior of stock-market prices. The Journal of Business, 38(1), 34–105.
Farooq, O., Bouaddi, M., & Ahmed, N. (2013). Day of the Week and its Effect on Stock Market Volatility: Evidence from an Emerging Market. Journal of Applied Business Research (JABR), 29(6), 1727–1736. https://doi.org/10.19030/jabr.v29i6.8210
Ferrouhi, E. M., Kharbouch, O., Aguenaou, S., & Naeem, M. (2021). Calendar anomalies in African stock markets. Cogent Economics & Finance, 9(1), 1978639.
Floros, C., & Salvador, E. (2014). Calendar anomalies in cash and stock index futures: International evidence. Economic Modelling, 37, 216–223.
French, K. R. (1980). Stock returns and the weekend effect. Journal of Financial Economics, 8(1), 55–69.
Gadhavi, M. Y. (2024). Detecting anomalies in currency market of BRICS countries: Insights into emerging economies. Managerial Finance, 51(1), 111–125.
Gbeda, J. M., & Peprah, J. A. (2018). Day of the week effect and stock market volatility in Ghana and Nairobi stock exchanges. Journal of Economics and Finance, 42, 727–745. https://doi.org/10.1007/s12197-017-9409-7
Ghallabi, F., Bougatef, K., & Mnari, O. (2024). Calendar anomalies and asymmetric volatility of returns in the Indonesian stock market: conventional vs Islamic indices. Journal of Islamic Accounting and Business Research, ahead of print. https://doi.org/10.1108/JIABR-08-2023-0282
Gibbons, M. R., & Hess, P. (1981). Day of the week effects and asset returns. Journal of Business, 579–596.
Glosten, L. R., Jagannathan, R., & Runkle, D. E. (1993). On the relation between the expected value and the volatility of the nominal excess return on stocks. The Journal of Finance, 48(5), 1779–1801.
Goudarzi, H. (2013). Volatility mean reversion and stock market efficiency. Asian Economic and Financial Review, 3(12), 1681.
Hasan, M. B., Hassan, M. K., Rashid, M. M., Ali, M. S., & Hossain, M. N. (2022). Calendar anomalies in the stock markets: Conventional vs Islamic stock indices. Managerial Finance, 48(2), 258–276.
Hasan, F., & Al-Najjar, B. (2024). Calendar anomalies and dividend announcements effects on the stock markets returns. Review of Quantitative Finance and Accounting, 1–31.
Hsu, Y. T., Koedijk, K. G., Liu, H. C., & Wang, J. N. (2022). Further evidence on calendar anomalies. European Financial Management, 28(2), 545–566.
Izzeldin, M., Murado˘glu, Y. G., Pappas, V., & Sivaprasad, S. (2021). The impact of Covid-19 on G7 stock markets volatility: Evidence from a ST-HAR model. International Review of Financial Analysis, 74, Article 101671.
Jaffe, J., & Westerfield, R. (1985). The weekend effect in common stock returns: The international evidence. The Journal of Finance, 40(2), 433–454.
Jamroz, P., & Koronkiewicz, G. (2014). The occurrence of the day-of-the-week effects on Polish and major world stock markets. Studies in Logic, Grammar, and Rhetoric, 37(50). https://doi.org/10.2478/slgr-2014-0018
Kaniel, R., Liu, S., Saar, G., & Titman, S. (2012). Individual investor trading and return patterns around earnings announcements. The Journal of Finance, 67(2), 639–680.
Khan, B., Aqil, M., Alam Kazmi, S. H., & Zaman, S. I. (2023). Day‐of‐the‐week effect and market liquidity: A comparative study from emerging stock markets of Asia. International Journal of Finance & Economics, 28(1), 544–561. https://doi.org/10.1002/ijfe.2435
Keim, D. B., & Stambaugh, R. F. (1984). A further investigation of the weekend effect in stock returns. The Journal of Finance, 39(3), 819–835.
Keim, D. B., & Stambaugh, R. F. (1986). Predicting returns in the stock and bond markets. Journal of Financial Economics, 17(2), 357–390.
Kinateder, H., Weber, K., & Wagner, N. (2019). Revisiting calendar anomalies in BRICS countries. Buletin Ekonomi Moneter dan Perbankan, 22(2), 213–236.
Kinateder, H., & Papavassiliou, V. G. (2021). Calendar effects in bitcoin returns and volatility. Finance Research Letters, 38, 101420.
Kumar, S. (2024). On the (In) efficiency of gold and bitcoin: Impact of COVID-19. Managerial Finance, 50(8), 1480–1489.
Kunkel, R. A., Compton, W. S., & Beyer, S. (2003). The turn-of-the-month effect still lives: The international evidence. International Review of Financial Analysis, 12(2), 207–221.
Liew, V. K. S., Chia, R. C. J., Riaz, S., & Lau, E. (2022). Is there any day-of-the-week effect amid the Covid-19 panic in the Malaysian stock market?. The Singapore Economic Review, 1–19.
Malkiel, B. G. (2003). The efficient market hypothesis and its critics. Journal of Economic Perspectives, 17(1), 59–82.
Milos, M. C., Donath, L., Nachescu, M., Hetes, R., & Cerba, C. (2024). New Insights on Calendar Anomalies in CEE Stock Markets. Transformations in Business & Economics, 23(1).
Munir, Q., & Sook Ching, K. (2019). Revisiting calendar effects in Malaysian finance stocks market: Evidence from threshold GARCH (TGARCH) model. Communications in Statistics-Theory and Methods, 48(6), 1377–1400. http://doi.org/10.1080/03610926.2018.1433846
Ngwakwe, C. C. (2020). Effect of COVID-19 pandemic on global stock market values: A differential analysis. Acta Universitatis Danubius. Œconomica, 16(2), 255–269.
Obalade, A. A., & Muzindutsi, P. F. (2019). The Adaptive Market Hypothesis and the Day-of-the-Week Effect in African Stock Markets: The Markov Switching Model. Comparative Economic Research Central and Eastern Europee, 22 (3).
Obalade, A. A., & Muzindutsi, P. F. (2019). Time-varying Calendar Anomaly in African Stock Markets: Application of GARCH Models. Journal of Global Business and Technology, 15(2), 1–16.
Obalade, A. A., & Muzindutsi, P. F. (2020). Static or adaptive? The month-of-the-year and intra-month effects in African stock markets. International Journal of Monetary Economics and Finance, 13(3), 215–234.
Ozkan, O. (2021). Impact of COVID-19 on stock market efficiency: Evidence from developed countries. Research in International Business and Finance, 58, Article 101445.
Qiao, Z., Qiao, W., & Wong, W. K. (2011). Examining the Day-of-the-Week Effects in Chinese Stock Markets: New Evidence from a Stochastic Dominance Approach. Global Economic Review, 40(3), 251–267. https://doi.org/10.1080/1226508X.2011.601628
Rohuma, H. N., & Brijlal, P. (2023). Calendar Month Effect in Bursa Malaysia: A Comparison between Shariah-Compliant Portfolio and Non-Shariah-Compliant Portfolio. International Journal of Economics and Financial Issues, 13(2), 12–17.
Sahu, S., Ramírez, A. F., & Kim, J. M. (2024). Exploring Calendar Anomalies and Volatility Dynamics in Cryptocurrencies: A Comparative Analysis of Day-of-the-Week Effects before and during the COVID-19 Pandemic. Journal of Risk and Financial Management, 17(8), 351.
Scherf, M., Matschke, X., & Rieger, M. O. (2022). Stock market reactions to COVID-19 lockdown: A global analysis. Finance Research Letters, 45, Article 102245.
Shehadeh, A. A., & Zheng, M. (2023). Calendar anomalies in stock market returns: Evidence from Middle East countries. International Review of Economics & Finance, 88, 962–980. https://doi.org/10.1016/j.iref.2023.07.013
Sikes, S. A. (2014). The turn-of-the-year effect and tax-loss-selling by institutional investors. Journal of Accounting and Economics, 57(1), 22–42.
Singha, D. H., & Kakaty, S. C. (2023). Analysing Month-of-the-Year Effect in the Indian Stock Market: A Special Reference to NSE . International Journal of Agricultural & Statistical Sciences, 19(2).
Silva, P. M. (2010). Calendar “anomalies” in the Portuguese stock market. Investment Analysts Journal, 39(71), 37–50.
Slamet, I., Ali, A., & Qonaah, N. (2024, February). Analysis of calendar anomalies in Indonesian stock market using stochastic dominance approach. In AIP Conference Proceedings (Vol. 2920, No. 1). AIP Publishing.
Steeley, J. M. (2001). A note on information seasonality and the disappearance of the weekend effect in the UK stock market. Journal of Banking & Finance, 25(10), 1941–1956.
Stoica, O., & Diaconasu, D. E. (2011). An examination of the calendar anomalies on emerging Central and Eastern European stock markets. Recent Researches in Applied Economics.
Tauseef, S. (2023). Herd behaviour in an emerging market: an evidence of calendar and size effects. Journal of Asia Business Studies, 17(3), 639–655.
Thaler, R. H. (1987). Anomalies: Weekend, holiday, turn of the month, and intraday effects. Journal of Economic Perspectives, 1(2), 169–177.
Tonchev, D., & Kim, T. H. (2004). Calendar effects in Eastern European financial markets: Evidence from the Czech Republic, Slovakia and Slovenia. Applied Financial Economics, 14(14), 1035–1043.
Tuyekar, S. P., Padyala, S. R., & Ramesh, B. (2023). Empirical Evidence on Calendar Anomalies in Trading and Non-Trading Day Returns in Indian Stock Market. Finance India, 37(3).
Urquhart, A., & McGroarty, F. (2014). Calendar effects, market conditions and the adaptive market hypothesis: Evidence from long-run US data. International Review of Financial Analysis, 35, 154–166.
Valadkhani, A., & O’Mahony, B. (2024). Sector-specific calendar anomalies in the US equity market. International Review of Financial Analysis, 95, 103347.
Worthington, A. C. (2010). The decline of calendar seasonality in the Australian stock exchange, 1958–2005. Annals of Finance, 6, 421–433.
Wuthisatian, R. (2022). An examination of calendar anomalies: evidence from the Thai stock market. Journal of Economic Studies, 49(3), 422–434.
Yang, A. S. (2016). Calendar trading of Taiwan stock market: A study of holidays on trading detachment and interruptions. Emerging Markets Review, 28, 140–154.
Yang, W., Watanabel, N., & Sakawa, H. (2023). Does COVID-19-specific news affect stock market liquidity? Evidence from Japan. MethodsX, 11, 102360.
Yardımcı, B., & Erdem, S. (2020). The day of the week effects in stock markets of countries with predominantly Muslim populations. International Journal of Islamic and Middle Eastern Finance and Management, 13(2), 195–218. https://doi.org/10.1108/IMEFM-06-2018-0199
Zhang, J., Lai, Y., & Lin, J. (2017). The day-of-the-week effects of stock markets in different countries. Finance Research Letters, 20, 47–62. https://doi.org/10.1016/j.frl.2016.09.006
Appendix
Table A1
Standard Errors of the Coefficients for DOW Effect
|
Cote d’Ivoire |
Kenya |
Mauritius |
Morocco |
Namibia |
Nigeria |
Rwanda |
South Africa |
Tanzania |
Tunisia |
Uganda |
Zambia |
|
|
Pre-Covid-19 period |
||||||||||||
|
Monday |
0.000182 |
0.000107 |
4.98E-05 |
0.000106 |
0.000304 |
0.000176 |
0.005333 |
0.000166 |
5.65E-05 |
6.38E-05 |
0.000259 |
0.000126 |
|
Tuesday |
0.000193 |
0.000119 |
5.41E-05 |
0.000106 |
0.000279 |
0.000161 |
0.011367 |
0.000158 |
7.79E-05 |
6.38E-05 |
0.000144 |
0.000105 |
|
Wednesday |
0.000176 |
0.000123 |
5.01E-05 |
0.000103 |
0.000270 |
0.000153 |
0.006794 |
0.000157 |
3.44E-05 |
6.81E-05 |
0.000348 |
0.000136 |
|
Thursday |
0.000187 |
0.000129 |
5.37E-05 |
9.53E-05 |
0.000258 |
0.000168 |
0.017902 |
0.000158 |
5.11E-05 |
7.36E-05 |
7.86E-05 |
0.000114 |
|
Friday |
0.000178 |
9.77E-05 |
5.40E-05 |
8.39E-05 |
0.000277 |
0.000190 |
0.022793 |
0.000175 |
7.00E-05 |
6.95E-05 |
0.000183 |
0.000116 |
|
ω |
3.81E-07 |
9.18E-08 |
1.57E-08 |
2.00E-07 |
1.26E-07 |
2.90E-07 |
1.60E-05 |
5.99E-08 |
4.40E-09 |
7.73E-08 |
4.16E-07 |
1.49E-08 |
|
α |
0.026923 |
0.038903 |
0.015258 |
0.024542 |
0.006670 |
0.024411 |
0.021899 |
0.005755 |
0.018895 |
0.028960 |
0.038041 |
0.008498 |
|
β |
0.045989 |
0.008949 |
0.013188 |
0.040798 |
0.009702 |
0.029019 |
0.018961 |
0.008118 |
0.005137 |
0.027403 |
0.002723 |
0.004935 |
|
γ |
0.035512 |
0.099922 |
0.016113 |
0.028600 |
0.014548 |
0.031714 |
0.032134 |
0.011660 |
0.019071 |
0.034752 |
0.211986 |
0.008553 |
|
Covid-19 period |
||||||||||||
|
Monday |
0.000265 |
0.000345 |
0.000188 |
0.000197 |
0.017699 |
0.000226 |
5.36E-05 |
0.000433 |
0.000265 |
0.000130 |
0.000454 |
0.000245 |
|
Tuesday |
0.000341 |
0.000394 |
0.000243 |
0.000281 |
0.030231 |
0.000284 |
7.59E-05 |
0.000475 |
0.000307 |
0.000124 |
0.000502 |
0.000225 |
|
Wednesday |
0.000298 |
0.000401 |
0.000189 |
0.000259 |
0.030752 |
0.000292 |
6.68E-05 |
0.000470 |
0.000294 |
0.000131 |
0.000497 |
0.000192 |
|
Thursday |
0.000294 |
0.000371 |
0.000203 |
0.000257 |
0.027142 |
0.000334 |
4.67E-05 |
0.000434 |
0.000342 |
0.000138 |
0.000415 |
0.000181 |
|
Friday |
0.000316 |
0.000390 |
0.000252 |
0.000230 |
0.030330 |
0.000242 |
7.01E-05 |
0.000479 |
0.000277 |
0.000138 |
0.000432 |
0.000182 |
|
ω |
7.04E-07 |
5.07E-07 |
7.39E-08 |
1.67E-07 |
0.001484 |
5.56E-07 |
8.80E-10 |
4.57E-07 |
1.14E-07 |
1.11E-07 |
1.04E-06 |
4.42E-09 |
|
α |
0.062748 |
0.052066 |
0.030349 |
0.037246 |
0.002418 |
0.158491 |
0.004380 |
0.028362 |
0.030012 |
0.135161 |
0.052100 |
0.007148 |
|
β |
0.102749 |
0.052030 |
0.009718 |
0.037609 |
0.557396 |
0.053519 |
0.001207 |
0.038083 |
0.017739 |
0.053201 |
0.081447 |
0.004725 |
|
γ |
0.068019 |
0.056894 |
0.047078 |
0.040008 |
0.063964 |
0.167522 |
0.007023 |
0.047872 |
0.032859 |
0.142578 |
0.059329 |
0.007110 |
Table A2
Standard Errors of the Coefficients for MOY Effect
|
Cote d’Ivoire |
Kenya |
Mauritius |
Morocco |
Namibia |
Nigeria |
Rwanda |
South Africa |
Tanzania |
Tunisia |
Uganda |
Zambia |
|
|
Pre-Covid-19 period |
||||||||||||
|
January |
0.000180 |
0.000172 |
8.60E-05 |
0.000141 |
0.000508 |
0.000358 |
0.053084 |
0.000256 |
2.39E-05 |
7.71E-05 |
0.000236 |
0.000122 |
|
February |
0.000332 |
0.000108 |
9.38E-05 |
0.000156 |
0.000428 |
0.000268 |
0.045509 |
0.000250 |
4.66E-05 |
8.59E-05 |
0.000331 |
0.000261 |
|
March |
0.000279 |
0.000120 |
9.45E-05 |
0.000154 |
0.000366 |
0.000244 |
0.005375 |
0.000211 |
8.41E-05 |
9.97E-05 |
0.000248 |
0.000291 |
|
April |
0.000276 |
0.000191 |
9.34E-05 |
0.000154 |
0.000518 |
0.000226 |
0.104522 |
0.000242 |
3.87E-05 |
0.000119 |
0.000175 |
0.000159 |
|
May |
0.000241 |
0.000173 |
7.72E-05 |
0.000172 |
0.000415 |
0.000253 |
0.080933 |
0.000240 |
4.64E-05 |
0.000125 |
0.000246 |
0.000144 |
|
June |
0.000319 |
0.000208 |
8.33E-05 |
0.000159 |
0.000401 |
0.000231 |
0.066798 |
0.000241 |
4.29E-05 |
0.000103 |
0.000355 |
0.000220 |
|
July |
0.000347 |
0.000213 |
8.90E-05 |
0.000162 |
0.000387 |
0.000300 |
0.005562 |
0.000240 |
1.88E-05 |
0.000106 |
0.000509 |
0.000202 |
|
August |
0.000331 |
0.000138 |
8.96E-05 |
0.000189 |
0.000385 |
0.000257 |
0.003639 |
0.000235 |
1.49E-05 |
0.000126 |
0.000229 |
0.000159 |
|
September |
0.000308 |
0.000154 |
8.14E-05 |
0.000180 |
0.000381 |
0.000269 |
0.031891 |
0.000224 |
2.92E-05 |
0.000141 |
0.000233 |
0.000227 |
|
October |
0.000224 |
0.000194 |
9.41E-05 |
0.000136 |
0.000413 |
0.000272 |
0.021422 |
0.000257 |
1.54E-05 |
0.000113 |
0.000334 |
0.000190 |
|
November |
0.000247 |
0.000163 |
9.41E-05 |
0.000186 |
0.000360 |
0.000337 |
0.027270 |
0.000192 |
4.00E-05 |
0.000147 |
0.000390 |
0.000195 |
|
December |
0.000236 |
0.000182 |
7.99E-05 |
0.000150 |
0.000329 |
0.000198 |
0.068732 |
0.000225 |
3.04E-05 |
8.62E-05 |
0.000410 |
0.000140 |
|
ω |
2.91E-07 |
1.89E-07 |
1.60E-08 |
2.05E-07 |
1.34E-07 |
2.90E-07 |
7.66E-05 |
5.95E-08 |
1.29E-09 |
8.61E-08 |
6.18E-07 |
1.82E-08 |
|
α |
0.027479 |
0.038815 |
0.015251 |
0.024934 |
0.007938 |
0.024939 |
0.034511 |
0.006259 |
0.018873 |
0.035038 |
0.094134 |
0.008326 |
|
β |
0.037456 |
0.007246 |
0.013323 |
0.041804 |
0.010943 |
0.028830 |
0.094991 |
0.008242 |
0.005619 |
0.032458 |
0.024495 |
0.005171 |
|
γ |
0.036580 |
0.153592 |
0.016382 |
0.029031 |
0.016265 |
0.031984 |
0.094841 |
0.012045 |
0.031974 |
0.040355 |
0.118251 |
0.008866 |
|
Covid-19 period |
||||||||||||
|
January |
0.000535 |
0.000731 |
0.000265 |
0.000373 |
0.000839 |
0.000499 |
0.000150 |
0.000580 |
0.000375 |
0.000252 |
0.000664 |
8.40E-05 |
|
February |
0.000399 |
0.000738 |
0.000213 |
0.000379 |
0.002453 |
0.000410 |
0.000144 |
0.000840 |
0.000355 |
0.000252 |
0.000437 |
0.000133 |
|
March |
0.000463 |
0.000532 |
0.000188 |
0.000519 |
0.001079 |
0.000327 |
2.11E-05 |
0.000680 |
0.000232 |
0.000210 |
0.000455 |
0.000103 |
|
April |
0.000483 |
0.000521 |
0.000269 |
0.000635 |
0.001180 |
0.000517 |
4.29E-05 |
0.000885 |
0.000475 |
0.000183 |
0.000876 |
9.30E-05 |
|
May |
0.000229 |
0.000580 |
0.000245 |
0.000314 |
0.000780 |
0.000657 |
0.000118 |
0.000770 |
0.000267 |
0.000239 |
0.000512 |
0.000166 |
|
June |
0.000452 |
0.000709 |
0.000422 |
0.000350 |
0.000796 |
0.000291 |
4.77E-05 |
0.000604 |
0.000280 |
0.000271 |
0.000362 |
0.000173 |
|
July |
0.000448 |
0.000520 |
0.000360 |
0.000429 |
0.000988 |
0.000436 |
2.73E-05 |
0.000608 |
0.000253 |
0.000179 |
0.000737 |
0.000237 |
|
August |
0.000398 |
0.000663 |
0.000291 |
0.000340 |
0.001076 |
0.000589 |
2.50E-05 |
0.000671 |
0.000442 |
0.000211 |
0.000403 |
0.000253 |
|
September |
0.000460 |
0.000587 |
0.000223 |
0.000371 |
0.000949 |
0.000508 |
2.77E-05 |
0.000557 |
0.000335 |
0.000187 |
0.000624 |
0.000284 |
|
October |
0.000377 |
0.000622 |
0.000344 |
0.000259 |
0.001145 |
0.000649 |
5.98E-05 |
0.000608 |
0.000350 |
0.000294 |
0.000674 |
0.000147 |
|
November |
0.000504 |
0.000596 |
0.000215 |
0.000283 |
0.000694 |
0.000601 |
2.52E-05 |
0.000608 |
0.000404 |
0.000235 |
0.000427 |
9.77E-05 |
|
December |
0.000398 |
0.000720 |
0.000299 |
0.000405 |
0.001011 |
0.000358 |
1.97E-05 |
0.000860 |
0.000359 |
0.000177 |
0.000466 |
0.000673 |
|
ω |
4.13E-07 |
7.16E-07 |
1.39E-07 |
1.40E-07 |
2.87E-06 |
6.21E-07 |
9.50E-10 |
3.54E-07 |
1.89E-07 |
1.47E-07 |
4.62E-07 |
2.71E-09 |
|
α |
0.101788 |
0.078744 |
0.127801 |
0.042151 |
0.094313 |
0.147992 |
0.060393 |
0.020929 |
0.042097 |
0.128397 |
0.054107 |
0.028266 |
|
β |
0.076751 |
0.076855 |
0.031986 |
0.031569 |
0.044286 |
0.069893 |
0.010685 |
0.028766 |
0.044830 |
0.072061 |
0.048651 |
0.011922 |
|
γ |
0.097072 |
0.082440 |
0.162654 |
0.043094 |
0.366436 |
0.153828 |
0.099706 |
0.046605 |
0.086117 |
0.150886 |
0.077462 |
0.035695 |
Figure A1
Series Evolution of Prices: Pre-Covid-19 and Covid-19 Period
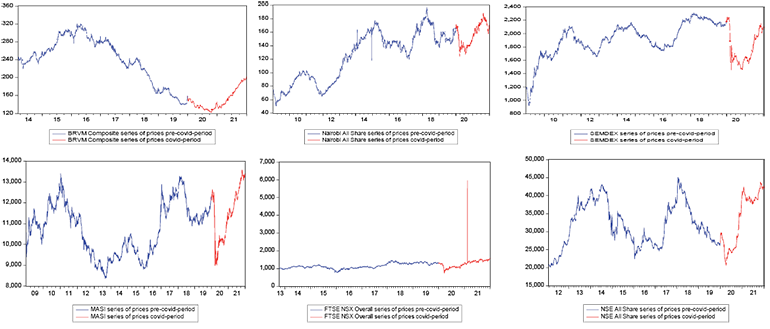
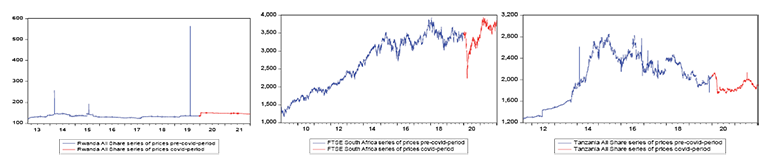
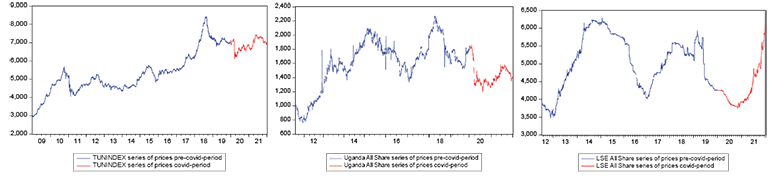
Figure A2
Series Evolution of Returns: Pre-Covid-19 and Covid-19 Period