Organizations and Markets in Emerging Economies ISSN 2029-4581 eISSN 2345-0037
2025, vol. 16, no. 2(33), pp. 289–307 DOI: https://doi.org/10.15388/omee.2025.16.12
The Impact of Corruption and Financial Inclusion Interaction on Poverty in Africa’s Most Unbanked Nations
Musa Abdullahi Sakanko (corresponding author)
Federal University of Technology, Minna, Nigeria
sakanko2015@gmail.com
https://orcid.org/0000-0002-5203-5462
https://ror.org/0568y3j03
Nurudeen Abu
Baba-Ahmed University, Kano, Nigeria
abu.nurudeen@yahoo.com
https://orcid.org/0000-0002-9843-977X
Awadh Ahmed Mohammed Gamal
Sultan Idris Education University, Malaysia
awadh.gamal@fpe.upsi.edu.my
https://orcid.org/0000-0002-8529-951X
https://ror.org/005bjd415
Salimatu Rufai Mohammed
Air Force Institute of Technology, Kaduna, Nigeria
salimatu08035946606@gmail.com
https://ror.org/001szvq52
Abstract. Financial inclusion (FI) has been widely advocated as a means of improving poor economic possibilities, smoothing investments and savings, and providing a safety net against economic shocks. Despite the empirical evidence supporting the benefits of FI on poverty reduction, less attention has been paid to the role of control of corruption (CRR) on FI and poverty nexus. We evaluate the influence of CRR on the FI–poverty relation in Africa’s most unbanked nations (i.e. Egypt, Kenya, Morocco, Nigeria, and South Africa) from 2004 to 2022. Using panel regressions such as DOLS and FMOLS estimators, the results portray that FI is more effective in reducing poverty at greater CRR, whereas FI has the opposite effect at the least CRR. Other core drivers of poverty include GDP per capita growth, inflation, and money supply. The coefficients of the variables of interest (i.e. financial inclusion, control of corruption, and their interaction) show consistency in terms of size, signs, and significance, suggesting robustness in the results. Thus, Africa’s governments and relevant authorities are advised to control corruption to ensure effective poverty reduction impact of financial inclusion. This will guarantee that intended groups receive the benefits of financial inclusion, leading to poverty reduction.
Keywords: financial inclusion, poverty, corruption, Africa
Received: 24/12/2024. Accepted: 20/8/2025
Copyright © 2025 Musa Abdullahi Sakanko, Nurudeen Abu, Awadh Ahmed Mohammed Gamal, Salimatu Rufai Mohammed. Published by Vilnius University Press. This is an Open Access article distributed under the terms of the Creative Commons Attribution Licence, which permits unrestricted use, distribution, and reproduction in any medium, provided the original author and source are credited.
1. Introduction
Financial inclusion (FI) refers to the provision and accessibility of financial services and/or products to individuals who are frequently overlooked or underserved by traditional banking and financial systems (World Bank, 2020). It is based on the premise that everyone, regardless of his/her financial status, gender, or geographic location, has access to financial services that are both accessible and appropriate for their needs (Abu et al., 2022). FI strives to empower the disadvantaged population via the provision of affordable financial services, encouraging economic participation and breaking the cycle of poverty (Li, 2018). Other benefits of FI include increasing individuals’ capacity to own businesses and invest, raising households’ access to education and healthcare, and enabling farmers to sell their produce directly to buyers, to mention a few. These result in reduced transaction costs, more job creation, and high income and wealth necessary to escaping poverty (Sakanko, 2020; Anga et al., 2021; Sharma & Changkakati, 2022; Nasution et al., 2023).
African countries have made considerable progress towards FI. For instance, Kenya is a global leader, with its mobile money network (M-Pesa) that has allowed millions of people increased access to financial services thus raising inclusion from 26.7% in 2006 to 82.9% in 2019 (Central Bank of Kenya, 2021). Nigeria’s agent banking and mobile money programmes boosted access from 46.3% in 2016 to 63.2% in 2020 (EFInA, 2021). South Africa expanded banking services to underserved areas, raising access from 63% in 2004 to 85% in 2019 (South African Reserve Bank, 2020). Morocco’s digital financial services and national plans enhanced account access from 32% in 2011 to 63% in 2018 (World Bank, 2020), while Egypt’s national policy and digital payment initiatives pushed access from 14% in 2011 to 33% in 2018 (World Bank, 2020).
Despite tremendous efforts in promoting FI, the nations mentioned above are still home to many unbanked persons (i.e. individuals who do not have access to or use formal financial services such as bank accounts, credit, or savings products). For example, 67% of Egypt’s population is unbanked, 44% in Kenya, 71% in Morocco, 60% in Nigeria, and 31% in South Africa (Global Finance, 2021). Besides, the African continent hosts some of the world’s poorest nations and individuals, with poverty rates above other regions (United Nations, 2021). Many individuals lack necessities, including food, healthcare, and education, and they face obstacles like political unrest, inflation, unemployment, armed conflicts, corruption, and economic downturns. For instance, 2.3% of Egyptians in 2019 and 1.3% Moroccans in 2020 lived in extreme poverty (Christensen, 2022). The poverty rate was 36.1% for Kenya (KNBS, 2019), 40% for Nigeria (NBS, 2019), and 55.5% for South Africa (Statistics South Africa, 2021). Some factors slowing down poverty reduction and economic development include population growth, housing challenges, corruption, conflict, religion, and insecurity (Abu et al., 2015a; Sakanko, 2018; Sakanko & David, 2018).
Historically, most poor persons have been excluded from the formal financial system, with no access to banking, insurance, or borrowing facilities, and this limits their capacity to save, manage risks, and invest in their future (Bakari et al., 2019; Sakanko et al., 2020; Tabash et al., 2024). The marginalization in turn increases the demand for exploitative informal financial services (Andrian et al., 2021).
Apart from the inclusion problem, corruption remains a serious challenge in African countries (Abu et al., 2015a, 2015b; Abu & Staniewski, 2019; 2022). Corruption in various forms like bribery, extortion, embezzlement, and nepotism have been reported over time in Egypt, Kenya, Morocco, Nigeria and South Africa (World Bank, 2020a; Corruption Watch, 2022).
An important question is the extent to which corruption in these nations influences the FI and poverty nexus. The World Bank (2020a) suggested that a nation’s corruption can impact FI and poverty reduction efforts. Less corruption control erodes funds voted for FI programmes (e.g., microfinance institutions) and limits available resources, hence failing of such programmes (Erum & Hussain, 2019; Kebede et al., 2023; Rashid & Aftab, 2023). Besides, extortion and bribery (acts of corruption) do not only lower the access of the poor to financial services, they also lessen the effectiveness of FI programmes, leading to poverty elevation (Azim, 2017; Lassoued, 2021). Moreover, corruption promotes people’s preference for informal over formal financial institutions due to confidence and trust erosion, thus reducing individual’s access to adequate resources and impeding the effectiveness of poverty reduction measures (Tonkiss, 2009; Ahmed & Ali, 2010; Gillanders & Parviainen, 2018; Aracil & Gonzalo, 2022).
The foregoing portrays that FI programmes can turn out counterproductive if corrupt public officials divert resources voted to boost inclusion in highly corrupt nations. No doubt, efforts have gone into researching FI–poverty nexus in both developed and developing nations (Bakari et al., 2019; Andrian et al., 2021; Abu et al., 2022; Dogan et al., 2022; Khan et al., 2022). However, the influence of corruption on this relationship has largely been disregarded.
Investigating how corruption influences the FI and poverty link in these nations is critical to understanding and improving their poverty reduction policies. Our research adds to the literature by exploring the influence of corruption control on the FI–poverty relation. We show how corruption inhibits FI and slows down poverty reduction, which was previously overlooked in this group (i.e. Egypt, Kenya, Morocco, Nigeria, and South Africa). In addition, we develop an FI index and utilize DOLS and FMOLS estimators in the data analysis. Our findings show that less corruption control undermines the benefits of FI, while greater corruption control allows FI to reduce poverty.
Following the introduction, Section 2 presents the literature review, and Section 3 addresses the methodology. Section 4 discusses the results, while Section 5 concludes the study.
2. Literature Review
2.1 Theoretical Framework
McKinnon (1973) and Shaw (1973) suggested that financial liberalization promotes FI, which in turn lessens poverty incidence. Beck et al. (2000) extended this assertion by advancing that financial development broadens the range, quality, and size of financial services, thus showing a strong connection between financial development and FI. Financial development enables individuals to save and invest, and prepare them for the future (Demirgüç-Kunt & Klapper, 2013). The access to financial services shields individuals or households against economic shocks and lowers their dependency on high-interest loans, including providing them with insurance products to reduce the risks of emergencies (Dogan et al., 2022; Baba et al., 2023). Thus, increased access to financial services or products raises individuals’ and firms’ capacity in participating in economic activities and generating incomes, all of which result in poverty reduction.
Besides, corruption may impact FI and poverty relation. Corruption (in a form of bribery, embezzlement, abuse of power, fraud, money laundering, and nepotism) erodes institutional confidence and integrity, distorts economic and political processes, raises social inequality, and lowers public services (Ahmad & Ali, 2010; Erum & Hussain, 2019). In addition, corruption hinders the attainment of sustainable development, impedes FI and efforts to eradicate poverty (Azim et al., 2017). Also, high corruption signals weak institutional quality (Shleifer & Vishny, 1998; Collier, 2002), and encourages informality, thus limiting access to formal financial services (Straub, 2005; Demirgüç-Kunt et al., 2008). Moreover, corruption discourages entrepreneurial investment and development because of credibility concerns (Roe & Siegel, 2011), which in turn worsens poverty in the face of FI efforts. Thus, high corruption can impair FI’s effectiveness in lowering poverty. Based on the discussion, we formulate the following hypothesis:
H0: Greater control of corruption increases the effectiveness of FI in reducing poverty.
2.2. Empirical Literature
The literature indicates that considerable efforts have gone into exploring FI–poverty connection (Bakari et al., 2019; Andrian et al., 2021; Abu et al., 2022; Dogan et al., 2022; Khan et al., 2022; Tabash et al., 2024). However, the influence of corruption in this relation is less understood. Yet few studies have explored the institutional quality–financial inclusion–poverty nexus (Yiadom et al., 2021; Aracil & Gonzalo, 2022; Appiah-Otoo et al., 2023; Kumar & Jie, 2023; Nsiah & Tweneboah, 2024; Senou & Houensou, 2024).
Besides, prior studies established contradictory findings on poverty relation with inflation rate, money supply, GDP per capita or income, and agricultural output. For instance, Gyeke-Dako et al. (2022) and Nsiah and Tweneboah (2024) confirmed that increased inflation reduces poverty, while Yolanda (2017) and Hassan et al. (2016) found enlarged inflation to worsen poverty. Furthermore, Goshit and Longduut (2016) discovered that increasing money supply positively influences poverty reduction, whereas Anjande et al. (2022) and Amaliah et al. (2021) did not find this effect. Moreover, Barak (2022) reported a negative influence of GDP per capita on poverty in BRICS countries, but Sinaga (2020) uncovered an insignificant influence in Indonesia. Elsewhere, Zeng et al. (2021) reported that improved agricultural output reduces poverty rate, while Maulu et al. (2021) documented that agricultural extension in rural areas has a strong reducing influence on poverty rate. Table 1 summarizes related studies.
Table 1
Summary of Empirical and Related Studies
|
Author(s) |
Country(ies) |
Method(s) |
Findings |
|---|---|---|---|
|
FI–institutional quality–poverty |
|||
|
Nsiah and Tweneboah (2024) |
African countries |
Hansen threshold regression |
FI reduces poverty when the institutional quality index is below -1.63%. |
|
Appiah-Otoo et al. (2023) |
16 West African countries |
Hansen threshold regression |
Institutional quality has respective thresholds at which financial development reduces poverty. |
|
Kumar and Jie (2023) |
Developing countries |
Two-stage Fixed-Effects and conditional methods |
Institutional quality improves FI’s impact on poverty reduction. |
|
Aracil and Gonzalo (2022) |
75 developing and developed countries |
OLS and quantile regression |
Institutional quality intensifies the advantageous impacts of FI on poverty reduction, and the relation is more noticeable in poorer countries than in advanced ones. |
|
Yiadom et al. (2021) |
42 African countries |
Dynamic panel regression |
FI lessens poverty in countries with strong institutions. |
|
Inflation and poverty |
|||
|
Nsiah and Tweneboah (2024) |
African countries |
Hansen threshold regression |
Inflation considerably contributes to poverty reduction. |
|
Rizki and Solihati (2022) |
Indonesia |
Multiple regression |
Both inflation and corruption have a significant impact on poverty rate. |
|
Gyeke-Dako et al. (2022) |
44 Sub-Saharan African countries |
Chi-square and pairwise correlations |
Reducing inflation lessens poverty in countries with independent central banks. |
|
Junaidin and Muniarty (2020) |
Bima City |
Linear regression |
Inflation has an insignificant effect on poverty. |
|
Meo et al. (2018) |
Pakistan |
Non-linear ARDL |
Inflation has a non-linear influence on poverty. |
|
Yolanda (2017) |
Indonesia |
Multiple regression analysis |
Inflation contributes to poverty rate. |
|
Hassan et al. (2016) |
Pakistan |
ARDL |
Inflation worsens poverty rate. |
|
Siyan et al. (2016) |
Nigeria |
Vector Autoregression and Granger Causality |
There is a bidirectional causal relation between inflation and poverty. |
|
Money supply and poverty |
|||
|
Anjande et al. (2022) |
48 Sub-Saharan African countries |
One-step and two-step system GMM |
Money supply significantly increases poverty rate. |
|
Amaliah et al. (2021) |
Indonesia |
Two Stage Least Squares |
Monetary policy (money supply and inflation) increases poverty rate. |
|
Saeed (2020) |
Pakistan |
Linear regression |
Money supply does not have poverty reduction effect. |
|
Goshit and Longduut (2016) |
Nigeria |
Ordinary Least Squares |
Money supply is a significant determinant of poverty reduction. |
|
Per capita income and poverty |
|||
|
Barak (2022) |
BRICS countries |
Panel ARDL |
Per capita income substantially reduces poverty. |
|
Sinaga (2020) |
Indonesia |
Multiple linear regression |
Per capita income has an insignificant negative impact on poverty. |
|
Janjua and Kamal (2011) |
40 developing countries |
Generalized Least Squares |
Increase in income has a moderate positive effect on poverty alleviation. |
|
Agricultural output and poverty |
|||
|
Zeng et al. (2021) |
China |
Vector Autoregression |
Agricultural output significantly reduces poverty. |
|
Maulu et al. (2021) |
Zambia |
Thematic method |
Rural agricultural programmes provide poverty reduction effect. |
|
Hayat et al. (2019) |
Pakistan |
Ordinary Least Squares |
Agricultural growth significantly affects poverty rate. |
|
Christiaensen et al. (2011) |
SSA countries |
Panel regression |
Agriculture is effective in reducing poverty. |
It is evident that previous research did not directly address corruption’s role in the FI–poverty link, but instead focused on the influence of institutional quality. Institutional quality refers to the strength and effectiveness of government, regulatory agencies, legal systems, and other public institutions, which encompass aspects including rule of law, accountability, transparency, and property rights protection (Bjørnskov, 2011). However, corruption frequently signals inadequate (or poor) institutional quality (Collier, 2002; Ndikumana, 2006). Moreover, fragile institutions are not always associated with high corruption (Asongu, 2013). Research on how corruption influences FI and its implications for poverty alleviation remains scarce. Hence, this study’s main goal is to address this gap by exploring the impact of corruption on the FI–poverty connection.
3. Methodology
3.1 The Model
In building the model that captures how corruption influences FI–poverty nexus in Africa’s most unbanked nations, this research relies on the ideas of Azim et al. (2017) and Appiah-Otoo et al. (2023). The authors suggested that greater institutional quality enhances financial development (a booster of FI) and poverty connection, and vice versa. For example, countries with greater corruption control derive benefits associated with FI, leading to declines in poverty rate. However, the gains associated with FI are eroded in economies with less corruption control. Thus, the econometric connection between FI and poverty, including corruption control, is specified in Equation 1 and Equation 2 as:
 (1)
(1)
 (2)
(2)
where i = 1, 2, 3, 4 …, N is the number of countries (i.e. Egypt, Kenya, Morocco, Nigeria, and South Africa), and t = 1, 2, 3, 4 … is time (T); POV = poverty, FI denotes financial inclusion accessibility and usage of affordable financial services, such as savings, credit, and insurance by individuals and businesses, particularly the underserved population. CRR represents control of corruption – the extent to which public power is exercised for private gain, including both petty and grand forms of corruption, as well as the effectiveness of mechanisms to prevent and penalize corrupt practices. The interaction term CRR*FI captures how the impact of financial inclusion on poverty (POV) is conditioned upon corruption control. W is a set of control variables: GDPC = GDP per capita (average income); INFL = inflation rate (macroeconomic stability); MS = money supply (liquidity and monetary conditions); and AGOT = agricultural output (contribution of agriculture to overall economic activity).). μi = unobserved country-specific effect, and ηt = time-specific effect. εit = error term, whereas α1, α2, α3, and 𝜑, are the coefficients. POV is the mean shortfall in income/consumption from the poverty line of $2.15 a day (counting the non-poor as having zero shortfall), expressed as a percentage of the poverty line. This measure reflects the depth of poverty and its incidence. We expect less corruption control to reduce FI and escalate poverty rate, while greater corruption control should improve FI and lessen poverty.
Using CRR * FI, the impact of financial inclusion on poverty at varying corruption control is calculated via the partial derivative of Model 2 with respect to FI as:
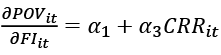 (3)
(3)
3.2 Data
We use yearly data for the 2004–2022 period for Egypt, Kenya, Morocco, Nigeria, and South Africa. The choice of the group is due to their large unbanked populations and low control of corruption, including data availability. Data on poverty (% of poverty gap at $2.15 a day), GDP per capita growth (GDP per capita growth annual %), inflation rate (inflation, consumer prices annual %), money supply (broad money % of GDP), and agricultural output (agriculture, forestry, and fishing, value added % of GDP) were sourced from World Development Indicators database. Following the Nguyen (2020) and Sakanko et al. (2024) approach, FI is captured by a composite index developed using the PCA (i.e. Principal Component Analysis), which is based on three G20 indicators: access, utilisation, and financial services quality. The World Governance Indicators database provides the control of corruption, which ranges from -2.5 (least corruption control) to 2.5 (highest corruption control).
3.3 Estimation Technique
A notable characteristic of time-series cross-sectional (TSCS) data is their exhibition of contemporaneous correlations (i.e. auto-correlated errors) and heteroscedasticity (Beck & Katz, 1995). Hence, inferences based on standard errors generated using OLS can be misleading. Moreover, it is suggested that panels with small cross-sectional units (N) and relatively large period (T), and co-integrated are better analyzed using the Mark and Sul (2003) and Kao and Chiang (2000) panel Dynamic Ordinary Least Squares (DOLS) and Fully Modified Ordinary Least Squares (FMOLS) methods (Yahyaoui & Bouchoucha, 2021).
The advantages of FMOLS include addressing potential endogeneity in the OLS (Lustrilanang et al., 2023), and correcting any serial-correlation. In addition, the DOLS (an alternative single-equation estimator) accommodates a mixture of integrated variables within a co-integrated framework (Yahyaoui & Bouchoucha, 2021). The DOLS also addresses potential endogeneity and small-sample bias problems (Lustrilanang et al., 2023), while co-integrating vectors obtained from DOLS are asymptotically efficient (Olorogun, 2024). Using these estimators result in generating consistent and efficient long-term estimates in small and/or heterogeneous panels.
4. Empirical Results and Discussion
Prior to estimating the poverty model, correlation analysis and summary statistics were conducted. The summary statistics (Table 2) show the average poverty (POV) is 18.51% with significant variance across the sample (i.e. a standard deviation of 14.732), with highest and least values of 38.2% and -2.2%, respectively. Financial inclusion (FI) has a relatively low average value of 3.14, a moderate spread (standard deviation of 0.916), and uppermost and lowest values of 1.542 and -2.238, respectively. The corruption control (CRR) has a mean of -0.603, with a standard deviation of 0.434 and maximum and least values of 0.484 and -1.383, respectively.
Table 2
Results of Correlation Analysis and Summary Statistics
|
Summary statistics |
|||||||
|
POV |
FI |
CRR |
GDPC |
INFL |
MS |
AGOT |
|
|
Obs. |
95 |
95 |
95 |
95 |
95 |
95 |
95 |
|
Mean |
18.510 |
3.14 |
-0.603 |
1.903 |
7.887 |
63.623 |
13.858 |
|
Std.Dev. |
14.732 |
0.916 |
0.434 |
2.589 |
5.587 |
31.562 |
7.584 |
|
MIN |
-2.2 |
-2.238 |
-1.383 |
-8.173 |
-0.692 |
11.301 |
1.927 |
|
Max |
38.2 |
1.542 |
0.484 |
6.790 |
29.507 |
128.863 |
27.231 |
|
Correlation analysis |
|||||||
|
POV |
1.000 |
||||||
|
FI |
-0.229 |
1.000 |
|||||
|
CRR |
-0.441 |
-0.381 |
1.000 |
||||
|
GDPC |
-0.014 |
0.221 |
-0.069 |
1.000 |
|||
|
INFL |
0.296 |
-0.090 |
-0.542 |
-0.046 |
1.000 |
||
|
MS |
-0.919 |
0.237 |
0.625 |
-0.009 |
-0.471 |
1.000 |
|
|
AGOT |
0.495 |
0.476 |
-0.920 |
0.143 |
0.466 |
-0.626 |
1.000 |
Note. Computation from STATA 18 (2024).
Furthermore, the mean income per capita (GDPC) is 1.903, with a substantial standard deviation of 2.589, indicating major income disparity, while the greatest and minimum values stand at 6.790 and -8.173, respectively. The inflation rate (INFL) is an average of 7.887%, with a wide range from negative values to very high inflation rates of 5.587, while the least and maximum values are -0.692 and 29.507, respectively. The average money supply (MS) and agricultural output (AGOT) are 63.623 and 13.858, respectively, with significant and moderate standard deviations of (31.562) and (7.584), respectively. The lowest and maximum MS are 11.301 and 128.863, while least and maximum AGOT are 1.927 and 27.231, respectively.
Correlation analysis was conducted to better understand the relationship and potential causality between the variables. The results (Table 2) show that POV is negatively connected to FI (-0.229), CRR (-0.441), and MS (-0.919), but positively correlated with INFL (0.296) and AGOT (0.495). FI is negatively connected to CRR (-0.381) and INFL (-0.090), but positively correlated with GDPC (0.221), MS (0.237), and AGOT (0.476). CRR is negatively linked to INFL (-0.542) and AGOT (-0.920), but positively associated with MS (0.625). Also, INFL is negatively connected to MS (-0.471) and positively linked to AGOT (0.466), while MS is connected negatively to AGOT (-0.626). Moreover, GDPC is positively correlated to FI (0.221) and AGOT (0.143), but negatively associated to INFL (-0.046). AGOT shows positive correlation with FI (0.476), INFL (0.466), and POV (0.495), but negative association with CRR (-0.920) and MS (-0.626).
The unit root test was conducted using the Levin-Lin-Chu (LLC) test, a first-generation panel unit root test that assumes cross-sectional independence. The results (Table 3) show a mixed order of integration, with some variables stationary at level (I(0)) and others at first difference (I(1)). Specifically, POV exhibited non-stationarity (NS) at I(0), but became stationary after first differencing (i.e. I(1)). Other variables including FI, CRR, GDPC, INFL, MS, and AGOT are both I(0) and I(1), hence, the need for a cointegration test.
Table 3
Levin-Lin-Chu Unit Root Test Results
|
Level |
Remark |
1st Diff. |
Remark |
|
|
POV |
-0.696 |
NS |
-3.454** |
I(1) |
|
FI |
-4.217** |
I(0) |
-5.818*** |
I(1) |
|
CRR |
-4.788*** |
I(0) |
-8.540*** |
I(1) |
|
GDPC |
-5.437*** |
I(0) |
-9.581*** |
I(1) |
|
INFL |
-6.933*** |
I(0) |
-8.887*** |
I(1) |
|
MS |
-5.680*** |
I(0) |
-7.527*** |
I(1) |
|
AGOT |
-4.487*** |
I(0) |
-8.862*** |
I(1) |
Note. Computation from STATA 18 (2024). ** and *** denote statistical significance at 5% and 1% levels, respectively.
Table 4 shows the second-generation Pedroni and Westerlund cointegration test results. The Modified Phillips-Perron and Variance Ratio tests both reject the H0 (i.e. null hypothesis) at 1% level, indicating that the variables are co-integrated during the long-term.
Table 4
Pedroni and Westerlund Co-integration Test Results
|
Test Statistic |
Value |
Prob. |
H0: No cointegration |
|
Modified Phillips-Perron |
3.686*** |
0.0001 |
Rejected at 1% |
|
Phillips-Perron |
1.839** |
0.033 |
Rejected at 5% |
|
Augmented Dickey-Fuller |
1.572* |
0.058 |
Rejected at 10% |
|
Variance Ratio |
5.037*** |
0.000 |
Rejected at 1% |
Note. Computation from STATA 18 (2024). *,**, and *** denote statistical significance at 10%, 5% and 1% levels, respectively.
In addition, the Phillips-Perron test rejects the H0 at 5% level, and the Augmented Dickey-Fuller test at 10% level, signifying evidence of co-integration.
Table 5
Results of DOLS and FMOLS Estimation (Dependent Variable = POV)
|
Regressor |
DOLS |
FMOLS |
||||
|
Coeff. |
Std. Err |
t-stat. |
Coeff. |
Std. Err |
t-stat |
|
|
FI |
-17.69*** |
2.05 |
-8.61 |
-16.66*** |
1.66 |
-10.05 |
|
CRR |
7.13* |
3.32 |
2.15 |
6.96*** |
2.12 |
3.28 |
|
CRR*FI |
-21.74*** |
3.47 |
-6.26 |
-22.02*** |
3.13 |
-7.03 |
|
GDPC |
-0.62 |
0.61 |
-1.01 |
-1.02** |
0.41 |
-2.48 |
|
INFL |
-0.79** |
0.32 |
-2.48 |
-0.75*** |
0.24 |
-3.18 |
|
MS |
-0.06*** |
0.02 |
-2.65 |
-0.08*** |
0.02 |
-3.69 |
|
AGOT |
1.71*** |
0.39 |
4.41 |
1.69*** |
0.35 |
4.84 |
|
Marginal Effect (Min/Max) |
12.38/-28.21 |
13.80/-27.32 |
||||
Note. Computation from STATA 18 (2024). *,**, and *** denote statistical significance at 10%, 5% and 1% levels, respectively.
The results generated via FMOLS and DOLS estimators (Table 5) show that FI is significant in reducing poverty. A unit increase in FI reduces poverty by 17.69% and 16.67%, respectively, at the 1% level. The outcome suggests that greater FI increases disadvantaged populations’ access to financial services and boosts their capacity to engage in economic activities, owning businesses, or investing in income-generating assets. Consequently, more job opportunities and wealth are created, making it easy for households to afford basic necessities, including health and educational services, leading to poverty reduction. However, CRR influences poverty positively. An improvement in CRR by a unit raises poverty by 7.13% and 6.96%, at 10% level and 1% level, respectively. The supportive role of corruption control on poverty can be viewed as the ‘grease the wheel’ hypothesis of corruption. The finding suggests that less control of corruption raises poverty because corruption serves as a mechanism for by-passing bureaucratic inefficiencies and/or regulatory bottlenecks in nations with weak institutions.
By controlling (or lessening) corruption, businesses and individuals may face delays and greater costs to navigate the formal economy. In addition, inadequate and unequal access to financial services especially by poor individuals due to delays arising from inefficiencies, such as offering bribes (an act of corruption), results in decline in economic activities and exacerbates existing inequalities. This can worsen the financial condition of the poor rather than enhancing it, leading to increased poverty.
The coefficient of CRR*FI demonstrates that under higher corruption control environment, FI considerably reduces poverty at the 1% level. This is calculated using the maximum value (0.484) of CRR, i.e., greater control of corruption  = –17.69 – 21.74(0.484) = –28.21 in the DOLS estimates. Thus, a unit increase in FI reduces poverty by 28.209%. Similarly, using the maximum value (0.484) of CRR, i.e., greater control of corruption = –16.66 – 22.02(0.484) = –27.32 in the FMOLS estimates. Hence, a unit increase in FI reduces poverty by 27.32%. This implies that in less corrupt nations, FI effectively reaches its intended beneficiaries and lowers poverty. The finding is supported by Nsiah and Tweneboah (2024) that FI reduces poverty at a greater institutional quality.
Contrariwise, using the minimum value (-1.383) of CRR, i.e., less corruption control = –17.69 – 21.74(–1.383) = 12.38 in the DOLS estimates Therefore, raising FI by a unit enhances poverty by 12.38%. Likewise, using the minimum value (–1.383) of CRR, i.e., less corruption control = –16.66 – 22.02(–1.383) = 13.80 in the FMOLS estimates. Thus, a unit increase in FI reduces poverty by 13.80%. This outcome shows that FI efforts can be counterproductive in highly corrupt nations if officials divert resources intended to improving inclusion. Consistent with this outcome are Yiadom et al. (2021) and Kumar and Jie (2023) who confirmed that fragile institutional quality undermines FI initiatives and in turn raises poverty rate.
In addition, high GDPC is associated with poverty alleviation. Poverty decreases by 1.02% for 1% growth in GDPC at the 5% level, highlighting the importance of inclusive economic strategy in reducing poverty in Africa. This corroborates Barak’s (2022) study that income impacts poverty negatively.
Also, rising INFL is negatively related to poverty. A 1% increase in INFL lowers poverty by 0.79% and 0.75%, at 5% level and 1% level, respectively. Given that Africa is predominantly an agrarian region, certain economic sectors may gain more from inflation than others. For example, if the prices of agricultural produce rise, the incomes of rural inhabitants and farmers will increase leading to a reduction in poverty. Additionally, moderate inflation can reduce the real burden of nominal debts, allowing low-income individuals and small businesses to repay loans more easily, thus freeing up income for consumption and investment and hence contributing to poverty and unemployment reduction. This aligns with the Phillips curve argument, which suggests a short-run trade-off between inflation and unemployment, implying that moderate inflation may be associated with increased employment and income. The same outcome was established by Gyeke-Dako et al. (2022) and Nsiah and Tweneboah (2024).
Furthermore, increased MS has a strong reducing impact on poverty. A 1% increase in MS reduces poverty by 0.06% and 0.08%, respectively, at the 1% level. A rising money supply can boost economic activity by lowering interest rates and making lending more accessible. This in turn boosts investment, job creation, economic growth and income, hence reducing poverty. Besides, as the money supply expands, firms and consumers spend more, increasing demand for products and services. Consequently, output increases alongside employment opportunities and consumption, resulting in poverty reduction. The finding supports the results of Goshit and Longduut (2016), who established that money expansion influences poverty negatively.
Furthermore, AGOT affects poverty positively. A 1% increase in AGOT causes poverty to increase by 1.71% and 1.69%, respectively, at the 1% level. The finding contradicts the outcome of prior studies (Christiaensen et al., 2011). The positive influence of AGOT on poverty can be attributed to low agricultural value added in African countries, where a large proportion of farmers produce primarily for consumption rather than the market. This inhibits the sector’s potential to generate substantial income required to reduce poverty.
5. Conclusion
The study examines how corruption affects the financial inclusion–poverty nexus in Africa’s most unbanked countries from 2004 to 2022, utilizing DOLS and FMOLS estimators. The findings based on cointegration test indicate that financial inclusion and poverty (including income growth, inflation, agricultural output, and money supply) have a long-run relation. The results reveal that the influence of financial inclusion on poverty depends on corruption control. Financial inclusion significantly reduces poverty, and its effectiveness is dependent on the control of corruption. In countries with better corruption control, financial inclusion has a greater impact on reducing poverty. In contrast, in nations with weaker corruption control, the poverty-reducing benefits of financial inclusion significantly diminish.
Furthermore, GDP per capita growth, inflation, and money supply have significant negative impacts on poverty, while agricultural output appears not to contribute to poverty reduction. The consistent signs, magnitudes, and significance levels of the coefficients of financial inclusion and control of corruption (including their interaction) in both estimates provide strong support for the robustness of the results.
In sum, the study highlights the critical role of corruption control in enhancing the effectiveness of financial inclusion policies. Thus, to ensure that financial inclusion is effective in reducing poverty in Africa, policymakers are advised to employ policies that reduce corruption. These can be achieved through strengthening accountability, transparency, and governance structures. Consequently, intended beneficiaries will receive the needed resources to fully benefit from financial inclusion programmes. Greater financial inclusion will raise individuals’ and businesses’ capacity to engage in economic activities, leading to increased output, more job creation, high incomes, and decline in poverty rate.
A key limitation of this research is that it focuses only on Africa’s most unbanked countries, which may limit the generalizability of the findings to more financially integrated nations. Additionally, the use of secondary data may not fully capture informal financial activities or unreported corruption, potentially understating their true effects. Therefore, future studies can extend their analysis to include a broader set of African countries. Researchers may also explore the role of digital financial services, financial literacy, and institutional quality as mediators in the financial inclusion–poverty nexus. Employing more granular data such as household-level or regional data could offer deeper insights into the mechanisms through which financial inclusion and corruption interact to affect poverty.
References
Abu, N., Karim, M. Z. A., & Aziz, M. I. A. (2015a). Corruption, Political Instability and Economic Development in the Economic Community of West African States (ECOWAS): Is There a Causal Relationship? Contemporary Economics, 9(1), 45–60. https://doi.org/10.5709/ce.1897-9254.159
Abu, N., Karim, M. Z. A., & Aziz, M. I. A. (2015b). Low Savings rates in the Economic Community of West African States (ECOWAS): The Role of Corruption. Journal of Economic Cooperation and Development, 36(2), 63–90.
Abu, N., & Staniewski, M. W. (2019). Determinants of Corruption in Nigeria: Evidence from Various Estimation Techniques. Economic Research-Ekonomska Istraživanja, 32(1), 3052–3076. https://doi.org/10.1080/1331677X.2019.1655467
Abu, N., & Staniewski, M. W. (2022). An Empirical Investigation of the Effect of Corruption on Domestic Savings in Nigeria. Economic Research-Ekonomska Istraživanja, 35(2), 4092–4112. https://doi.org/10.1080/1331677X.2021.201011
Abu, N., Sakanko, M. A. David, J., Gamal, A. A. M., & Obi, B. (2022). Does Financial Inclusion Reduce Poverty in Niger State: Evidence from Logistic Regression Technique. Organizations and Markets Emerging Economies, 13(2), 443–466. https://doi.org/10.15388/omee.2022.13.88
Ahmad, N. & Ali, S. (2010). Corruption and Financial Sector Performance: A Cross-country Analysis. Economics Bulletin, 30(1), 303–308.
Appiah-Otoo, I., Chen, X., Song, N., & Dumor, K. (2022). Financial Development, Institutional Improvement, Poverty Reduction: The Multiple Challenges in West Africa. Journal of Policy Modeling, (6), 1296–1312. https://doi.org/10.1016/j.jpolmod.2022.11.002
Aracil, E., Omez-Bengoechea, G. G., & Moreno-de-Tejada, O. (2022). Institutional Quality and the Financial Inclusion-Poverty Alleviation Link: Empirical Evidence across Countries. Borsa Istanbul Review, 22(1), 179–188, https://doi.org/10.1016/j.bir.2021.03.006
Amaliah, I., Aspiranti, T., Nurhayati, N., Mafruhat, A. Y., Numan, A. H., & Shaharuddin, A. (2021). Macroeconomic Coordination: As an Approach for Poverty Reduction. Polish Journal of Management Studies, 23(2), 42–56.
Andrian, T., Sitorus, N., Febriana, I., & Chandra, S. (2021). Financial Inclusion and its Effect on Poverty in Indonesia. Jurnal Paradigma Ekonomi, 16(1), 97–108. https://doi.org/10.22437/jpe.v16i1.12083
Anga, R. A., Sakanko, M. A., & Abdullahi, M. A. (2021). Modelling the Effect of Financial Inclusion on SMEs in Nigeria. Al-Hikmah Journal of Economics, 2(1), 33–43.
Anjande, G., Asom, S. T., Ayila, N., Mile, B. N., & Ijirshar, V. U. (2022). Government Spending and Money Supply Roles in Alleviating Poverty in Africa. arXiv preprint arXiv:2209.14443.
Asongu, S. A. (2013). Fighting Corruption in Africa: Do Existing Corruption‐control Levels Matter? International Journal of Development Issues, 12(1), 36–52. https://doi.org/10.1108/14468951311322109
Azim, M. I., Sheng, K., & Barut, M. (2017). Combating Corruption in a Microfinance Institution. Managerial Auditing Journal, 32(4/5), 445–462. https://doi.org/10.1108/MAJ-03-2016-1342
Baba, S., Sakanko, M. A., Yahaya, S. U., & Collins, E. O. (2023). Logistic Approach of the Effects of Financial Inclusion on the Livelihood of Smallholder Farmers in Plateau State. GUSAU Journal of Economics and Development Studies, 3(1), 14. https://doi.org/10.57233/gujeds.v3i1.17
Bakari, I., Donga, M., Idi, A., Hedima, J., Wilson, K., Babayo, H., & Ibrahim, Y. (2019). An Examination of the Impact of Financial Inclusion on Poverty Reduction: An Empirical Evidence from Sub-Saharan Africa. International Journal of Scientific and Research Publications, 9(1), 239–252. http://dx.doi.org/10.29322/IJSRP.9.01.2019.p8532
Barak, D. (2022). The Impact of Income Inequality, Renewable Energy Consumption, Non-Renewable Energy Consumption and Per Capita Income on Poverty: Evidence from BRICS Economies. Ekonomika, 101(1), 62–83. https://doi.org/10.15388/Ekon.2022.101.1.4
Beck, N., & Katz, J. N. (1995). What to Do (and Not to Do) with Time-series Cross-section Data. American Political Science Review, 89, 634–647.
Beck, T., Levine, R., & Loayza, N. (2000). Finance and the Sources of Growth. Journal of Financial Economics, 58(1/2), 261–300.
Bjørnskov, C. (2011). Combating Corruption: On the Interplay between Institutional Quality and Social Trust. Journal of Law and Economics, 54(1), 135–159.
Central Bank of Kenya (2021). FinAccess Household Survey. Nairobi Kenya: CBK.
Chinoda, T. (2024). Digital Financial Inclusion and Economic Growth in Sub-Saharan Africa: The Role of Institutions and Governance. African Journal of Economic and Management Studies, 15(1), 15–30. https://doi.org/10.1108/AJEMS-09-2022-0372
Christiaensen, L., Demery, L., & Kuhl, J. (2011). The (Evolving) Role of Agriculture in Poverty Reduction-An Empirical Perspective. Journal of Development Economics, 96(2), 239–254. https://doi.org/10.1016/j.jdeveco.2010.10.006
Christensen, Z. (2022). Economic Poverty Trends: Global, Regional and National. England: Development Initiative.
Collier, M. W. (2002). Explaining corruption: An Institutional Choice Approach. Crime, Law and Social Change, 38(1), 1–32. https://doi.org/10.1023/A:1019802614530.
Corruption Watch. (2022). Accelerating Justice Corruption Watch 22 Annual Report. Retrieved from Corruption-Watch_Report_Final_4April.pdf (corruptionwatch.org.za)
Demirgüç-Kunt, A., & Klapper, L. (2013). Measuring Financial Inclusion: Explaining Variation in Use of Financial Services across and Within Countries. Brookings Papers on Economic Activity, 2013(1), 279–340. https://doi.org/10.1353/eca.2013.0002
Demirgüç-Kunt, A., Levine, R., & Detragiache, E. (2008). Finance and Economic Development: The Role of Government. Policy Working Paper, No. 3955. Washington, DC: World Bank.
Dogan, E., Madaleno, M., & Taskin, D. (2022). Financial Inclusion and Poverty: Evidence from Turkish Household Survey Data. Applied Economics, 54(19), 2135–2147. https://doi.org/10.1080/00036846.2021.1985076
Erum, N., & Hussain, S. (2019). Corruption, Natural Resources and Economic Growth: Evidence from OIC Countries. Resources Policy, 63, 101429. https://doi.org/10.1016/j.resourpol.2019.101429
EFInA (2021). Access to Financial Services in Nigeria 2020 Survey. Retrieved from PowerPoint Presentation (efina.org.ng)
Galli, E., Mascia, D. V., & Rossi, S. P. S. (2017). Does Corruption Affect the Access to Bank Credit for Micro and Small Businesses? Evidence from European MSMEs. In ADBI Working Papers (756, pp.1–23). Asian Development Bank Institute (ADBI).
Gillanders, R., & Parviainen, S. (2018). Corruption and the Shadow Economy at the Regional Level. Review of Development Economics, 22(4), 1729–1743. https://doi.org/10.1111/rode.12517
Global Finance. (2021). World’s Most Unbanked Countries 2021. Washington DC: Global Finance.
Goshit, G. G., & Longduut, T. D. (2016). Indirect Monetary Policy Instruments and Poverty Reduction in Nigeria: An Empirical Evidence from Time Series Data. International Journal of Academic Research in Business and Social Sciences, 6(4), 86–101.
Gyeke-Dako, A., Agbloyor, E. K., Agoba, A. M., Turkson, F., & Abbey, E. (2022). Central Bank Independence, Inflation, and Poverty in Africa. Journal of Emerging Market Finance, 21(2), 211–236. https://doi.org/10.1177/0972652722107
Hassan, M. U., Khalid, M. W., & Kayani, A. S. (2016). Evaluating the Dilemma of Inflation, Poverty and Unemployment. Bulletin of Business and Economics, 5(2), 67–82.
Hayat, U., Ali, S., Mateen, A., & Bilal, H. (2019). The Role of Agriculture in Poverty Alleviation: Empirical Evidence from Pakistan. Sarhad Journal of Agriculture, 35(4), 1309–1315. http://dx.doi.org/10.17582/journal.sja/2019/35.4.1309.1315
Janjua, P. Z., & Kamal, U. A. (2011). The Role of Education and Income in Poverty Alleviation. Lahore Journal of Economics, 16(1), 30. http://121.52.153.179/Volume.html
Junaidin, J., & Muniarty, P. (2020). Influence of Inflation on Poverty in Bima City. Ilomata International Journal of Management, 1(3), 88–92. https://doi.org/10.52728/ijjm.v1i3.119
Kao, C., & Chiang, M.-H. (2001). On the Estimation and Inference of a Cointegrated Regression in Panel Data. In Baltagi, B. H., Fomby, T.B. & Carter Hill, R. (Eds.), Nonstationary Panels, Panel Cointegration, and Dynamic Panels (Advances in Econometrics, Vol. 15, pp. 179–222). Emerald Group Publishing Limited, Leeds. https://doi.org/10.1016/S0731-9053(00)15007-8
Khan, N., Zafar, M., Okunlola, A. F., Zoltan, Z., & Robert, M. (2022). Effects of Financial Inclusion on Economic Growth, Poverty, Sustainability, and Financial Efficiency: Evidence from the G20 Countries. Sustainability, 14(19), 12688.
Kebede, J., Tawiah, V., & Gyapong, E. (2023). The Effect of Corruption on Microfinance Loan Portfolio: A Semiparametric Analysis. Economics of Transition and Institutional Change, 31(1), 241–268. https://doi.org/10.1111/ecot.12332
Kenya National Bureau of Statistics. (2019). Kenya Poverty Reports. Nairobi: KNBS.
Kumar, S. S., & Jie, Q. (2023). Exploring the Role of Financial Inclusion in Poverty Reduction: An Empirical Study. World Development Sustainability, 3, 100103. https://doi.org/10.1016/j.wds.2023.100103
Lassoued, M. (2021). Control of Corruption, Microfinance, and Income Inequality in MENA Countries: Evidence from Panel Data. SN Business & Economics, 1(7), 96–104.
Li, L. (2018). Financial Inclusion and Poverty: The Role of Relative Income. China Economic Review, 52(1), 165–191. https://doi.org/ 10.1016/j.chieco.2018.07.006
Lustrilanang, P., Suwarno, Darusalam, Rizki, L. T., Omar, N., & Said, J. (2023). The Role of Control of Corruption and Quality of Governance in ASEAN: Evidence from DOLS and FMOLS Test. Cogent Business & Management, 10(1), 2154060. https://doi.org/10.1080/23311975.2022.2154060
Mark, N.C., & Sul, D. (2003). Cointegration vector estimation by panel DOLS and long-run money demand. Oxford Bulletin of Economics and Statistics, 65(5), 655–680. https://doi.org/10.1111/j.1468-0084.2003.00066.x
Maulu, S., Hasimuna, O. J., Mutale, B., Mphande, J., & Siankwilimba, E. (2021). Enhancing the Role of Rural Agricultural Extension Programs in Poverty Alleviation: A Review. Cogent Food & Agriculture, 7(1), 1886663. https://doi.org/10.1080/23311932.2021.1886663
Meo, M. S., Khan, V. J., Ibrahim, T. O., Khan, S., Ali, S., & Noor, K. (2018). Asymmetric Impact of Inflation and Unemployment on Poverty in Pakistan: New Evidence from Asymmetric ARDL Cointegration. Asia Pacific Journal of Social Work and Development, 28(4), 295–310. https://doi.org/10.1080/02185385.2018.1523745
McKinnon, R. I. (1973). Money and Capital in Economic Development. Washington, DC: Brookings Institution.
Nasution, L. N., Sari, W. I., & Khairuni, R. (2023). Financial Inclusion and Poverty Alleviation: Does it Work? Studies in Lower-middle Income Countries. World Journal of Advanced Research and Reviews, 19(03), 189–199. https://doi.org/10.30574/wjarr.2023.19.3.1773
Ndikumana, L. (2006). Corruption and Pro-poor Growth Outcomes: Evidence and Lessons for African Countries (University of Massachusetts Amherst, PERI Working Papers, 120).
Nsiah, A. Y., & Tweneboah, G. (2024). Threshold Effect of Financial Inclusion on Poverty Reduction in Africa: Does Institutional Quality Play a Role? Journal of African Business, 1–35.
Nigerian Bureau of Statistics (2019). Poverty and Inequality in Nigeria 2019: Executive Summary. Abuja: NBS.
Nguyen, T. T. H. (2020). Measuring Financial Inclusion: A Composite FI Index for the Developing Countries. Journal of Economics and Development, 23(1), 77–99. https://doi.org/10.1108/JED-03-2020-0027
Olorogun, L. A. (2024). Modelling Financial Development in the Private Sector, FDI, and Sustainable Economic Growth in Sub-Saharan Africa: ARDL Bound Test-FMOLS, DOLS Robust Analysis. Journal of the Knowledge Economy, 15(2), 8416–8434. https://doi.org/10.1007/s13132-023-01224-w
Rashid, A., & Aftab, M. (2023). ESG and Financial Performance of Microfinance Institutions in South and Southeast Asia: Does Financial Development Matter? Journal of Business and Management Research, 2(2), 1053–1073.
Rizki, M., & Solihati, K. D. (2022). The Impact of Corruption, Inflation and Unemployment Towards Poverty in Indonesia. Journal of Business Administration Economics & Entrepreneurship, 4(1), 47–56.
Roe, M. J., & Siegel, J. I. (2011). Political Instability: Effects on Financial Development, Roots in the Severity of Economic Inequality. Journal of Comparative Economics, 39(3), 279–309. https://doi.org/10.1016/j.jce.2011.02.001
Saeed, M. (2020). The Effects of Monetary Policy on Poverty Alleviation in Pakistan. Available at SSRN 3693375. http://dx.doi.org/10.2139/ssrn.3693375
Sakanko, M. A., David, J., Abu, N., & Gamal, A. A. M. (2024). Financial Inclusion and Underground Economy Nexus in West Africa: Evidence from Dynamic Heterogeneous Panel Techniques. Economic Change and Restructuring, 57(8), 1–21. https://doi.org/10.1007/s10644-024-09589-x.
Sakanko, M. A., David, J., & Onimisi, A. M. (2020). Advancing Inclusive Growth in Nigeria: The Role of Financial Inclusion in Poverty, Inequality, Household Expenditure, and Unemployment. Indonesian Journal of Islamic Economics Research, 2(2), 70–84. https://doi.org/10.18326/ijier.v2i2.3914
Senou, M. M., & Houensou, D. A. (2024). From Expanding Financial Services to Tackling Poverty in West African Economic and Monetary Union: The Accelerating Role of Mobile Money. Journal of International Development, 36(3), 1707–1737. https://doi.org/10.1002/jid.3881
Sharma, U., & Changkakati, B. (2022). Dimensions of Global Financial Inclusion and Their Impact on the Achievement of the United Nations Development Goals. Borsa Istanbul Review, 22(6), 1238–1250. https://doi.org/10.1016/j.bir.2022.08.010.
Shaw, E. S. (1973). Financial Deepening in Economic Development. New York: Oxford University Press.
Shleifer, A., & Vishny, R. W. (1998). The Grabbing Hand: Government Pathologies and Their Cures. Cambridge: Harvard University Press.
Sinaga, M. (2020). Analysis of Effect of GRDP (Gross Regional Domestic Product) Per Capita, Inequality Distribution Income, Unemployment and HDI (Human Development Index) on Poverty. Budapest International Research and Critics Institute (BIRCI-Journal): Humanities and Social Sciences, 3(3), 2309–2317. https://doi.org/10.33258/birci.v3i3.1177
Siyan, P., Adegoriola, A. E., & Adolphus, J. A. (2016). Unemployment and Inflation: Implication on Poverty Level in Nigeria. Journal of Development and Society, 3(4), 17–45.
South African Reserve Bank. (2020). Financial Inclusion in South Africa 2019. Retrieved from Download Information from XLSX Data Files (resbank.co.za).
Statistics South Africa. (2021). National Poverty Lines. Pretoria, South Africa.
Straub, S. (2005). Informal Sector: The Credit Market Channel. Journal of Development Economics, 78(2), 299–321. https://doi.org/10.1016/j.jdeveco.2004.09.005
Tabash, M. I., Ezekiel, O., Ahmed, A., Oladiran, A., Elsantil, Y., & Lawal, A. I. (2024). Examining the Linkages among Financial Inclusion, Economic Growth, Poverty, and Inequality Reduction in Africa. Scientific African, 24, 1–17. https://doi.org/10.1016/j.sciaf.2024.e02096
Teshome, A., & Nana, Q. (2014). Causes of Poverty in Sub-Saharan Africa: A Layered Theory Approach to Understanding Significant Factors. Journal of Economics and International Finance, 6(6), 112–124.
Tonkiss, F. (2009). Trust, Confidence and Economic Crisis. International Economics, 44(4), 196–202. https://doi.org/10.1007/s10272-009-0295-x
United Nations. (2021). One in Five South Africans Now Lives on Less Than R28 a Day, the UN finds. Access from https://www.businessinsider.co.za/heres-how-many-south-africans-live-on-less-than-r28-a-day-and-why-its-getting-worse-2020-12
World Bank. (2020a). Enhancing Government Effectiveness and Transparency: The Fight Against Corruption. Washington DC: World Bank Publications.
World Bank. (2020b). Financial Inclusion Report. Washington DC: World Bank.
World Bank. (2023). Development Indicator. Washington DC: World Bank Publications.
World Governance Indicators. (2023). Control of Corruption. Washington DC: World Bank Publications.
Yahyaoui, I., & Bouchoucha, N. (2021). The Long‐run Relationship Between ODA, Growth and Governance: An Application of FMOLS and DOLS approaches. African Development Review, 33(1), 38–54. https://doi.org
Yiadom, E. B., Dziwornu, R. K., & Yalley, S. (2021). Financial Inclusion, Poverty and Growth in Africa: Can Institutions Help? African Journal of Economic and Sustainable Development, 8(2), 91–110.
Yolanda, Y. (2017). Analysis of Factors Affecting Inflation and its Impact on Human Development Index and Poverty in Indonesia. European Research Studies Journal, 20(4B), 38–56.
Zeng, G., Zhang, C., Li, S., & Sun, H. (2021). The Dynamic Impact of Agricultural Fiscal Expenditures and Gross Agricultural Output on Poverty Reduction: A VAR Model Analysis. Sustainability, 13(11), 5766. https://doi.org/10.3390/su13115766