Organizations and Markets in Emerging Economies ISSN 2029-4581 eISSN 2345-0037
2025, vol. 16, no. 2(33), pp. 387–411 DOI: https://doi.org/10.15388/omee.2025.16.21
The Impact of Formal Entrepreneurship and Economic Freedom on the Size of the Shadow Economy in Asian Countries
Buu Kiem Dang
Saigon University, Vietnam
dbkiem@sgu.edu.vn
https://ror.org/01f1fsr30
Abstract. This study aims to evaluate the impact of formal entrepreneurship and economic freedom on the size of the shadow economy in Asian countries. The research sample includes 22 Asian countries over the period from 1995 to 2018. The study employs reliable panel data estimation methods, including the Fixed Effects Model with robust standard errors method, the Driscoll-Kraay standard errors method, and the two-step system GMM method. The findings indicate that formal entrepreneurship has a positive relationship with the size of the shadow economy, while economic freedom and its two sub-components, business freedom and trade freedom, reduce the size of the shadow economy. Additionally, economic freedom, business freedom, and trade freedom play a moderating role in reducing the positive relationship between formal entrepreneurship and the size of the shadow economy. Our study suggests that governments should comprehensively evaluate the effectiveness of policies promoting entrepreneurship and consider expanding economic freedom, particularly business freedom and trade freedom.
Keywords: formal entrepreneurship, economic freedom, shadow economy, Asian countries
Received: 2/10/2024. Accepted: 20/8/2025
Copyright © 2025 Buu Kiem Dang. Published by Vilnius University Press. This is an Open Access article distributed under the terms of the Creative Commons Attribution Licence, which permits unrestricted use, distribution, and reproduction in any medium, provided the original author and source are credited.
1. Introduction
The shadow economy (also known as the informal economy) is commonly defined as economic activities that fall outside the formal scope of government control and are not recorded in the regular statistical reports provided by governmental agencies (Schneider et al., 2011). According to data reported by the World Bank, sourced from Elgin et al. (2021), the average global shadow economy accounted for approximately 31.9% of GDP in 2018, while the average in Asian countries was estimated to be around 26.5% of GDP. Within Asia, Thailand had the highest shadow economy share at 47.63% of GDP, while Japan had the lowest at 10.2% of GDP. Although Asia’s average shadow economy size is lower than the global average, the continent represents a significant portion of global GDP. According to Fund (2021), Asia contributed nearly 39% of global nominal GDP, far exceeding other regions. Thus, it is evident that the total size of the shadow economy in Asia is substantial and could significantly impact the region’s sustainable development.
Numerous studies have approached this issue from various perspectives to identify the factors influencing the changes in the size of the informal economy. For instance, the shadow economy is affected by factors such as wages and unemployment (Kolm & Larsen, 2006), national economic development (Ginevicius et al., 2020), financial system development (Capasso & Jappelli, 2013; Nguyen & Su, 2020), financial technology (Rahman et al., 2023), corruption, and institutional quality (Dang et al., 2023), foreign direct investment inflows (Ali & Bohara, 2017; Tiutiunyk et al., 2022), or a combination of several factors like unemployment, economic growth, money supply, foreign trade, and financial development (Khan et al., 2021). However, one critical factor that directly impacts the size of the shadow economy—entrepreneurship—has not been extensively studied in depth for specific economic regions. Entrepreneurship involves potential entrepreneurs deciding whether to register a business officially or operate in the informal environment (Estrin & Mickiewicz, 2012; Mróz, 2012; Wiseman, 2015), thereby directly affecting the size of the shadow economy.
Furthermore, today’s global trade environment is being driven by most countries’ policies to expand economic freedom, creating more opportunities for investment and entrepreneurship, which in turn influences the size of the shadow economy (Bayar & Öztürk, 2019; Berdiev et al., 2018; Koyuncu & Ünal, 2019). The context we want to address here is Asia, which has recently been actively promoting innovation and economic growth policies (Hemmert et al., 2022), leveraging its position as the most dynamic region in the world with a large market potential (McKinsey, 2019a, 2019b). Asia is increasingly liberalizing its economy and becoming one of the world’s key economic centers (Ramli et al., 2023). The question arises as to whether the pursuit of economic liberalization policies helps reduce the size of the shadow economy in Asian countries. Furthermore, what role does it play in moderating the relationship between entrepreneurship and the size of the shadow economy? These crucial issues have not been clearly presented in previous studies. We believe that these are research gaps that need to be addressed.
This study contributes to the ongoing debates related to the shadow economy in Asian countries in three ways. First, we examine the impact of formal entrepreneurship on the size of the shadow economy. Second, we analyze the influence of economic freedom policies and two key components of economic freedom—business freedom and trade freedom—on the size of the shadow economy. Third, we investigate the moderating role of economic freedom, including the roles of business freedom and trade freedom, in the relationship between formal entrepreneurship and the shadow economy. We hope that the research findings will provide meaningful insights for policymakers in developing appropriate policies related to the shadow economy.
The remaining sections of this study are organized as follows: Section 2 presents a review of the relevant literature; Section 3 discusses the research methodology, including data, model, and estimation methods; Section 4 presents the research results and discussion; and finally, Section 5 provides conclusions and policy implications for stakeholders.
2. Literature Review
2.1 The Impact of Entrepreneurship on the Shadow Economy
Entrepreneurship is defined as the creation of value (Ratten, 2023). Formal entrepreneurship involves registering relevant documents to obtain a business license and complying with legal business regulations, while informal entrepreneurship does not follow these formalities (Estrin et al., 2024; Laing et al., 2022). Estrin and Mickiewicz (2012) argue that potential entrepreneurs’ decisions are influenced by competition from both the formal and informal sectors of the economy. First, in the formal sector, there are typically fewer firms with greater market power, which poses a barrier for new firms to enter the formal sector. Second, the competitive advantage in pricing of goods and services provided by the informal sector is a major challenge for formal start-ups. Finance is a crucial issue for entrepreneurship, and thus potential entrepreneurs often consider costs when deciding whether to start a business in the formal or informal economy (Webb et al., 2013). Generally, start-up costs in the informal sector are lower (Saunoris & Sajny, 2017). The main costs that formal enterprises have to bear include initial registration fees, taxes payable to the government during operation, and the expenses related to bankruptcy (Autio & Fu, 2015), which are relatively high. In contrast, informal businesses only pay taxes and fines (if caught) (Tumen, 2017). As a result, potential entrepreneurs may prefer to choose the informal sector as a testing ground for their business ideas due to its lower and more acceptable costs before scaling up in the formal sector (Estrin et al., 2024; Welter et al., 2015). However, entering the informal sector is not always easy, as existing internal networks have been established to serve the interests of current organizations, creating barriers for new informal entrepreneurs (Estrin & Mickiewicz, 2012).
Autio and Fu (2015) argue that the quality of institutions is a crucial factor influencing entrepreneurs’ decisions to enter the formal economy, thereby impacting the size of the shadow economy. Countries with high institutional quality, evidenced by simplified legal procedures such as market entry regulations and laws governing business operations and bankruptcy (Lee et al., 2011; Levie & Autio, 2011), and where governments effectively reduce cost burdens for private sector businesses, tend to encourage more potential entrepreneurs to enter the formal economy. Additionally, entrepreneurs operating in the informal sector may transition to the formal economy to formalize all or part of their business activities and gain legal protection (Autio & Fu, 2015; Welter et al., 2015; Williams & Nadin, 2010). This results in a reduction of the shadow economy. Conversely, in countries with negative institutional environments, such as high tax burdens, complicated legal procedures, and higher risks, entrepreneurs tend to avoid registering businesses and opt for the informal sector instead (Autio & Fu, 2015). Even in the presence of strong institutions, an overly complex tax code increases entrepreneurs’ incentives to engage in informal activities (Awasthi & Engelschalk, 2018). Moreover, formal entrepreneurs may shift part or all of their activities to the informal sector to save costs (Williams et al., 2017), ultimately increasing the size of the shadow economy. Putniņš and Sauka (2011) studied the shadow economy in the Baltic States and found that dissatisfaction and lack of trust among entrepreneurs towards the government and the tax system are the main drivers of informal activities in the region. Newly established businesses and companies operating in the construction industry tend to engage more in the shadow economy, using business practices that evade taxes and distort GDP estimates. In the context of Poland, Mróz (2012) found interesting results: as Poland transitioned to a market economy, entrepreneurship flourished, leading to a significant increase in the number of newly established businesses. However, this economic shift also revealed a darker side, as most economic activities shifted to the informal sector. In summary, the impact of formal entrepreneurship on the shadow economy is complex, and we therefore do not have any a priori expectations about the relationship between them.
2.2 The Impact of Economic Freedom on the Size of the Shadow Economy
In general, economic freedom refers to government policies aimed at increasing the protection and promotion of private property rights, eliminating trade barriers, reducing tariffs, lowering tax burdens for businesses, simplifying legal procedures, and minimizing government intervention in the economy (Autio & Fu, 2015; Sweidan, 2017). Typically, policies that promote economic freedom and deep trade reforms tend to drive economic growth (Irwin, 2024; Piątek et al., 2013; Santiago et al., 2020). The size of the shadow economy usually expands during periods of economic downturn and contracts during economic growth (Sweidan, 2017). The significant benefits of economic freedom include enabling individuals and businesses to generate substantial profits through low tax environments, reduced operating costs, and strong government protection of private property rights. Additionally, capital is allocated more efficiently with competitive costs, and investment opportunities are readily available as global trade flows to areas where preferences and interests are best satisfied (Berggren, 2003). As such, economic freedom creates conditions that encourage businesses and potential entrepreneurs to operate in the formal economy, thus reducing the size of the shadow economy (Sweidan, 2017). Similarly, Saunoris and Sajny (2017) argue that entrepreneurial behavior is not uniform; decisions to remain in the formal economy or withdraw into the informal sector partly depend on whether national institutions support economic freedom. Therefore, potential entrepreneurs are more likely to start formal businesses in environments with high economic freedom, and entrepreneurs in the informal economy tend to transition to the formal sector in response to increasing economic freedom. Williams et al. (2017) state that shortcomings in political institutions—such as a lack of clearly defined property rights, inadequate basic utilities, and poor social protection—force citizens to engage in informal entrepreneurship for survival.
Most previous empirical studies agree that economic freedom plays a crucial role in reducing the size of the informal economy. Berdiev et al. (2018) evaluated the impact of economic freedom on the shadow economy using a sample of 100 countries from 2000 to 2015. Their findings indicate that, overall, economic freedom reduces the size of the shadow economy. Similarly, Bayar and Öztürk (2019) assessed the impact of economic freedom and globalization on the size of the shadow economy in European Union transition economies during the period from 2000 to 2015. Their results show that economic freedom strongly reduces the size of the shadow economy, and globalization has a similar but weaker effect, impacting only some countries in the sample. In another study using a sample of OECD and other European countries, Freytag et al. (2022) also found that higher levels of economic freedom are associated with smaller shadow economies. Several other studies provide evidence that economic freedom reduces the size of the underground economy (Dang et al., 2023; Farzanegan et al., 2020; Goel et al., 2020).
However, in some cases, countries with severe corruption and low levels of democracy experience a significant increase in informal economic activities when economic freedom is promoted (D’Agostino et al., 2023). This research examined the impact of economic freedom on the informal economy in 152 countries during the period from 1995 to 2017. D’Agostino et al. (2023) divided the data into several groups with different characteristics to investigate the effects of economic freedom on the underground economy. They found that economic freedom contributes to reducing the size of the shadow economy in developed countries with higher levels of democracy and lower levels of corruption. Conversely, economic freedom increases the size of the shadow economy in developing countries with lower levels of democracy and high levels of corruption. In another study, Ouédraogo (2017) analyzed the relationship between governance, corruption, and the size of the shadow economy in 23 Sub-Saharan African countries. The results indicate that corruption, governance quality, and institutional quality are key factors influencing the growth of the shadow economy. Moreover, one component of economic freedom, financial freedom, and business freedom increase the size of the shadow economy, while monetary freedom reduces it.
One component of economic freedom is trade freedom, which refers to technical trade barriers and tariffs. Berdiev et al. (2018) argue that these barriers may drive entrepreneurs to engage in illegal business activities such as smuggling to evade taxes (Buehn & Farzanegan, 2012; Saunoris & Sajny, 2017). Therefore, Berdiev and Saunoris (2018) suggest that implementing trade freedom policies is an effective solution to reduce the size of the shadow economy. Additionally, business freedom refers to the extent of business regulations within a country, impacting all three stages of the business life cycle: business formation, business operations, and business dissolution (Navickas et al., 2019). Low levels of business freedom, coupled with complex and overlapping regulations, increase production costs in the formal sector (Berdiev et al., 2018; D’Agostino et al., 2023), which in turn leads to a higher share of the shadow economy within the overall economy (Navickas et al., 2019; Schneider & Buehn, 2012). In the case of Mexico, Bruhn (2011) and Kaplan et al. (2011) demonstrate that the SARE (Sistema de Apertura Rápida de Empresas) reform, aimed at simplifying regulatory procedures, significantly expedited business registration processes, resulting in a 5% increase in registered businesses. This, in turn, reduced informality by encouraging participation in the formal sector.
In summary, the majority of previous studies suggest that economic freedom and its key components, including business freedom and trade freedom, have a positive impact on promoting formal entrepreneurship and reducing the size of the shadow economy. Therefore, we expect that overall economic freedom and its sub-components, including business freedom and trade freedom, have a negative relationship with the shadow economy.
3. Methodology
3.1 The Model
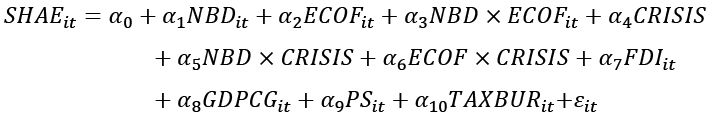
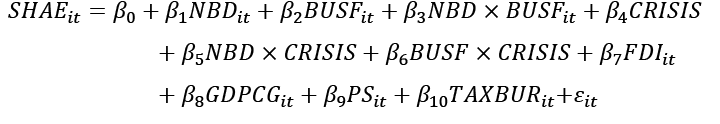
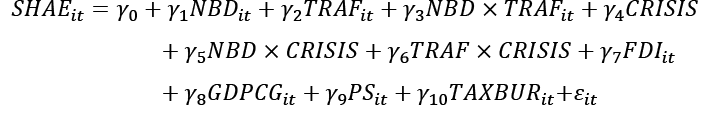
Based on the previous models developed by D’Agostino et al. (2023), Zhanabekov (2022), Lyulyov et al. (2021) and Bayar and Öztürk (2019), we propose a research model examining the impact of entrepreneurship and economic freedom on the size of the shadow economy in Asian countries as follows:
 (1)
(1)
 (2)
(2)
 (3)
(3)
where i and t represent country i and time t, respectively, and the variables used in the research model are summarized in Table 1.
Table 1
Definitions and Data Collection Sources
|
Variables |
Definition |
Unit |
Symbol |
Source |
References |
|---|---|---|---|---|---|
|
Dependent variable |
|||||
|
Shadow economy |
The shadow economy as economic activities, firms, and workers that operate outside legal and regulatory systems, as a percentage of GDP. The shadow economy is calculated using the Multiple Indicator Multiple Cause (MIMIC) method by Elgin et al. (2021). |
Ln (natural logarithm) |
SHAE |
World Bank |
Chen et al. (2020); D’Agostino et al. (2023); Elgin et al. (2021) |
|
Independent variables |
|||||
|
Entrepreneurship |
|||||
|
New business density rate |
New business density refers to the number of new business registrations per 1,000 people aged 15–64 in a given country |
Ln (natural logarithm) |
NBD |
World Bank |
Apostu and Gigauri (2023); Ajide and Ojeyinka (2022); Ghazy et al. (2022), Sani and Jamil (2022) |
|
Economic freedom Index |
|||||
|
Economic freedom |
The Economic Freedom Index assesses government intervention in the economy, including taxes, property rights, inflation, income taxes, and more. It is used to compare economic freedom between countries and track policy changes over time, with scores from 0 to 100. |
Ln (natural logarithm) |
ECOF |
The Heritage |
D’Agostino et al. (2023); Dang and Phan (2022); Nguyen (2022); Dang (2024); Bayar and Öztürk (2019) |
|
Business Freedom |
Business Freedom assesses the ease of doing business in a country, including factors like regulations and licensing, with scores from 0 to 100. |
Ln (natural logarithm) |
BUSF |
The Heritage |
D’Agostino et al. (2023); Navickas et al. (2019); Berdiev et al. (2018) |
|
Trade Freedom |
Trade Freedom evaluates a country’s openness to international trade, including tariff and non-tariff barriers, with scores from 0 to 100. |
Ln (natural logarithm) |
TRAF |
The Heritage |
Berdiev et al. (2018); D’Agostino et al. (2023) |
|
Control Variables |
|||||
|
Crisis |
A dummy variable representing the economic shock stemming from the global economic crisis during the period 2007–2009. It takes the value of 1 for the years 2007 to 2009 and 0 otherwise. |
CRISIS |
|||
|
Foreign direct investment |
Foreign direct investment, net inflows (% of GDP) |
Ln (natural logarithm) |
FDI |
World Bank |
Dang et al. (2023); Tran Pham (2023), Goel et al. (2020); Chen et al. (2020) |
|
GDP per capita growth |
GDP per capita growth (annual %) |
Ln (natural logarithm) |
GDPCG |
World Bank |
D’Agostino et al. (2023); Khan et al. (2023); Dang et al. (2023); Goel et al. (2020); Achim et al. (2019); Navickas et al. (2019) |
|
Political Stability |
Political stability and absence of violence or terrorism: Percentile Rank |
Ln (natural logarithm) |
PS |
World Bank |
Siddik et al. (2022); Elbahnasawy et al. (2016); Ouédraogo (2017) |
|
Tax Burden |
Tax Burden as the total amount of taxes paid by individuals and businesses as a percentage of GDP |
Ln (natural logarithm) |
TAXBUR |
The Heritage |
Dang et al. (2023); Lyulyov et al. (2021); Goel et al. (2020); Chen et al. (2020); Achim et al. (2019); Navickas et al. (2019) |
• Foreign direct investment (FDI). In this study, the author uses foreign direct investment net inflows (% of GDP) to represent FDI. FDI is one of the key factors frequently analyzed in relation to the shadow economy. Goel et al. (2020) argue that it is difficult to predict the impact of FDI on the shadow economy. FDI may increase the size of the shadow economy by directly influencing subcontracting in the shadow sector or by affecting corruption. FDI can exacerbate corruption, which in turn expands the shadow economy (Goel & Saunoris, 2014). However, FDI can also reduce the shadow economy's size because FDI companies tend to have stricter and more transparent requirements and must comply with local regulations to avoid systemic risks or be subject to closer supervision (Goel et al., 2020). Empirical studies have shown mixed results; some studies indicate that FDI plays an important role in reducing the size of the informal economy (Goel et al., 2020; Huynh et al., 2020; Tran Pham, 2023). However, other studies have found a positive relationship between FDI and the informal economy (Chen et al., 2020; Dang et al., 2023).
• GDP growth. In this study, the author uses GDP per capita growth (GDPCG) to represent GDP growth. GDPCG is one of the most common macroeconomic variables used in research models that analyze factors influencing the shadow economy. The impact of GDP on the shadow economy has produced mixed evidence. Most studies agree that countries with high economic growth, as reflected in improved per capita income over the years, contribute to reducing the size of the shadow economy (Berdiev et al., 2018; D’Agostino et al., 2023; Dang et al., 2023; Imamoglu, 2021; Khan et al., 2023; Siddik et al., 2022; Tran Pham, 2023). This is because higher GDP indicates a better economy, leading to more job opportunities in the formal sector. Additionally, an increase in GDP results in improvements in infrastructure and public services, thereby attracting informal enterprises to transition into the formal sector to access better benefits (Wu & Schneider, 2019). However, some studies have found a positive relationship between economic growth and the shadow economy (Goel et al., 2020). This may be due to the middle-income trap and income inequality that lead to the shadow economy expanding as GDP per capita increases. Furthermore, Baklouti and Boujelbene (2020) explain that GDP per capita can reduce the size of the shadow economy in environments with good institutional quality, whereas in environments with poor institutional quality, GDP per capita has almost no impact on the shadow economy. Similarly, Navickas et al. (2019) found no effect of GDP on the shadow economy.
• Political Stability (PS). Most previous studies agree that higher political stability reduces the size of the shadow economy (Elbahnasawy et al., 2016; Elgin, 2010; Ouédraogo, 2017; Siddik et al., 2022; Torgler & Schneider, 2009). Elbahnasawy et al. (2016) and Ouédraogo (2017) argue that a politically stable environment reflects better government quality, thereby increasing public trust and confidence in the formal economy and reducing informal activities.
• Tax burden (TAXBUR). The tax burden is also a key issue explored by many studies in relation to the shadow economy. Most research indicates that in environments where governments impose high tax rates, people are more likely to participate in informal activities (Chen et al., 2020; Dang et al., 2023; Goel et al., 2020; Navickas et al., 2019). This is particularly evident in countries with higher levels of corruption (Berdiev et al., 2018). However, the findings of Achim et al. (2019) show that a high tax burden can reduce the size of the shadow economy.
3.2 Data
The data in this study was collected over the period from 1995 to 2018 for 22 Asian countries, including Bangladesh, China, India, Indonesia, Israel, Japan, Jordan, Kazakhstan, Kuwait, Lebanon, Malaysia, Oman, Pakistan, Philippines, Qatar, Saudi Arabia, Singapore, South Korea, Syria, Thailand, United Arab Emirates, and Vietnam. Data on economic freedom, business freedom, trade freedom, and tax burden were obtained from The Heritage Foundation. All remaining variables were sourced from the World Bank, with shadow economy data derived from the Multiple Indicators Multiple Causes (MIMIC) model-based estimates of informal output developed by Elgin et al. (2021). Details regarding the measurement and data sources are explicitly provided by the authors in Table 1.
3.2.1 Data Description
Table 2 presents the statistics on the size of the shadow economy for the 22 Asian countries in the sample for the years 1995 and 2018. The data shows that the shadow economy as a percentage of GDP was lower in 2018 compared to 1995. Japan had the lowest percentage of shadow economy, with 11.12% in 1995, decreasing to 10.21% in 2018. In contrast, Thailand had the highest level, though it decreased from 50.74% in 1995 to 47.63% in 2018.
Table 2
Shadow Economy in Asian Countries (1995; 2018)
|
Countries |
Year |
Shadow economy |
Year |
Shadow economy |
|---|---|---|---|---|
|
Bangladesh |
1995 |
36.08% |
2018 |
34.65% |
|
China |
1995 |
12.55% |
2018 |
11.17% |
|
India |
1995 |
22.39% |
2018 |
19.73% |
|
Indonesia |
1995 |
19.51% |
2018 |
17.88% |
|
Israel |
1995 |
22.72% |
2018 |
19.66% |
|
Japan |
1995 |
11.12% |
2018 |
10.21% |
|
Jordan |
1995 |
19.56% |
2018 |
17.97% |
|
Kazakhstan |
1995 |
44.14% |
2018 |
36.56% |
|
Kuwait |
1995 |
19.70% |
2018 |
20.78% |
|
Lebanon |
1995 |
33.51% |
2018 |
32.36% |
|
Malaysia |
1995 |
32.65% |
2018 |
29.26% |
|
Oman |
1995 |
20.25% |
2018 |
20.56% |
|
Pakistan |
1995 |
37.65% |
2018 |
34.20% |
|
Philippines |
1995 |
42.92% |
2018 |
38.06% |
|
Qatar |
1995 |
20.50% |
2018 |
18.27% |
|
Saudi Arabia |
1995 |
18.13% |
2018 |
17.15% |
|
Singapore |
1995 |
12.71% |
2018 |
11.89% |
|
South Korea |
1995 |
27.29% |
2018 |
26.14% |
|
Syria |
1995 |
19.07% |
2018 |
19.74% |
|
Thailand |
1995 |
50.74% |
2018 |
47.63% |
|
United Arab Emirates |
1995 |
26.28% |
2018 |
27.94% |
|
Vietnam |
1995 |
16.15% |
2018 |
14.04% |
Note. Data sourced from the Word Bank.
Table 3 provides descriptive statistics for the variables in the research model. All variables were log-transformed to minimize discrepancies in scale due to differences in measurement units and to approximate a normal distribution. The mean and median values of the variables do not differ significantly, indicating that most variables satisfy the normal distribution assumption and meet the conditions for the regression estimation methods used in panel data.
Table 3
Descriptive Statistics of Variables
|
Variable |
Obs |
Mean |
S.D. |
Min |
Median |
Max |
|
SHAE |
528 |
3.13 |
0.41 |
2.32 |
3.02 |
3.98 |
|
NBD |
226 |
-0.24 |
1.48 |
-3.74 |
-0.09 |
2.30 |
|
ECOF |
397 |
4.13 |
0.17 |
3.59 |
4.15 |
4.49 |
|
BUSF |
403 |
4.18 |
0.22 |
3.57 |
4.22 |
4.61 |
|
TRAF |
400 |
4.21 |
0.35 |
2.58 |
4.34 |
4.50 |
|
CRISIS |
531 |
0.13 |
0.33 |
0.00 |
0.00 |
1.00 |
|
FDI |
480 |
0.61 |
1.43 |
-7.20 |
0.84 |
3.39 |
|
GDPCG |
389 |
1.17 |
0.87 |
-2.42 |
1.34 |
2.69 |
|
PS |
420 |
3.40 |
1.00 |
-0.75 |
3.69 |
4.60 |
|
TAXBUR |
398 |
4.38 |
0.22 |
3.60 |
4.39 |
4.60 |
Note. Calculations are based on the dataset and using the Stata software.
The regression matrix for the variables in the research model is presented in Table 4. All correlation coefficients are less than 0.8, indicating that there are no serious multicollinearity issues in the estimation model (Gujarati & Porter, 2009). However, the correlation coefficients between the economic freedom index (ECOF) and its components, including business freedom (BUSF) and trade freedom (TRAF), are relatively high. To prevent potential bias from multicollinearity, these variables will not be included simultaneously in the same estimation models.
Table 4
Correlation Matrix of Variables
|
SHAE |
NBD |
ECOF |
BUSF |
TRAF |
CRISIS |
FDI |
GDPCG |
PS |
TAXBUR |
|
|
SHAE |
1.000 |
|||||||||
|
NBD |
-0.276 |
1.000 |
||||||||
|
ECOF |
-0.116 |
0.433 |
1.000 |
|||||||
|
BUSF |
-0.119 |
0.362 |
0.765 |
1.000 |
||||||
|
TRAF |
-0.033 |
0.459 |
0.637 |
0.363 |
1.000 |
|||||
|
CRISIS |
-0.017 |
-0.090 |
-0.010 |
-0.065 |
0.095 |
1.000 |
||||
|
FDI |
0.003 |
0.391 |
-0.047 |
-0.136 |
0.003 |
0.125 |
1.000 |
|||
|
GDPCG |
0.001 |
0.037 |
-0.311 |
-0.348 |
-0.183 |
-0.002 |
0.235 |
1.000 |
||
|
PS |
-0.437 |
0.618 |
0.446 |
0.469 |
0.213 |
-0.054 |
0.061 |
-0.040 |
1.000 |
|
|
TAXBUR |
0.198 |
0.143 |
0.401 |
0.124 |
0.339 |
0.069 |
0.085 |
-0.104 |
0.246 |
1.000 |
Note. Calculations are based on the dataset and using the Stata software.
3.2.2 Estimation Method
The data structure of the study is in the form of an unbalanced panel. Therefore, panel data regression estimation methods are employed. The research data comprises 22 different Asian countries, each with distinct characteristics. Therefore, we employ the Fixed Effects Model with robust standard errors to effectively address heteroskedasticity (Berdiev et al., 2018; Sweidan, 2017). Additionally, we employ the Driscoll-Kraay standard errors method developed by Driscoll and Kraay (1998) to handle heteroscedasticity and autocorrelation in the regression model.
However, some previous studies have indicated the potential issue of endogeneity (Berdiev et al., 2018; D’Agostino et al., 2023; Goel et al., 2020; Sweidan, 2017). Therefore, we also address endogeneity using the two-step system GMM (Generalized Method of Moments) approach in this study. We prioritize using the estimation results from the two-step system GMM in our discussion because this method effectively resolves major issues, including endogeneity, heteroscedasticity, and autocorrelation, and provides the most reliable estimation results among the aforementioned methods (Roodman, 2009; Sweidan, 2017).
4. Empirical Results
Table 5 and Table 6 present the results of the impact of formal entrepreneurship and economic freedom on the size of the shadow economy using the Fixed Effects Model with robust standard errors and Driscoll-Kraay standard errors methods, respectively. However, as mentioned earlier, due to potential endogeneity issues (Berdiev et al., 2018; D’Agostino et al., 2023; Goel et al., 2020; Sweidan, 2017), the estimation results from these methods may not be highly reliable and could lead to biased research outcomes.
Table 5
Results of the Impact of Formal Entrepreneurship and Economic Freedom on the Size of the Shadow Economy, Estimated Using the Fixed Effects Model with Robust Standard Errors Method
|
Variables |
Model (1) |
Model (2) |
Model (3) |
|---|---|---|---|
|
SHAE |
SHAE |
SHAE |
|
|
NBD |
0.3735* |
0.0277 |
-0.0479 |
|
(0.1908) |
(0.0855) |
(0.0594) |
|
|
ECOF |
-0.0944 |
||
|
(0.0577) |
|||
|
NBD×ECOF |
-0.0957* |
||
|
(0.0458) |
|||
|
CRISIS |
0.3787 |
0.0055 |
0.3161*** |
|
(0.2906) |
(0.1322) |
(0.0923) |
|
|
NBD×CRISIS |
0.0001 |
-0.0029 |
0.0051 |
|
(0.0061) |
(0.0067) |
(0.0045) |
|
|
ECOF×CRISIS |
-0.0934 |
||
|
(0.0694) |
|||
|
BUSF |
-0.0372 |
||
|
(0.0279) |
|||
|
NBD×BUSF |
-0.0121 |
||
|
(0.0198) |
|||
|
BUSF×CRISIS |
-0.0033 |
||
|
(0.0305) |
|||
|
TRAF |
-0.0248 |
||
|
(0.0372) |
|||
|
NBD×TRAF |
0.0053 |
||
|
(0.0130) |
|||
|
TRAF×CRISIS |
-0.0744*** |
||
|
(0.0212) |
|||
|
FDI |
0.0042 |
0.0050 |
0.0052 |
|
(0.0042) |
(0.0053) |
(0.0054) |
|
|
GDPCG |
-0.0062 |
-0.0063 |
-0.0053 |
|
(0.0051) |
(0.0050) |
(0.0050) |
|
|
PS |
-0.0379*** |
-0.0413*** |
-0.0426*** |
|
(0.0057) |
(0.0098) |
(0.0102) |
|
|
TAXBUR |
-0.2312* |
-0.2518* |
-0.2454* |
|
(0.1317) |
(0.1444) |
(0.1258) |
|
|
_cons |
4.4814*** |
4.3384*** |
4.2636*** |
|
(0.6349) |
(0.6156) |
(0.5748) |
|
|
Observations |
125 |
125 |
125 |
|
Sample period |
1995–2018 |
1995–2018 |
1995–2018 |
|
Prob (F-stat) |
0.0000 |
0.0000 |
0.0000 |
|
R_Square |
0.5191 |
0.4568 |
0.4999 |
Note. *, **, and *** denote statistical significance at the 10%, 5%, and 1% levels, respectively. Values in parentheses represent standard errors. Based on the dataset and using the Stata software.
Table 6
Results of the Impact of Formal Entrepreneurship and Economic Freedom on the Size of the Shadow Economy, Estimated Using the Driscoll-Kraay Standard Errors Method
|
Variables |
Model (4) |
Model (5) |
Model (6) |
|---|---|---|---|
|
SHAE |
SHAE |
SHAE |
|
|
NBD |
0. 3735*** |
0.0277 |
-0.0479 |
|
(0.0989) |
(0.0623) |
(0.0541) |
|
|
ECOF |
-0.0944 |
||
|
(0.0689) |
|||
|
NBD×ECOF |
-0.0957*** |
||
|
(0.0236) |
|||
|
CRISIS |
0.3787* |
0.0055 |
0.3161*** |
|
(0.1927) |
(0.1098) |
(0.0817) |
|
|
NBD×CRISIS |
0.0001 |
-0.0029 |
0.0051 |
|
(0.0053) |
(0.0059) |
(0.0040) |
|
|
ECOF×CRISIS |
-0.0934* |
||
|
(0.0463) |
|||
|
BUSF |
-0.0372 |
||
|
(0.0254) |
|||
|
NBD×BUSF |
-0.0121 |
||
|
(0.0140) |
|||
|
BUSF×CRISIS |
-0.0033 |
||
|
(0.0260) |
|||
|
TRAF |
-0.0248 |
||
|
(0.0261) |
|||
|
NBD×TRAF |
0.0053 |
||
|
(0.0115) |
|||
|
TRAF×CRISIS |
-0.0744*** |
||
|
(0.0190) |
|||
|
FDI |
0.0042** |
0.0050* |
0.0052* |
|
(0.0018) |
(0.0026) |
(0.0025) |
|
|
GDPCG |
-0.0062* |
-0.0063* |
-0.0053* |
|
(0.0031) |
(0.0030) |
(0.0028) |
|
|
PS |
-0.0379*** |
-0.0413*** |
-0.0426*** |
|
(0.0124) |
(0.0126) |
(0.0120) |
|
|
TAXBUR |
-0.2312** |
-0.2518* |
-0.2454** |
|
(0.0887) |
(0.1184) |
(0.0953) |
|
|
_cons |
4.4814*** |
4.3384*** |
4.2636*** |
|
(0.4641) |
(0.4048) |
(0.3679) |
|
|
Observations |
125 |
125 |
125 |
|
Sample period |
1995–2018 |
1995–2018 |
1995–2018 |
|
Prob (F-stat) |
0.0000 |
0.0000 |
0.0000 |
|
R_Square |
0.5191 |
0.4568 |
0.4999 |
Note. *, **, and *** denote statistical significance at the 10%, 5%, and 1% levels, respectively. Values in parentheses represent standard errors. Based on the dataset and using the Stata software.
Table 7 presents the estimation results of the impact of formal entrepreneurship and economic freedom on the size of the shadow economy using the two-step system GMM method. The AR(2) test indicates no second-order autocorrelation (p-value > 0.1), and the Hansen test confirms the validity of the instruments (p-value > 0.1). Consequently, the results from the two-step system GMM estimation are deemed robust and reliable (Roodman, 2009). Therefore, we use the results from Table 7 as the basis for our discussion in this study.
4.1 The Impact of Formal Entrepreneurship on the Size of the Shadow Economy
The results in Table 7 show consistent and strong evidence that formal entrepreneurship is positively related to the size of the shadow economy in Asian countries. The regression coefficient of the variable NBD is positive and highly statistically significant across models (7), (8), and (9). In other words, an increase in the number of formally registered businesses leads to an increase in the size of the shadow economy. We believe this is a rather intriguing finding, which may stem from several reasons as outlined below. First, the number of formally registered businesses may increase, but the number of informal businesses could increase even more, leading to a continued expansion of the shadow economy. Second, entrepreneurs may choose to enter the informal sector to test their initial ideas at a lower cost (Estrin et al., 2024; Welter et al., 2015), become accustomed to operating in the informal economy, and only a few of them may decide to transition to the formal sector (Levine & Rubinstein, 2017). Third, the increase in the number of formally registered businesses may include some informal entrepreneurs who transition from the informal to the formal economy (Welter et al., 2015; Williams & Nadin, 2010), but only formally for the purpose of gaining trust from customers and banks when seeking loans (Laing et al., 2022), while most of their business activities remain in the informal sector to benefit from advantages such as tax evasion (Putniņš & Sauka, 2011). Therefore, we emphasize that an increase in the number of formally registered businesses does not necessarily mean a reduction in the size of the shadow economy. On the contrary, this relationship could be reversed and needs to be examined from multiple perspectives, as outlined in the reasons we have provided above. Furthermore, our research findings indicate that during periods of economic downturn, such as the global economic crisis from 2007 to 2009, the positive impact of formal entrepreneurship on the size of the shadow economy is diminished (the regression coefficients of the interaction variables NBD×CRISIS are negative and statistically significant in models (7), (8), and (9) as shown in Table 7.
4.2 The Impact of Economic Freedom on the Size of the Shadow Economy
First, economic freedom and its two sub-components, business freedom and trade freedom, show consistent evidence of reducing the size of the shadow economy. The regression coefficients for the variables ECOF, BUSF, and TRAF in models (7), (8), and (9) in Table 7 are negative and statistically significant. This result aligns with our expectations and is consistent with most previous studies (Bayar & Öztürk, 2019; Berdiev et al., 2018; Farzanegan et al., 2020; Freytag et al., 2022; Goel et al., 2020). This indicates that economic freedom, characterized by easy market access and a favorable business environment, including the reduction of legal barriers, simplified administrative procedures, and lower market entry costs, makes it easier for businesses to register and operate in the formal economy, thereby reducing the motivation to participate in the shadow economy (Autio & Fu, 2015; Sweidan, 2017). Furthermore, improved economic freedom implies better institutional quality (Lee et al., 2011; Levie & Autio, 2011). This encourages entrepreneurs operating in the informal sector to transition to the formal sector, either fully or partially, to formalize their business activities (Autio & Fu, 2015; Saunoris & Sajny, 2017; Welter et al., 2015; Williams & Nadin, 2010), which reduces the size of the shadow economy. More specifically, the study shows that promoting business freedom by minimizing regulations on procedures and administrative costs, limiting bribery and favoritism, and reducing restrictions at all stages of the business life cycle from establishment and operation to dissolution helps lower the operational costs in the formal sector, encouraging potential entrepreneurs to register formally and reducing the size of the shadow economy (Berdiev et al., 2018; D’Agostino et al., 2023; Navickas et al., 2019). Similarly, the study finds that promoting trade freedom through eliminating or reducing trade protection measures, such as technical barriers and tariffs, encourages potential entrepreneurs to establish formal businesses instead of engaging in illegal activities (Berdiev et al., 2018). However, our study finds that the effect of overall economic freedom (including business freedom and trade freedom) in reducing the size of the shadow economy weakens during periods of economic crisis, such as the global economic crisis of 2007–2009. Specifically, the regression coefficients of the interaction terms ECOF×CRISIS, BUSF×CRISIS, and TRAF×CRISIS are positive and statistically significant in models (7), (8), and (9) in Table 7. This result implies that during periods of economic crisis, policies aimed at promoting economic freedom may be less effective in controlling the shadow economy.
Second, economic freedom and its two sub-components, business freedom and trade freedom, consistently reduce the positive relationship between formal entrepreneurship and the size of the shadow economy. The regression coefficients of the interaction terms NBD×ECOF, NBD×BUSF, and NBD×TRAF in models (7), (8), and (9) in Table 7 are negative and statistically significant. This finding suggests that in environments with high economic freedom, barriers to formal entrepreneurship, such as complex administrative procedures, high start-up costs, and strict regulations, are minimized. Trade freedom facilitates the smooth flow of goods, creating more opportunities for formal entrepreneurship while reducing costs. This results in improved benefits for entrepreneurs choosing to enter the formal sector (Berggren, 2003). Consequently, the trade-off between benefits and costs in choosing to operate in the formal or informal sector is reduced, leading potential entrepreneurs to decide to operate in the formal economy thus contributing to reducing the size of the shadow economy (Sweidan, 2017).
In summary, our findings indicate that economic freedom and its two sub-components, business freedom and trade freedom, reduce the size of the informal economy. Countries that promote economic freedom policies create a favorable environment for formal entrepreneurship, encouraging the transition of part or all economic activities from the informal sector to the formal sector. More specifically, simplifying legal business procedures, eliminating or significantly reducing protectionist policies such as trade barriers, and enhancing property rights protection will increase the benefits of operating in the formal economy. When this happens, the attractiveness of participating in the shadow economy will decrease, reducing its growth.
Table 7
Results of the Impact of Formal Entrepreneurship and Economic Freedom on the Size of the Shadow Economy, Estimated Using the Two-Step System GMM Method
|
Variables |
Model (7) |
Model (8) |
Model (9) |
|---|---|---|---|
|
SHAE |
SHAE |
SHAE |
|
|
NBD |
2.3247** |
1.8072** |
2.1413*** |
|
(0.9491) |
(0.8210) |
(0.5103) |
|
|
ECOF |
-1.1838* |
||
|
(0.6343) |
|||
|
NBD×ECOF |
-0.5390** |
||
|
(0.2349) |
|||
|
CRISIS |
-5.4110** |
-4.1951*** |
-4.7500** |
|
(2.6595) |
(1.6123) |
(1.8497) |
|
|
NBD×CRISIS |
-0.1221*** |
-0.1381*** |
-0.1096** |
|
(0.0389) |
(0.0470) |
(0.0525) |
|
|
ECOF×CRISIS |
1.2937** |
||
|
(0.6442) |
|||
|
BUSF |
-1.2398*** |
||
|
(0.2945) |
|||
|
NBD×BUSF |
-0.4110** |
||
|
(0.1906) |
|||
|
BUSF×CRISIS |
1.0160** |
||
|
(0.3973) |
|||
|
TRAF |
-0.8810*** |
||
|
(0.2936) |
|||
|
NBD×TRAF |
-0.4610*** |
||
|
(0.1160) |
|||
|
TRAF×CRISIS |
1.1052*** |
||
|
(0.4282) |
|||
|
FDI |
0.0219** |
0.0046 |
0.0040 |
|
(0.0110) |
(0.0218) |
(0.0217) |
|
|
GDPCG |
0.0144 |
0.0243** |
0.0119** |
|
(0.0097) |
(0.0108) |
(0.0052) |
|
|
PS |
-0.2283** |
-0.1982* |
-0.3111*** |
|
(0.0982) |
(0.1154) |
(0.0506) |
|
|
TAXBUR |
0.8920** |
0.2228 |
0.2367 |
|
(0.4169) |
(0.3201) |
(0.3913) |
|
|
_cons |
4.7464 |
7.7989*** |
6.8440*** |
|
(3.6765) |
(1.0356) |
(1.6539) |
|
|
Observations |
125 |
125 |
125 |
|
Sample period |
1995–2018 |
1995–2018 |
1995–2018 |
|
Prob(Chi2) |
0.000 |
0.000 |
0.000 |
|
AR(1) (p-value) |
0.021 |
0.131 |
0.256 |
|
AR(2) (p-value) |
0.581 |
0.257 |
0.625 |
|
Hansen test (p- value) |
0.871 |
0.931 |
0.821 |
Note. *, **, and *** denote statistical significance at the 10%, 5%, and 1% levels, respectively. Values in parentheses represent standard errors. Calculations are based on the dataset and using the Stata software.
4.3 The Impact of Control Variables on the Size of the Shadow Economy
First, foreign direct investment (FDI) shows evidence of increasing the size of the shadow economy, as indicated by the positive and statistically significant coefficient of the FDI variable in model (7) in Table 7. This finding supports the view that FDI leads to an increase in subcontracting activities that fall outside of government regulation (Goel et al., 2020) and exacerbates corruption (Goel & Saunoris, 2014), expanding the size of the shadow economy. This result is consistent with previous studies (Chen et al., 2020; Dang et al., 2023).
Second, GDP per capita growth (GDPCG) is positively related to the size of the shadow economy, as the coefficient of the GDPCG variable is positive and highly statistically significant in models (8), and (9) in Table 7. This result aligns with the findings of Goel et al. (2020). One possible explanation is the existence of the middle-income trap. Although GDP per capita increases, a significant portion of per capita income remains at a low level, which maintains a high size of the shadow economy.
Third, political stability (PS) plays a role in reducing the size of the shadow economy, as evidenced by the negative and statistically significant coefficient of the PS variable in models (7), (8), and (9) in Table 7. This result is in line with previous research (Elbahnasawy et al., 2016; Elgin, 2010; Ouédraogo, 2017; Siddik et al., 2022; Torgler & Schneider, 2009). Thus, in a high-quality institutional environment, the government is more effective in controlling shadow economic activities.
Lastly, the tax burden (TAXBUR) is a factor that increases the size of the shadow economy, as shown by the positive and statistically significant coefficient of the TAXBUR variable in model (7) in Table 7. In other words, individuals tend to participate more in the informal economy when the tax burden they face is high. This finding is consistent with most previous studies (Chen et al., 2020; Dang et al., 2023; Goel et al., 2020; Navickas et al., 2019).
5. Conclusion and Policy Implications
This study aims to evaluate the impact of formal entrepreneurship and economic freedom on the size of the shadow economy in Asian countries. The research sample consists of 22 Asian countries over the period from 1995 to 2018. The study employs reliable panel data estimation methods, including the Fixed Effects Model with robust standard errors method, the Driscoll-Kraay standard errors method, and the two-step system GMM method. After addressing issues such as endogeneity, heteroscedasticity, and autocorrelation (based on the results of the two-step system GMM), the findings reveal that formal entrepreneurship is positively related to the size of the shadow economy, while economic freedom and its two sub-components, business freedom and trade freedom, reduce the size of the shadow economy. Additionally, economic freedom, business freedom, and trade freedom play a moderating role in reducing the positive relationship between formal entrepreneurship and the size of the shadow economy. Furthermore, the study shows that foreign direct investment, GDP per capita growth, and tax burden are factors that increase the size of the shadow economy, while political stability enables governments to better control the size of the shadow economy.
Thus, our study contributes to the ongoing debates regarding the shadow economy in Asian countries in three significant ways. First, our findings show that an increase in the number of formally registered entrepreneurs does not reduce the size of the shadow economy but rather the opposite. We explain this result by highlighting several reasons: while the number of formal start-ups increases, the number of potential entrepreneurs participating in the informal economy grows even more. Informal businesses have become accustomed to operating in a low-cost environment and are reluctant to transition to the formal sector. Additionally, some entrepreneurs may formally register their businesses only to legitimize their activities in the shadow economy without actually shifting their operations to the formal sector. Second, our study demonstrates that overall economic freedom and its two critical components, business freedom (referring to simplified business regulations) and trade freedom (referring to the removal of technical trade barriers and tariffs) have a reducing effect on the size of the shadow economy. Third, the research provides evidence that economic freedom, business freedom, and trade freedom play a moderating role in reducing the positive relationship between formal entrepreneurship and the size of the shadow economy.
Based on the findings of the study, we propose several policy implications as follows: First, government policies promoting entrepreneurship need to be comprehensively evaluated. As the study indicates, an increase in formal entrepreneurship does not necessarily reduce the size of the shadow economy. Therefore, governments should implement various strategies to encourage and regulate formal entrepreneurship effectively to contribute to sustainable economic growth. Second, governments should consider promoting economic freedom, particularly business freedom and trade freedom, as part of their strategy to foster economic growth and control the spread of the shadow economy. This would also contribute to improving government tax revenues.
Limitations and Future Research Directions
We have made efforts to provide a comprehensive evaluation of the impact of formal entrepreneurship and economic freedom on the size of the shadow economy in Asian countries. However, this study has not classified the research sample into two groups of developed and developing countries to assess the differentiated impact. Furthermore, whether excessive economic freedom is truly beneficial for countries has not been evaluated in this study. Therefore, in future research, we suggest that scholars classify the sample into developed and developing countries to assess and compare the effects of entrepreneurship and economic freedom on the size of the shadow economy, which could offer more intriguing insights. Additionally, exploring the nonlinear relationship between economic freedom and the size of the shadow economy would be valuable and highly beneficial for policymakers.
Acknowledgments: This study is part of the research project [Code: CS.2025.A4.007] funded by Saigon University. The authors sincerely thank the anonymous reviewers and the Editor for their insightful feedback and valuable recommendations, which have significantly improved the quality of this manuscript.
References
Achim, M. V., Borlea, S. N., Găban, L. V., & Mihăilă, A. A. (2019). The shadow economy and culture: Evidence in European countries. Eastern European Economics, 57(5), 352–374.
Ajide, F. M., & Ojeyinka, T. A. (2022). Financial development and entrepreneurship: Insights from Africa. Journal of Financial Regulation and Compliance, 30(5), 596–617.
Ali, M., & Bohara, A. K. (2017). How does FDI respond to the size of shadow economy: An empirical analysis under a gravity model setting. International Economic Journal, 31(2), 159–178.
Apostu, S.-A., & Gigauri, I. (2023). Sustainable development and entrepreneurship in emerging countries: Are sustainable development and entrepreneurship reciprocally reinforcing? Journal of Entrepreneurship, Management and Innovation, 19(1), 41–47.
Autio, E., & Fu, K. (2015). Economic and political institutions and entry into formal and informal entrepreneurship. Asia Pacific Journal of Management, 32, 67–94.
Awasthi, R., & Engelschalk, M. (2018). Taxation and the shadow economy: how the tax system can stimulate and enforce the formalization of business activities (World Bank Policy Research Working Paper No. 8391).
Baklouti, N., & Boujelbene, Y. (2020). A simultaneous equation model of economic growth and shadow economy: Is there a difference between the developed and developing countries? Economic Change and Restructuring, 53, 151–170.
Bayar, Y., & Öztürk, O. F. (2019). Economic freedom, globalization, and the shadow economy in the European Union transition economies: A panel cointegration analysis. Organizations and Markets in Emerging Economies, 10(2), 378–391.
Beck, N., & Katz, J. N. (1995). What to do (and not to do) with time-series cross-section data. American Political Science Review, 89(3), 634–647.
Berdiev, A. N., & Saunoris, J. W. (2018). Does globalisation affect the shadow economy? The World Economy, 41(1), 222–241.
Berdiev, A. N., Saunoris, J. W., & Schneider, F. (2018). Give me liberty, or I will produce underground: Effects of economic freedom on the shadow economy. Southern Economic Journal, 85(2), 537–562.
Berggren, N. (2003). The benefits of economic freedom: A survey. The Independent Review, 8(2), 193–211.
Bruhn, M. (2011). License to sell: The effect of business registration reform on entrepreneurial activity in Mexico. The Review of Economics and Statistics, 93(1), 382–386.
Buehn, A., & Farzanegan, M. R. (2012). Smuggling around the world: Evidence from a structural equation model. Applied Economics, 44(23), 3047–3064.
Capasso, S., & Jappelli, T. (2013). Financial development and the underground economy. Journal of Development Economics, 101, 167–178.
Chen, H., Schneider, F., & Sun, Q. (2020). Measuring the size of the shadow economy in 30 provinces of China over 1995–2016: The MIMIC approach. Pacific Economic Review, 25(3), 427–453.
D’Agostino, E., De Benedetto, M. A., & Sobbrio, G. (2023). Does the economic freedom hinder the underground economy? Evidence from a cross-country analysis. Economia Politica, 40(1), 319–341.
Dang, B. K. (2024). The Impact of Economic Freedom and International Tourism on International Trade: An Empirical Study in Asian Countries. Organizations and Markets in Emerging Economies, 15(2 (31), 267–273.
Dang, B. K., & Phan, A. D. B. (2022). The impact of economic freedom on the risk-taking behaviours of Vietnamese commercial banks. International Journal of Monetary Economics and Finance, 15(4), 353–373.
Dang, V. C., Nguyen, Q. K., & Tran, X. H. (2023). Corruption, institutional quality and shadow economy in Asian countries. Applied Economics Letters, 30(21), 3039–3044.
Driscoll, J. C., & Kraay, A. C. (1998). Consistent covariance matrix estimation with spatially dependent panel data. Review of Economics and Statistics, 80(4), 549–560.
Elbahnasawy, N. G., Ellis, M. A., & Adom, A. D. (2016). Political instability and the informal economy. World Development, 85, 31–42.
Elgin, C. (2010). Political turnover, taxes and the shadow economy (Working Papers 2010/0. Bogazici University, Department of Economics).
Elgin, C., Kose, M. A., Ohnsorge, F., & Yu, S. (2021). Understanding informality (CAMA Working Paper 76/2021. Australian National University).
Estrin, S., Guerrero, M., & Mickiewicz, T. (2024). A framework for investigating new firm entry: The (limited) overlap between informal-formal and necessity-opportunity entrepreneurship. Journal of Business Venturing, 39(4), 106404. https://doi.org/https://doi.org/10.1016/j.jbusvent.2024.106404
Estrin, S., & Mickiewicz, T. (2012). Shadow economy and entrepreneurial entry. Review of Development Economics, 16(4), 559–578.
Farzanegan, M. R., Hassan, M., & Badreldin, A. M. (2020). Economic liberalization in Egypt: A way to reduce the shadow economy? Journal of Policy Modeling, 42(2), 307–327.
Freytag, A., Schneider, F., & Spiegel, S. E. (2022). The Influence of Economic Freedom on the Shadow Economy in Developed and Developing Countries. The Economists’ Voice, 19(2), 183–205.
Fund, I. M. (2021). World Economic Outlook Database, October 2021. https://www.imf.org/en/Publications/WEO/weo-database/2021/October
Ghazy, N., Ghoneim, H., & Lang, G. (2022). Entrepreneurship, productivity and digitalization: Evidence from the EU. Technology in Society, 70, 102052. https://doi.org/https://doi.org/10.1016/j.techsoc.2022.102052
Ginevicius, R., Kliestik, T., Stasiukynas, A., & Suhajda, K. (2020). The impact of national economic development on the shadow economy. Journal of Competitiveness, 12(4), 39–55.
Goel, R. K., Ram, R., Schneider, F., & Potempa, A. (2020). International movements of money and men: Impact on the informal economy. Journal of Economics and Finance, 44, 179–197.
Goel, R. K., & Saunoris, J. W. (2014). Global corruption and the shadow economy: Spatial aspects. Public Choice, 161, 119–139.
Gujarati, D. N., & Porter, D. C. (2009). Basic econometrics. McGraw-Hill.
Hemmert, M., Cross, A. R., Cheng, Y., Kim, J.-J., Kotosaka, M., Waldenberger, F., & Zheng, L. J. (2022). New venture entrepreneurship and context in East Asia: A systematic literature review. Asian Business & Management, 21(5), 831–865. https://doi.org/10.1057/s41291-021-00163-1
Huynh, C. M., Nguyen, V. H. T., Nguyen, H. B., & Nguyen, P. C. (2020). One-way effect or multiple-way causality: Foreign direct investment, institutional quality and shadow economy? International Economics and Economic Policy, 17, 219–239.
Imamoglu, H. (2021). The role of financial development on the underground economy in regards to Europe’s 2020 strategy. Economic Systems, 45(2), 100768.
Irwin, D. A. (2024). Does Trade Reform Promote Economic Growth? A Review of Recent Evidence. The World Bank Research Observer. https://doi.org/10.1093/wbro/lkae003
Kaplan, D. S., Piedra, E., & Seira, E. (2011). Entry regulation and business start-ups: Evidence from Mexico. Journal of Public Economics, 95(11-12), 1501–1515.
Khan, S., Abdul Hamid, B., & Rehman, M. Z. (2021). Determinants of shadow economy in OIC and non-OIC countries: The role of financial development. International Journal of Emerging Markets, 18(11), 3373–3393.
Khan, S., Abdul Hamid, B., & Rehman, M. Z. (2023). Determinants of shadow economy in OIC and non-OIC countries: The role of financial development. International Journal of Emerging Markets, 18(10), 3373-3393. https://doi.org/10.1108/IJOEM-02-2020-0193
Kolm, A.-S., & Larsen, B. (2006). Wages, unemployment, and the underground economy. In J. Agell, & P. Birch Sørensen (Eds.), Tax Policy and Labor Market Performance (pp. 283-311). MIT press, Cambridge, Massachusetts.
Koyuncu, J. Y., & Ünal, H. S. (2019). The impact of economic freedom on the shadow economy: Panel analysis. Sosyal Bilimler Metinleri, 2019(2), 35–46.
Laing, E., van Stel, A., & Storey, D. J. (2022). Formal and informal entrepreneurship: A cross-country policy perspective. Small Business Economics, 59(3), 807–826. https://doi.org/10.1007/s11187-021-00548-8
Lee, S.-H., Yamakawa, Y., Peng, M. W., & Barney, J. B. (2011). How do bankruptcy laws affect entrepreneurship development around the world? Journal of Business Venturing, 26(5), 505–520.
Levie, J., & Autio, E. (2011). Regulatory burden, rule of law, and entry of strategic entrepreneurs: An international panel study. Journal of Management Studies, 48(6), 1392–1419.
Levine, R., & Rubinstein, Y. (2017). Smart and illicit: who becomes an entrepreneur and do they earn more? The Quarterly Journal of Economics, 132(2), 963–1018.
Lyulyov, O., Paliienko, M., Prasol, L., Vasylieva, T., Kubatko, O., & Kubatko, V. (2021). Determinants of shadow economy in transition countries: Economic and environmental aspects. International Journal of Global Energy Issues, 43(2-3), 166–182.
McKinsey. (2019a). Asia’s future is now. https://www.mckinsey.com/featuredinsights/asia-pacific/asias-future-is-now
McKinsey. (2019b). The future of Asia. https://www.mckinsey.com/featured-insights/asia-pacific/the-future-of-asia-asian-flows-and-networks-are-defining-the-next-phase-of-globalization?cid=other-eml-alt-mgi-mck&hlkid=d683814171c644e7bf9ebb5fa1c5db82&hctky=2566129&hdpid=43
Mróz, B. (2012). Entrepreneurship in the shadow: Faces and variations of Poland’s informal economy. International Journal of Economic Policy in Emerging Economies, 5(3), 197–211.
Navickas, M., Juščius, V., & Navickas, V. (2019). Determinants of shadow economy in Eastern European countries. Scientific Annals of Economics and Business, 66(1), 1–14.
Nguyen, C. P. (2022). Does economic complexity matter for the shadow economy? Economic Analysis and Policy, 73, 210–227.
Nguyen, P. C., & Su, D. T. (2020). Financial development and the shadow economy: A multi-dimensional analysis. Economic Analysis and Policy, 67, 37–54.
Ouédraogo, I. M. (2017). Governance, corruption, and the informal economy. Modern Economy, 8(2), 256–271.
Piątek, D., Szarzec, K., & Pilc, M. (2013). Economic freedom, democracy and economic growth: A causal investigation in transition countries. Post-Communist Economies, 25(3), 267–288.
Putniņš, T. J., & Sauka, A. (2011). Size and determinants of shadow economies in the Baltic States. Baltic Journal of Economics, 11(2), 5–25.
Rahman, S. U., FAISAL, F., Ali, A., Sulimany, H. G. H., & Bazhair, A. H. (2023). Do Financial Technology and Financial Development Lessen Shadow Economy? The Quarterly Review of Economics and Finance, 90, 201–210.
Ramli, I. M., Waskitho, T., & Kasih, M. C. (2023). The Interplay of IPEF Between RCEP and CPTPP: An ASEAN Viewpoint. In M. Bungenberg, M. Chi, S. Jusoh, P. Ranjan, & I. Rustambekov (Eds.), Asian Yearbook of International Economic Law 2023 (pp. 135–151). Springer Nature Switzerland. https://doi.org/10.1007/16517_2023_23
Ratten, V. (2023). Entrepreneurship: Definitions, opportunities, challenges, and future directions. Global Business and Organizational Excellence, 42(5), 79–90.
Roodman, D. (2009). A note on the theme of too many instruments. Oxford Bulletin of Economics and Statistics, 71(1), 135–158.
Sani, A., & Jamil, H. (2022). Entrepreneurship curriculum practice in Malaysian universities: Successes and challenges. International Journal of Applied Management Science, 14(2), 160–170.
Santiago, R., Fuinhas, J. A., & Marques, A. C. (2020). The impact of globalization and economic freedom on economic growth: The case of the Latin America and Caribbean countries. Economic Change and Restructuring, 53(1), 61-85. https://doi.org/10.1007/s10644-018-9239-4
Saunoris, J. W., & Sajny, A. (2017). Entrepreneurship and economic freedom: Cross-country evidence from formal and informal sectors. Entrepreneurship & Regional Development, 29(3–4), 292–316.
Schneider, F., & Buehn, A. (2012). Shadow economies in highly developed OECD countries: What are the driving forces? (IZA Discussion Paper No. 6891. Center for Economic Studies and Ifo Institute for Economic Research, Institute for the Study of Labor).
Schneider, F., Buehn, A., & Montenegro, C. E. (2011). Shadow economies all over the world: New estimates for 162 countries from 1999 to 2007. In Handbook on the shadow economy. Edward Elgar Publishing.
Siddik, M. N. A., Kabiraj, S., Hosen, M. E., & Miah, M. F. (2022). Impacts of political stability on shadow economy: Evidence from Bay of Bengal initiative for multi-sectoral technical and economic cooperation countries. Vision, 26(2), 221–231.
Sweidan, O. (2017). Economic freedom and the informal economy. Global Economy Journal, 17(4), 20170002.
Tiutiunyk, I., Cieśliński, W., Zolkover, A., & Vasa, L. (2022). Foreign direct investment and shadow economy: One-way effect or multiple-way causality? Journal of International Studies (2071-8330), 15(4), 196–212.
Torgler, B., & Schneider, F. (2009). The impact of tax morale and institutional quality on the shadow economy. Journal of Economic Psychology, 30(2), 228–245.
Tran Pham, T. K. (2023). Does government effectiveness moderate public spending on education–shadow economy nexus in ASEAN countries? Annals of Public and Cooperative Economics, 95(3), 761–781.
Tumen, S. (2017). Entrepreneurship in the shadows: Wealth constraints and government policy. Economics of Transition, 25(2), 239–269.
Webb, J. W., Bruton, G. D., Tihanyi, L., & Ireland, R. D. (2013). Research on entrepreneurship in the informal economy: Framing a research agenda. Journal of Business Venturing, 28(5), 598–614.
Welter, F., Smallbone, D., & Pobol, A. (2015). Entrepreneurial activity in the informal economy: A missing piece of the entrepreneurship jigsaw puzzle. Entrepreneurship & Regional Development, 27(5-6), 292–306.
Williams, C. C., Martinez–Perez, A., & Kedir, A. M. (2017). Informal entrepreneurship in developing economies: The impacts of starting up unregistered on firm performance. Entrepreneurship Theory and Practice, 41(5), 773–799.
Williams, C. C., & Nadin, S. (2010). Entrepreneurship and the informal economy: An overview. Journal of Developmental Entrepreneurship, 15(04), 361–378.
Wiseman, T. (2015). Entrepreneurship, corruption, and the size of US underground economies. Journal of Entrepreneurship and Public Policy, 4(3), 313–330.
Wu, D. F., & Schneider, M. F. (2019). Nonlinearity between the shadow economy and level of development. (IZA Discussion Papers, No. 12385. Institute of Labor Economics (IZA), Bonn).
Zhanabekov, S. (2022). Robust determinants of the shadow economy. Bulletin of Economic Research, 74(4), 1017–1052.