Organizations and Markets in Emerging Economies ISSN 2029-4581 eISSN 2345-0037
2025, vol. 16, no. 2(33), pp. 270–288 DOI: https://doi.org/10.15388/omee.2025.16.11
FDI Spillovers in Emerging Markets: Does Economic Policy Uncertainty and Geopolitical Risk Matter?
Damien Kunjal (corresponding author)
University of KwaZulu-Natal, South Africa
KunjalD@ukzn.ac.za
https://ror.org/04qzfn040
Linah Mutemeri
University of KwaZulu-Natal, South Africa
https://ror.org/04qzfn040
Yuthika Naidoo
University of KwaZulu-Natal, South Africa
https://ror.org/04qzfn040
Saien Moodley
University of KwaZulu-Natal, South Africa
https://ror.org/04qzfn040
Tharosha Reddy
University of KwaZulu-Natal, South Africa
https://ror.org/04qzfn040
Keshav Govender
University of KwaZulu-Natal, South Africa
https://ror.org/04qzfn040
Wendile Msomi
University of KwaZulu-Natal, South Africa
Abstract. This study investigates the influence of economic policy uncertainty (EPU) and geopolitical risk (GPR) on the spillovers of foreign direct investment (FDI) within emerging markets, represented by the BRICS (Brazil, Russia, India, China, and South Africa) nations. Using a Time-Varying Parameter Vector Autoregressive (TVP-VAR) model and a dynamic Diebold and Yilmaz (DY) (2012) spillover index, the research assesses the interconnectedness and spillover effects of FDI flows among the BRICS countries over a 25-year period (1998–2023). The findings reveal significant spillover effects in the FDI of the BRICS nations, with Russia being a net transmitter and China a net receiver. Moreover, EPU and GPR significantly influence these FDI spillovers, with the effect of GPR being more predominant, highlighting the increased sensitivity of emerging markets to economic and geopolitical risks. Therefore, these findings underscore the role of coordinated policy measures in mitigating systemic risks and enhancing resilience against geopolitical and economic shocks. Overall, this study represents a novel contribution to existing literature by providing insight into the impacts of economic policy and geopolitical uncertainties on spillovers of foreign financial flows in emerging markets, particularly the BRICS nations.
Keywords: economic policy uncertainty, foreign direct investment, geopolitical risk, interconnectedness
Received: 24/1/2025. Accepted: 20/8/2025
Copyright © 2025 Damien Kunjal, Linah Mutemeri, Saien Moodley, Tharosha Reddy, Keshav Govender, Wendile Msomi. Published by Vilnius University Press. This is an Open Access article distributed under the terms of the Creative Commons Attribution Licence, which permits unrestricted use, distribution, and reproduction in any medium, provided the original author and source are credited.
1. Introduction
A defining development of the 21st century pivots around the transformation of BRICS (Brazil, Russia, India, China and South Africa), an intergovernmental organisation of major emerging economies. The aim of their formation in 2009 (updated in 2010 to include South Africa) was to encourage a more equitable distribution of global power, and the promotion of economic coordination and financial development (Stuenkel, 2020). The diverse investment landscapes of the BRICS nations have contributed to the recent rapid growth of their economies, highlighting the significant potential for global economic reform (Vyas-Doorgapersad, 2022).
The economic policy and geopolitical uncertainties of numerous countries have increased in recent years as a result of the increasing complexities of international economic conditions and FDIs. Economic Policy Uncertainty (EPU) is the economic risk that is associated with the irregular nature of the intensity and direction of economic policies that will be constructed by the government in the future. There has been a drastic increase in economic policy uncertainty in recent times, which is caused by countries being forced to regularly adjust their economic policies to account for the escalation of trade protectionism, trade and economic frictions, and the severe challenges caused by the COVID-19 outbreak and other crises (An et al., 2022). The EPU of countries tend to have a significantly negative effect on investments as uncertainty results in unpredictable investment and market prospects. Thus, investors’ behaviour will vary in local and foreign investments in the hope of mitigating the risk of loss (Kong et al., 2022).
Geopolitical risks (GPRs) are the risks associated with warfare, terrorism, and disputes both within and between countries and have escalated in recent years. Recent examples of GPRs include the Russia–Ukraine conflict and the Israel–Palestine conflict (Li et al., 2024). Typically, each nation adheres to a different set of policy reforms set out by their government. However, regional conflicts, policy reforms, or shifts in political ideologies can significantly affect the flow of foreign finances, thereby affecting the economic growth prospects of a nation (Alper, 2018). Furthermore, heightened economic policy and geopolitical uncertainties may increase the risk premium for foreign investments, resulting in a higher cost of finance and increased caution when undertaking investments in BRICS nations (Christiano et al., 2014).
These two variables of interest (EPU and GPR) are crucial as BRICS countries are interconnected, indicating that economic policy and geopolitical uncertainties may restrain the flow of FDI due to regulatory differences (An et al., 2022). However, existing literature on FDI spillovers across the BRICS nations remains limited. Furthermore, to the knowledge of the authors, this is the first study that investigates the effects of economic policy uncertainty and geopolitical risk on the spillovers of FDI across the BRICS nations. Therefore, this study represents a novel contribution to existing literature by providing insight into the impacts of economic and geopolitical uncertainties on spillovers of foreign financial flows in emerging markets, particularly the BRICS nations. Hence, the results of this study have important implications for various stakeholders, including investors, multinational corporations, policymakers and governments.
This study is structured as follows: Section 2 reviews the existing literature, while Section 3 discusses the data and methodology. Section 4 presents the results of the study, and Section 5 concludes the research.
2. Literature Review
2.1. Theoretical Framework
Economic integration is central to understanding the spillover effects within the BRICS group. According to Balassa’s (1961) Theory of Economic Integration, deeper economic linkages, such as trade liberalisation, investment cooperation, and policy coordination, lead to significant economic spillovers. These spillovers arise as countries experience shared benefits from growth-enhancing activities, such as trade complementarities, productivity gains, and technological advancements (Balassa, 1961). As the BRICS countries pursue trade agreements and reduce trade barriers, the group benefits from spillovers that lead to increased growth and economic development.
From an endogenous growth perspective, Romer’s (1990) model of endogenous growth suggests that FDI plays a pivotal role in generating long-term economic growth by facilitating the transfer of technology, managerial expertise, and skills across borders. In the context of BRICS, these countries benefit not only from capital inflows but also from technology and productivity spillovers that arise from investments in high-growth industries. The Product Cycle Theory provides insight into how FDI can generate spillovers as foreign investments move from innovation-based economies (such as China) to less-developed members within BRICS, such as South Africa, contributing to their industrialization and technological progress (Maryam & Mittal, 2020).
Moreover, trade theory, particularly Ricardo’s Theory of Comparative Advantage, highlights the importance of specialisation and trade in creating spillover effects (Olawumi, 2019). By specialising in sectors with a comparative advantage, BRICS members can increase efficiency and economic output, leading to mutual benefits. For example, Brazil’s specialisation in agricultural exports, China’s dominance in manufacturing, and India’s strength in information technology create interdependencies that enhance overall economic performance within the group. Similarly, the Heckscher-Ohlin model (1933) explains how BRICS members leverage their factor endowments such as labour, capital, and natural resources to generate trade spillovers that enhance growth (Olawumi, 2019). This model underscores how the diverse economic structures of BRICS countries create strong trade complementarities, facilitating the spillover of economic benefits across member states.
Theories of financial interdependence and integration offer another important lens to examine spillovers within BRICS. Mundell’s (1961) Theory of Optimal Currency Areas suggests that financial integration among member countries can enhance economic stability and more efficient capital flows. In the case of BRICS, financial cooperation initiatives such as the New Development Bank and the Contingent Reserve Arrangement have fostered closer financial integration and reduced transaction costs for cross-border investments. These institutions serve as mechanisms to manage financial risks and ensure access to capital during financial turbulence, promoting foreign financial inflows and supporting economic growth (Prasad et al., 2021).
Notably, theories of economic asymmetry warn that not all BRICS members may benefit equally from spillovers. Dependency theory (Prebisch, 1950) suggests that less-developed economies may face disadvantages when integrated with more powerful economies, leading to uneven distribution of benefits. In the case of BRICS, China’s economic dominance may create asymmetries in how spillovers are distributed, with smaller economies like South Africa potentially experiencing fewer gains (Agarwal & Kumar, 2023).
2.2 Empirical Review
The investigation of financial market spillovers has become a widely debated issue in financial economics. Previous literature has shown that economic shocks in one BRICS nation can significantly impact financial markets, trade flows, and investment patterns in the others (Nach & Ncwadi, 2024). Gilenko and Fedorova (2014) employed a 4-dimensional BEKK-GARCH-in-mean model to estimate both internal and external spillover effects among the BRIC countries, revealing substantial variations in spillover effects across different economic phases, including pre-crisis, crisis, and recovery periods. During the pre-crisis phase, the study found that while spillovers were statistically significant, they were relatively low in magnitude. This underscores the importance of economic conditions in understanding the interconnectedness of the BRICS markets.
Jadhav (2012) examined how economic, institutional, and political factors influenced FDIs within BRICS economies, and found that economic factors like market size and trade openness were more significant than institutional and political factors in attracting FDI. Market size, measured by real GDP, was the strongest determinant, suggesting that investments were primarily market-seeking. While trade openness had a positive effect, natural resource availability negatively impacted FDI, indicating that resource-seeking was less of a motive in the BRICS economies.
In another study, Diebold and Yilmaz (2012) employed a dynamic spillover index to capture the interconnectedness of BRICS economies, emphasising the significant role that Brazil and China play in transmitting shocks to other members. Similarly, Adekoya et al. (2021) found that financial market volatility in China has far-reaching implications for FDI inflows to South Africa, Brazil, and Russia. Furthermore, Zhang and Hamori (2022) found that during the COVID-19 pandemic, joint connectedness among the BRICS economies was more pronounced than during the 2007–2008 global financial crisis.
Geopolitical tensions and economic disruptions led to fluctuations in the BRICS stock markets, making research on spillover effects essential for recovery. Specifically, Li et al. (2024) assessed the impact of economic policy uncertainty and geopolitical risks on the BRICS stock markets, revealing bidirectional and asymmetric spillover effects. The Russian, Brazilian, Indian, and South African stock indices were risk conveyors, while the Shanghai Composite Index and geopolitical risks were risk inheritors (Li et al., 2024).
In addition, Bekiros et al. (2020) investigated the impact of global uncertainty on FDI inflows to emerging markets, including the BRICS countries. Their findings suggest that heightened economic uncertainty — such as trade tensions and fluctuating commodity prices — lead to a decline in FDI, particularly in resource-dependent economies like Brazil and Russia. This aligns with recent empirical evidence that suggests economic policy uncertainty can deter foreign investment, as it raises risks and lowers investor confidence (Baker et al., 2016). In addition, studies have shown that geopolitical risk can hinder economic growth, reduce private sector lending, and diminish FDI (Asomaning et al., 2024).
Recent studies have explored various dimensions of FDI within the BRICS economies, offering important yet distinct insights. For instance, Ali et al. (2023) highlight the role of FDI in fostering technological innovation, noting that its success is largely contingent on the absorptive capacity of host nations. While this underscores the developmental potential of FDI, it overlooks the dynamic interlinkages shaped by external uncertainties. Similarly, Tsaurai (2017) investigates the factors influencing FDI in BRICS, concluding that economic and political stability are essential determinants. However, Tsaurai’s approach remains static and does not account for evolving spillover dynamics under uncertainty. Hu (2021) provides a different angle, focusing on human capital spillovers in the context of the Fourth Industrial Revolution, yet the study remains silent on the disruptive effects of policy and geopolitical instability on FDI transmission. Nistor (2015) emphasizes the growth-enhancing potential of FDI in BRICS, particularly through sectoral diversification, but does not delve into how such growth might be impeded or redirected by global risk factors.
Additionally, Gammeltoft (2008) discusses the rise of outward FDI from the BRICS multinationals, contributing to the understanding of BRICS as global investors, whereas our focus is on inward and intra-BRICS spillovers affected by uncertainty. Bose and Kohli (2018) offer a historical overview of FDI trends, attributing shifts to economic liberalization; however, their analysis is limited to descriptive trends without modeling the dynamic nature of investment flows. In contrast to these studies, our research extends the literature by employing a time-varying analytical framework — the TVP-VAR model and Diebold-Yilmaz spillover index — to examine how economic policy uncertainty and geopolitical risk shape the interconnectedness of FDI across the BRICS countries over time. This dynamic perspective allows us to uncover the systemic transmission mechanisms of FDI under uncertainty, an area that remains underexplored in existing empirical work.
In conclusion, the empirical literature reviewed in this section highlights the significant interdependencies among the BRICS countries, with economic, financial, and geopolitical shocks in one nation often transmitting to others. The application of advanced econometric models has provided deeper insights into the dynamic nature of these relationships, particularly in the context of foreign financial flows, FDI, and market volatility. These findings lay the groundwork for further analysis of spillover effects within the BRICS framework, offering valuable lessons for policymakers aiming to navigate these complex economic interconnections.
3. Data and Methodology
3.1 Data
To achieve the objectives of this study, a twenty-five-year sample period is chosen from 1998 to 2023. To maintain comparability between countries, the data are rescaled to an annual frequency where necessary, and all data are converted to first differences. Furthermore, Makrelov et al. (2023) support the use of annual data analysis by claiming that annual data eliminate the noise found in monthly data. The net inflows for each BRICS country are used as a measure of their respective foreign financial flows or FDI. This data is quoted annually and are obtained from the World Bank Open Database.
EPU is proxied by the World Uncertainty Index (WUI), which was created by Ahir et al. (2018). According to studies by Hong et al. (2024), Olalere and Mukuddem-Peterson (2024), Zaria and Tuyon (2023) and Javed et al. (2023), the WUI has been broadly used as a proxy for economic uncertainties. The WUI is based on the frequency of the term “uncertainty” within the Economist Intelligence Unit (EIU) reports of each country (Msomi & Kunjal, 2024). Additionally, this index is unique to other EPU measures as it employs a standardised process and structure that focuses on an individual data source (EIU reports), which concentrates on economic and political developments (Ahir et al., 2022). For geopolitical risk, Caldara and Iacoviello (2022) created the Geopolitical Risk (GPR) index which captures the geopolitical uncertainties of different countries. This index is constructed based on the frequency of articles discussing unfavourable geopolitical circumstances in prominent newspapers in Canada, the United Kingdom and the United States. An increase in the WUI and GPR indices suggests an increase in economic policy and geopolitical uncertainty levels, respectively.
3.2 Methodology
In finance literature, the Vector Autoregressive (VAR) model is widely used to analyse associations between time series data. However, recent research suggests that the traditional VAR model is insufficient for the study of numerous economic variables. The Time-Varying Parameter VAR (TVP-VAR) model, introduced by Primiceri (2005), aimed at overcoming the difficulties faced by the traditional VAR model, by encapsulating the time-varying nature of primary structures of real economies in a robust and flexible manner (An et al., 2022). Research conducted by Zhou (2022) outlined the success of the TVP-VAR model in exploring the spillover effects between different macroeconomic variables. Further studies by Nakajima (2011), Gabauer and Gupta (2018), Zhou et al. (2020) and He et al. (2018) provide evidence of the superiority of the TVP-VAR model in capturing an economy’s dynamic structure. Therefore, the TVP-VAR model is selected to achieve the objectives of the current study.
The reduced TVP-VAR(p) model is written as:
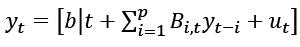 (1)
(1)
where bt is an n × 1 matrix of time-varying coefficients, Bi,t is an n × n matric of time-varying coefficients, and ut ~ N(0, Σt).
Equation (1) can be rewritten in block form as:
yt = [X│tβt + ut ] (2)
where Xt = In ⊗[1, yt–1, ..., yt–p ] and 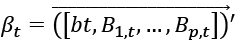
βt is assumed to follow an independent random walk:
βt = βt–1 + ut, ut ∼ N(0, Q) (3)
where β0 is regarded as an unknown parameter and Q as a diagonal matrix with qi representing the main diagonal elements (Korobilis & Yilmaz, 2018). In accordance with Chan et al. (2019), the variance-covariance matrix has been simplified as:
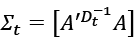 (4)
(4)
“A” represents a matrix and  is a diagonal matrix consisting of non-zero elements (hi,t ). These non-zero elements are approximated by:
 (5)
(5)
where h0 represents an unknown parameter (Milas et al., 2024).
The model is estimated over the 1998 to 2023 period using 𝑝 = 2 lags, selected based on the Akaike Information Criterion. To estimate the model, the Gibbs sampling algorithm is used, which follows the methodology outlined by Chan et al. (2019) and builds on the earlier work of Primiceri (2005). A total of 5000 burn-in iterations is first run and discarded to allow the Markov Chain to stabilise. Then, the posterior distributions are constructed from a sample of 5000 draws. For the selection of prior distributions, the following settings were used:
The prior for the time-varying coefficient 𝛽₀ is 𝑁 (0, 5), with a prior scaling factor (tau₀) of 5.0.
The variance-covariance matrix Q is assumed to follow an inverse gamma distribution IG (1,1), with a prior scaling factor (τ2) of 0.01 and 5 degrees of freedom (ν2). The variance of the stochastic volatility component (S) also follows an inverse gamma distribution IG (1,1), with a prior scaling factor (τ1) of 1.0 and 7 degrees of freedom (ν1). For the initial stochastic volatility level ℎ₀, the prior is 𝑁 (0.01, 0.05).
β0 ~ N(0,5)
qi ~ IG(1,1)
h2i , j ~ IG(1,1)
h0 ~ N(0.01,0.05)
Thereafter, in order to analyse the systematic spillovers of economic policy and geopolitical uncertainties on foreign financial flows in the BRICS group, a dynamic spillover index framework, namely the DY model created by Diebold and Yilmaz (2012) is applied in this study. This model centres around the generalised forecast error variance decomposition (GFEVD), which is computed using a generalised N-variables VAR model, using Cholesky factor orthogonalisation (Zhang et al., 2021). The DY Model measures both directional and aggregate volatility spillovers in accordance with the following process.
The weakly stationary VAR(k) with N variables is considered first:
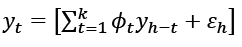 (6)
(6)
where ϕ = (1, 2, ..., k) is an N × N parameter matrix and ε is an independent, identically distributed disturbance term.
The following equation represents the moving average:
 (7)
(7)
where A0 is the coefficient matrix that represents the identity matrix of N x N. If i < 0, At = 0, but if i > 0, then At satisfies the following recursive equation:
At = ϕ1 At–1 + ϕ2 At–2 + ... + ϕk At-k (8)
The DY model computes the H-step-ahead GFEVD as:
 (9)
(9)
 represents the portion from the jth variable in the net prediction variance of the ith variable.
  is the standard deviation of the jth error term.
The spillover index calculation adapted in this analysis is described as:
 (10)
(10)
The net spillover index involves the subtraction of the ‘From’ spillover index from the ‘To’ spillover index, as follows:
 (11)
(11)
where 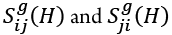 are the directional spillovers to market i from all other markets j and to all other markets j from market i, respectively (Kayral & Tandogan, 2020).
4. Results and Analysis
4.1 Preliminary Analysis
Table 1
Summary of Descriptive Statistics
|
BRAZIL_FDI |
CHINA_FDI |
INDIA_FDI |
RUSSIA_FDI |
SA_FDI |
GEPU |
GPR |
|
|---|---|---|---|---|---|---|---|
|
Mean |
0.0320 |
-0.0026 |
0.0946 |
0.0564 |
0.0733 |
0.0136 |
0.04206 |
|
Median |
-0.0164 |
0.1113 |
0.1598 |
0.1649 |
-0.0849 |
-0.0201 |
0.1040 |
|
Maximum |
11.7306 |
11.9371 |
1.0135 |
1.5578 |
2.5567 |
1.0055 |
0.4123 |
|
Minimum |
-11.6141 |
-13.0062 |
-0.5761 |
-1.2740 |
-2.3479 |
-0.4125 |
-0.4313 |
|
Std. Dev. |
3.3918 |
3.7534 |
0.3536 |
0.8232 |
1.2622 |
0.2487 |
0.2291 |
|
Skewness |
0.0243 |
-0.4035 |
0.2685 |
-0.0793 |
0.3913 |
2.4597 |
-0.2840 |
|
Kurtosis |
12.1758 |
10.7317 |
3.2882 |
2.3573 |
2.6790 |
11.5359 |
2.3835 |
|
Jarque-Bera |
87.7061 |
62.9478 |
0.3868 |
0.4564 |
0.7452 |
101.106 |
0.7321 |
|
Probability |
0.0000 |
0.0000 |
0.8241 |
0.7960 |
0.6889 |
0.0000 |
0.6935 |
|
Sum |
0.8001 |
-0.0660 |
2.3660 |
1.4103 |
1.8334 |
0.3403 |
1.0514 |
|
Sum Sq. Dev. |
276.1025 |
338.1194 |
3.0005 |
16.2646 |
38.238 |
1.4840 |
1.2599 |
|
ADF t-stat |
-7.5786 |
-3.2479 |
-4.3302 |
-6.3263 |
-4.9651 |
-4.5352 |
-7.2266 |
|
Observations |
25 |
25 |
25 |
25 |
25 |
25 |
25 |
Both tests consistently indicate the presence of cointegrating relationships, with some evidence suggesting up to six cointegrating vectors. This implies that while the variables fluctuate in the short term, they tend to move together in the long run, maintaining equilibrium. This interconnectedness, particularly among FDI flows, GEPU, and GPR across the BRICS countries, reinforces the importance of global spillovers and uncertainties in shaping long-term investment trends.
Table 2
Results of the Johansen Cointegration Tests
|
(Trace) |
(Max-eigenvalue) |
||||||||
|
Hypothesized |
Trace |
0.05 |
Prob.** |
Hypothesized |
Max-Eigen |
0.05 |
Prob.** |
||
|
No. of CE(s) |
Eigenvalue |
Statistic |
Critical Value |
Critical Value |
No. of CE(s) |
Eigenvalue |
Statistic |
Critical Value |
Critical Value |
|
None |
0.983 |
288.99 |
125.62 |
0.000 |
None |
0.983 |
93.225 |
46.231 |
0.000 |
|
At most 1 |
0.935 |
195.76 |
95.75 |
0.000 |
At most 1 |
0.934 |
62.690 |
40.078 |
0.000 |
|
At most 2 |
0.894 |
133.07 |
69.82 |
0.000 |
At most 2 |
0.894 |
51.551 |
33.877 |
0.000 |
|
At most 3 |
0.826 |
81.523 |
47.86 |
0.000 |
At most 3 |
0.826 |
40.244 |
27.584 |
0.000 |
|
At most 4 |
0.578 |
41.280 |
29.80 |
0.002 |
At most 4 |
0.578 |
19.824 |
21.132 |
0.075 |
|
At most 5 |
0.430 |
21.455 |
15.49 |
0.006 |
At most 5 |
0.430 |
12.914 |
14.265 |
0.081 |
|
At most 6 |
0.310 |
8.541 |
3.841 |
0.004 |
At most 6 |
0.310 |
8.541 |
3.841 |
0.004 |
4.2 Main Analysis
The variance decomposition for India’s FDI indicates a different dynamic. Initially, India’s own FDI accounts for 73.87% of the variation, with Brazil and China contributing 20.48% and 5.65%, respectively. Over time, India’s contribution stabilises to around 26.38%, indicating a relatively minimum influence on its own FDI variations. Notably, the contributions from Brazil and China decline over time, suggesting that as India’s FDI evolves, its dependence on external influences diminishes. In South Africa’s case, the variance decomposition starts with a significant contribution from China (54.97%), while Brazil’s FDI accounts for only 0.38%. As periods progress, South Africa’s own FDI contribution increases, rising to 21.20% by the tenth period. However, it is still primarily influenced by China, which remains a dominant player in the FDI dynamics of South Africa throughout the assessed periods.
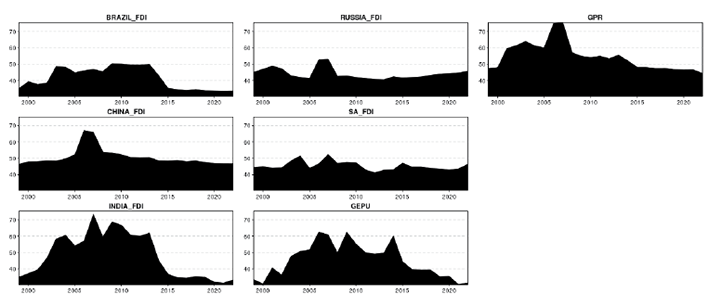
Figure 1
Variance Decomposition of FDI
Overall, the variance decomposition analysis highlights the dynamic interplay between domestic and foreign influences on FDI across the analysed countries. While Brazil’s FDI shows a gradual opening to external influences, India appears more stable with a diminishing dependency on external factors over time. South Africa remains significantly influenced by China, while China’s FDI maintains a strong internal stability. Likewise, Russia’s FDI shows a consistent self-reliance throughout the periods. This analysis underscores the complex nature of FDI flows and the varying degrees of influence exerted by different countries over time. However, a more in-depth analysis is obtained through the estimation of the dynamic DY spillover index.
The dynamic measures extend beyond FDI spillovers to account for the role of external factors like EPU and GPR, which capture how economic and geopolitical risks influence investment flows. EPU has the greatest impact on India’s FDI (6.31) but the least impact on China’s FDI (0.82). GPR has the most impact on Russia’s FDI (32.32) but the smallest impact on South Africa’s FDI (4.21). This is expected given Russia’s volatile geopolitical environment in recent years due to its conflicts with Ukraine and NATO. Overall, a comparison of the effects of EPU and GPR suggests that GPR has a greater impact on the FDI spillovers between the BRICS nations. This indicates that geopolitical tensions and risks in these countries may deter foreign investments or redirect them towards more politically stable regions.
Table 3
Dynamic Connectedness Matrix Table
|
BRAZIL_FDI |
CHINA |
INDIA |
RUSSIA |
SA _FDI |
GEPU |
GPR |
FROM |
|
|---|---|---|---|---|---|---|---|---|
|
BRAZIL_FDI |
58.51 |
3.91 |
17.71 |
7.03 |
1.38 |
1.98 |
9.47 |
41.49 |
|
CHINA |
4.23 |
49.40 |
8.24 |
10.16 |
19.00 |
0.82 |
8.14 |
50.60 |
|
INDIA |
11.30 |
7.14 |
51.84 |
6.55 |
7.06 |
6.31 |
9.81 |
48.16 |
|
RUSSIA |
2.63 |
4.09 |
2.99 |
55.77 |
1.22 |
0.98 |
32.32 |
44.23 |
|
SA |
4.22 |
19.31 |
8.61 |
4.73 |
54.64 |
4.28 |
4.21 |
45.36 |
|
GEPU |
4.95 |
2.18 |
8.09 |
6.76 |
11.66 |
54.77 |
11.58 |
45.23 |
|
GPR |
8.19 |
3.60 |
8.61 |
26.92 |
1.28 |
5.94 |
45.46 |
54.54 |
|
TO |
35.52 |
40.23 |
54.26 |
62.15 |
41.60 |
20.31 |
75.53 |
329.60 |
|
Inc.Own |
94.02 |
89.64 |
106.09 |
117.93 |
96.24 |
75.08 |
120.99 |
cTCI/ |
|
NET |
-5.98 |
-10.36 |
6.09 |
17.93 |
-3.76 |
-24.92 |
20.99 |
54.93/ |
|
NPT |
3.00 |
2.00 |
4.00 |
5.00 |
1.00 |
0.00 |
6.00 |
In addition, Table 3 shows that Russia’s FDI has the greatest spillover to others (62.15), while Brazil’s FDI has the least spillover to others (35.52). As such, Russia is a net transmitter of FDI spillovers (17.93), along with India (6.09). On the other hand, China receives the greatest spillover from others (50.60), while Brazil also receives the least spillover from others (41.49). As a result, China is a net receiver of FDI spillovers (-10.36) along with Brazil (-5.98) and South Africa (-3.76). This indicates that China is the most heavily influenced by external FDI spillovers and global uncertainty among the BRICS nations. Nevertheless, given the significant spillovers across the BRICS nations, these findings indicate the members within the BRICS group are significantly reliant on each other for foreign financial flows. Furthermore, this interconnectedness, driven by both internal BRICS relationships and external global risks, plays a critical role in shaping FDI trends and strategies within the BRICS framework.
Russia displays substantial peaks in influence, particularly during the global financial crisis and around 2014 during its invasion of Ukraine, coinciding with periods of heightened geopolitical activity and fluctuations in global energy markets. As one of the key players in global energy, Russia’s influence peaks suggest that it was an important driver of economic conditions, particularly for the BRICS economies dependent on commodity prices. The decline in influence after 2014 might reflect international sanctions and changes in global oil dynamics.
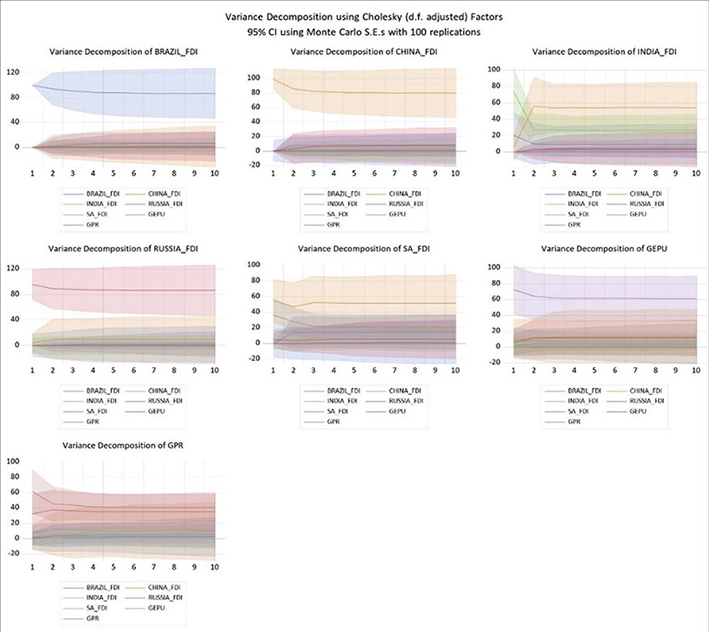
Figure 2
Dynamic Total Connectedness
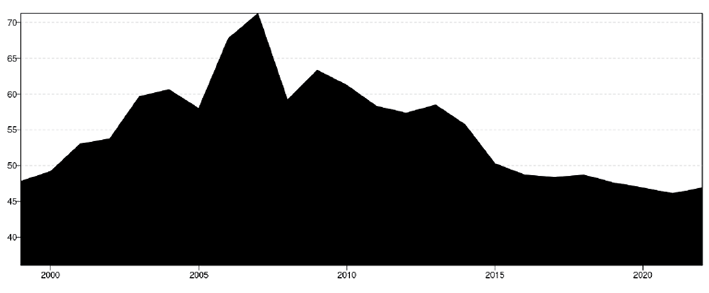
Figure 3
Dynamic Connectedness to Others
India’s FDI outflows illustrate notable spikes in influence, particularly around 2005–2008 and again in 2012–2015, indicating that it acted as a significant transmitter of economic effects during these periods. These peaks align with India’s economic reforms and growth and its increasing integration into global markets. The decline in influence post-2015 may indicate the stabilisation of India’s economic impact or a shift towards focusing on domestic resilience.
China’s influence shows substantial peaks around the early 2000s and 2008, suggesting that it was a significant driver of economic conditions for other BRICS countries and global FDI trends during these periods. The peak around 2008 coincides with China’s response to the global financial crisis, emphasising its role as a key player in stabilising or transmitting shocks. Post-2008, the decline reflects China’s focus on internal stabilisation and reducing its external vulnerabilities through domestic policy initiatives.
South Africa’s influence on other BRICS countries is relatively moderate throughout the period, with some peaks observed around the 2008 global financial crisis and during 2012–2015. These peaks suggest that South Africa’s economic conditions and political stability had a notable but limited impact on other BRICS nations. Its influence stabilises at lower levels post-2015, highlighting its peripheral role within the BRICS group.
The GPR index shows consistent levels of influence, with peaks during the mid-2000s and 2010s, particularly during heightened global political tensions. This suggests that global political uncertainties significantly impacted the BRICS countries, with GPR as a key transmitter of shocks to these economies, influencing their FDI inflows. The EPU index exhibits notable peaks around 2008 and 2011, coinciding with the global financial crisis and subsequent economic adjustment and policy uncertainty. These peaks indicate that GEPU played a substantial role in transmitting global economic uncertainties to the BRICS countries, emphasising the interconnectedness of the BRICS economies with broader global economic policy developments.
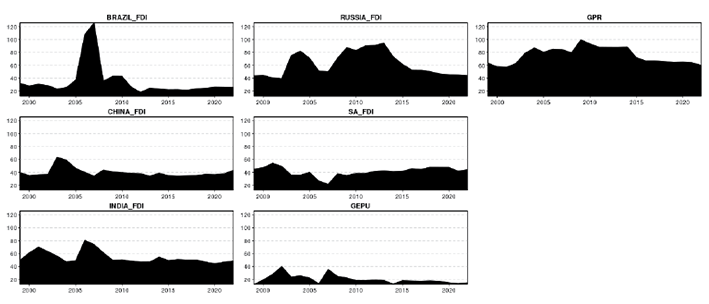
Figure 4
Dynamic Connectedness from Others
South Africa’s connectedness exhibits minor fluctuations, indicating that it neither significantly transmits nor receives shocks compared to other BRICS countries. This could be attributed to its relatively minor economic influence within the BRICS group, resulting in less interdependence with the global political and economic environment. Likewise, India’s FDI inflows show positive and negative connectedness periods, particularly around 2005–2010, suggesting it acted as a transmitter during that period. Later-year fluctuations indicate its sensitivity to external shocks and its evolving role within the global economic system.
Figure 5
Net Total Directional Connectedness
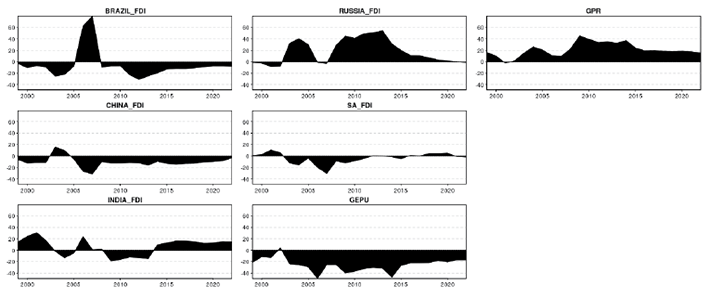
The net total directional connectedness analysis indicates that the BRICS countries experience varying degrees of influence and interdependence with global economic and geopolitical factors. Brazil and Russia show significant periods of acting as transmitters. However, China acts primarily as a receiver, highlighting its strategy of maintaining economic stability amid global fluctuations. India’s role fluctuates, showing its transitional nature within the global economic system. Nevertheless, the GPR and GEPU indices demonstrate that global geopolitical and economic policy uncertainties significantly impact BRICS’ FDI patterns, although these impacts vary depending on the country’s specific circumstances and resilience. The findings from this study affirm the presence of significant spillover effects among the BRICS countries, driven by economic, financial, and political interdependencies. These results are consistent with existing empirical studies, such as Gilenko and Fedorova (2014), who highlighted the varying intensity of spillover effects across different economic phases.
The FDI spillovers within the BRICS countries occur through several channels, including trade linkages, shared multinational enterprises, regional supply chains, and common exposure to global capital markets. For example, China’s strong manufacturing base and outward FDI often create supply chain dependencies in countries like South Africa and Brazil, amplifying spillover effects when geopolitical tensions impact China’s investment behavior. Likewise, Indian tech firms investing in South Africa contribute to knowledge and technology transfers, which are disrupted during the periods of heightened uncertainty.
Geopolitical events exert tangible effects on these spillovers. For instance, Russia’s 2014 annexation of Crimea and the 2022 invasion of Ukraine led to economic sanctions and reduced Western FDI inflows, compelling Russia to redirect its investments towards BRICS allies like China and India. This shift is evident in the increased FDI connectedness observed in our DY spillover results during these periods. Similarly, the U.S.–China trade war escalations between 2018–2020 triggered capital reallocation by Chinese firms to more politically aligned or neutral BRICS members, such as Brazil and South Africa, thereby intensifying bilateral FDI spillovers. These real-world developments reinforce the findings that geopolitical risks significantly amplify or distort investment flows, particularly when traditional Western financial avenues become volatile or restricted.
Overall, the findings from this study underscore the importance of coordinated policy responses within the BRICS framework. The interrelated nature of their economies emphasises the need for a proactive approach to managing both external and internal shocks, a theme central to this research. Furthermore, these findings enable policymakers to tackle the challenges of geopolitical risk in a proactive manner. By strategically steering the countries within BRICS towards greater stability and resilience, they can lessen the negative impact of economic shocks (Asomaning et al., 2024). Achieving this goal may involve reducing external dependencies and controls. In this regard, a more self-reliant economic system with limited external interference would help to resist the harmful effects of geopolitical risk. Specifically, curbing excessive political spending could strengthen domestic financial capacities, leading to increased domestic investments (Asomaning et al., 2024). Additionally, policy transparency and investment knowledge need to be enhanced in these countries, as the GPR and EPU indices demonstrate that global political and economic uncertainty significantly impact BRICS’ FDI patterns. The need for enhanced investor understanding stems from the risk contagion as research suggests that investors need to be aware of risk transmission between interconnected countries and attempt to mitigate this contagion.
While the DY connectedness graphs offer detailed technical insight, their practical implications are also important. The interconnected FDI flows within BRICS reveal how economic or political instability in one country can swiftly influence others, especially where investment linkages are deep (e.g., China–South Africa, Russia–India). For example, during Russia’s geopolitical tensions in 2014 and 2022, the country shifted outward investments towards politically aligned BRICS members. This strategic redirection illustrates how geopolitical shocks can create temporary opportunities for BRICS partners, while also exposing them to new risks from increased dependency.
For investors, this implies the need for regionally diversified portfolios within BRICS that hedge against such bilateral dependencies. For policymakers, the results suggest that strengthening intra-BRICS investment treaties and enhancing risk-sharing mechanisms through instruments like the New Development Bank could help stabilize FDI flows. Moreover, given that GPR had a more significant effect than EPU on FDI volatility, countries with volatile political climates (e.g., Russia, South Africa) must improve transparency, de-escalate conflicts, and adopt more neutral foreign policy stances to remain attractive to investors.
5. Conclusion
This study investigates the influence of economic policy uncertainty (EPU) and geopolitical risk (GPR) on foreign direct investment (FDI) spillovers among the BRICS nations from 1998 to 2023, employing a Time-Varying Parameter VAR model and the Diebold-Yilmaz spillover index. The results reveal a high level of interconnectedness in FDI flows across the BRICS countries, with Russia identified as a net transmitter and China as a net receiver of spillovers. Notably, geopolitical risk emerged as a more dominant driver of FDI volatility than EPU, underlining the importance of political stability in shaping cross-border investment dynamics. These findings carry several practical implications for investors and policymakers. Investors are encouraged to closely monitor geopolitical indicators such as the GPR index to anticipate shifts in FDI trends. Diversifying investment portfolios within emerging markets should involve a strategic emphasis on net FDI receivers like China and South Africa, which tend to exhibit more stable investment profiles during the periods of global uncertainty. Furthermore, given Russia’s consistent role as a transmitter of FDI shocks — particularly during conflict periods — investment strategies should integrate political risk assessments to better manage exposure.
From a policy perspective, regional initiatives such as the Contingent Reserve Arrangement (CRA) should be strengthened to act as buffers against geopolitical and economic disruptions. Policymakers, especially in countries like India and Brazil, should prioritize regulatory transparency and policy consistency to reduce the impact of EPU on investment flows. Moreover, to mitigate vulnerability to geopolitical shocks, the BRICS governments must pursue peaceful diplomatic engagement and adopt economically neutral stances that foster investor confidence.
In light of these conclusions, future research should explore sector-specific FDI spillovers and assess the role of institutional quality in mediating the effects of geopolitical shocks. Ultimately, the study highlights the pressing need for coordinated BRICS strategies that enhance resilience against external disturbances and sustain long-term regional investment growth.
References
Agarwal, M., & Kumar, S. (2023). BRICS Countries’ Increasing Role in the World Economy, Including Institutional Innovation. BRICS Journal of Economics, 4(2), 173–191.
Alper, A. E. (2018). An Analysis on The Relationship Between Political Stability and Economic Performance in BRICS-T Countries. Business and Economics Research Journal, 9(1), 49–56.
An, X., Barnett, W. A., Wang, X., & Wu, Q. (2022). Brexit spillovers: How economic policy uncertainty affects foreign direct investment and international trade. The European Journal of Finance, 29(16), 1913–1932.
Asomaning, K. O., Hamayoon, S., & Uche, E. (2024). A TVP-var assessment of the spillover effects of geopolitical risk shocks on macroeconomic variability: A study of the Ghanaian economy. Future Business Journal, 10(1), 55.
Baker, S. R.,Bloom, N., & Davis, S. J. (2016). Measuring Economic Policy Uncertainty. The Quarterly Journal of Economics, President and Fellows of Harvard College, 131(4), 1593–1636.
Balassa, B. (1961). The Theory of Economic Integration. George Allen & Unwin. Available at: https://doi.org/10.1111/j.1467-6435.1961.tb02365.x [Accessed: 03 October 2024].
Caldara, D., & Iacoviello, M. (2022). Measuring geopolitical risk. American Economic Review, 112(4), 1194–1225.
Deng, Q., Xiao, W., & Yan, H. (2022). The spillover effects of US monetary policy normalization on the BRICS based on panel VAR Model. Journal of Mathematics, 2022(1), 3844128.
Drezner, D. W. (2019). Policy coordination and economic spillovers in BRICS. Global Governance, 26(3), 421–440.
Fang, Y., Jing, Z., Shi, Y., & Zhao, Y. (2021). Financial spillovers and spillbacks: New evidence from China and G7 countries. Economic Modelling, 94, 184–200.
Gilenko, E., & Fedorova, E. (2014). Internal and external spillover effects for the BRIC countries: Multivariate garch-in-mean approach. Research in International Business and Finance, 31, 32–45.
Heckscher, E., & Ohlin, B. (1933). International and Inter-Regional Trade. Cambridge: Harvard University Press. https://www.abebooks.com/first-edition/Interregional-International-Trade-OHLIN-Bertil-Cambridge/372604098/bd
Jadhav, P. (2012). Determinants of foreign direct investment in BRICS economies: Analysis of economic, institutional and political factor. Procedia - Social and Behavioral Sciences, 37, 5–14.
Kayral, I. E., & Tandogan, N. S. (2020). Return and volatility spillovers between the Baltic States: An application with MGARCH and DY model. Current Researches in Economics and Administrative Sciences, 47, 339–355.
Kong, Q., Li, R., Wang, Z., & Peng, D. (2022). Economic policy uncertainty and firm investment decisions: Dilemma or opportunity?. International Review of Financial Analysis, 83, 102301.
Korobilis, D., & Yilmaz, K. (2018). Measuring Dynamic Connectedness with Large Bayesian VAR Models. Colchester: University of Essex. Available at: https://dx.doi.org/10.2139/ssrn.3099725
Kunjal, D., & Suvvari, A. R. (2024).‘Do Economic and Geopolitical Risks Matter for Banks’ Lending Decisions, Credit Risk, Performance, and Stability in South Africa?. Finance, Accounting and Business Analysis (FABA), 6(1), 74–85.
Li, R., Tang, G., Hong, C., Li, S., Li, B., & Xiang, S. (2024). A study on economic policy uncertainty, geopolitical risk and stock market spillovers in BRICS countries. The North American Journal of Economics and Finance, 73, 102189.
Makrelov, K., Pillay, N., & Morule, B. (2023). Fiscal risks and their impact on banks’ capital buffers in South Africa. South African Journal of Economics, 91(1), 116–134.
Maryam, J., & Mittal, A. (2020). Foreign direct investment into BRICS: An empirical analysis. Transnational Corporations Review, 12, 1–9.
Milas, C., Panagiotidis, T., & Papapanagiotou, G. (2024). UK Foreign Direct Investment in uncertain economic times. Journal of International Money and Finance, 147, 103132.
Msomi, S., & Kunjal, D. (2024). Industry-specific effects of economic policy uncertainty on stock market volatility: A GARCH-MIDAS approach. Quantitative Finance and Economics, 8(3), 532–545.
Mundell, R. A. (1961). A Theory of Optimum Currency Areas. The American Economic Review, 51, 509–517.
Nach, M., & Ncwadi, R. (2024). BRICS economic integration: Prospects and challenges. South African Journal of International Affairs, 31(2), 151–166.
Olawumi, A. D. (2019). Human Capital Development and economic growth in BRICS countries: Controlling for country differences. Journal of Economics and Behavioral Studies, 11(4), 1–17.
Prasad, J., Gardner, D. M., Leong, F. T., Zhang, J., & Nye, C. D. (2021). The criterion validity of career adapt–abilities scale with cooperation among Chinese workers. Career Development International, 26(2), 252–268.
Prebisch, R. (1950). The Economic Development of Latin America and Its Principal Problems, United Nations Department of Economic Affairs. Economic Commission for Latin America (ECLA), New York. http://archivo.cepal.org/pdfs/cdPrebisch/002.pdf
Primiceri, G. E. (2005). Time varying structural vector autoregressions and monetary policy. The Review of Economic Studies, 72(3), 821–852.
Raddant, M., & Kenett, D. Y. (2021). Interconnectedness in the global financial market. Journal of International Money and Finance, 110, 102280.
Romer, P. M. (1990). Endogenous technological change. Journal of Political Economy, 98(5), S71–S102.
Shi, K. (2021). Spillovers of stock markets among the BRICS: New evidence in time and frequency domains before the outbreak of covid-19 pandemic. Journal of Risk and Financial Management, 14(3), 11.
Stuenkel, O. (2020). The BRICS and the Future of Global Order (2nd ed.). United Kingdom: Lexington Books.
Vyas-Doorgapersad, S. (2022). The role of BRICS in global governance to promote economic development. Africa’s Public Service Delivery & Performance Review, 10(1), 9.
Wang, Y., Cheng, S., & Cao, Y. (2022). How does economic policy uncertainty respond to the global oil price fluctuations? Evidence from BRICS countries. Resources Policy, 79.
Zhang, B., Ma, J., Khan, M. A., Repnikova, V., Shidlovskaya, K., Barykin, S., & Ahmad, M. S. (2023). The Effect of Economic Policy Uncertainty on Foreign Direct Investment in the Era of Global Value Chain: Evidence from the Asian Countries. Sustainability, 15(7), 6131.
Zhang, H., Chen, J., & Shao, L. (2021). Dynamic spillovers between energy and stock markets and their implications in the context of COVID-19. International Review of Financial Analysis, 77, 101828.
Zhang, L., & Colak, G. (2021). Foreign direct investment and economic policy uncertainty in China. Economic and Political Studies, 10(3), 279–289.
Zhang, Y., & Hamori, S. (2022). A connectedness analysis among BRICS’s geopolitical risks and the US in macroeconomy. Economic Analysis and Policy, 76, 182–203.